


PyLab Python模块,属于Matplotlib数学库。PyLab结合数值与图形绘制模块模块numpy pyplot。PyLab交互式Python解释器的设计思想,因此它的许多功能是很经典的(属于小而巧那种)。这使得它非常有效和方便的数学工具。如果你想安装PyLab,您还必须安装Matplotlib。这个过程相当简单,采用标准的安装过程;
windows下的安装:pip install -U matplotlib
或者easy_install matplotlib (但这两种我都没有成功。。唉~)
最好使得就是下载exe直接抽取安装
模块下载地址:matplotlib模块下载地址whl文件
或者matplotlib exe文件(推荐这个~简单!)
参考文章:Python-Matplotlib安装及简单使用
使用pylab还需要安装numpy,scipy等模块,以及dateutil 和 pyparsing;(但亲测我只装了pyparsing)
下载地址:pyparsing下载
或者在cmd环境下直接pip install -U pyparsing or easy_install pyparsing也可以;
好~安装完后,我在Python 命令窗口输入import matplotlib出现了错误。。。
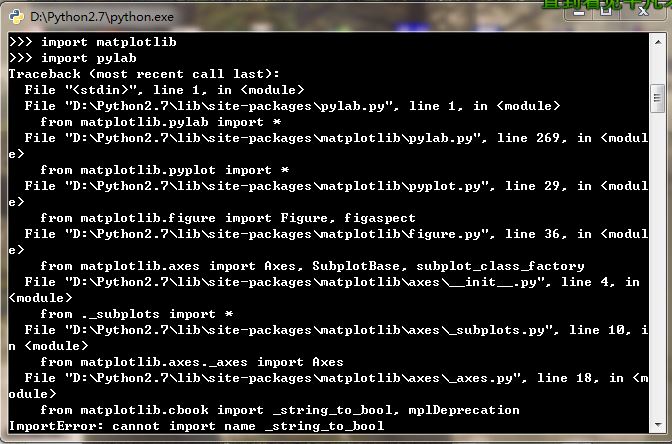
……………………………..
经过网上查阅解决办法有人提出
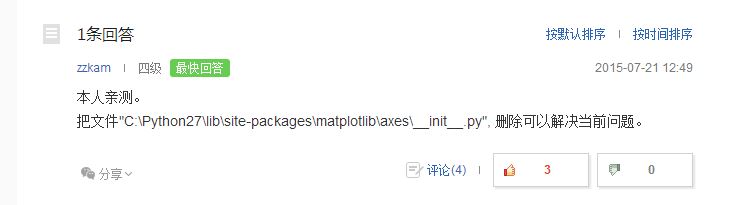
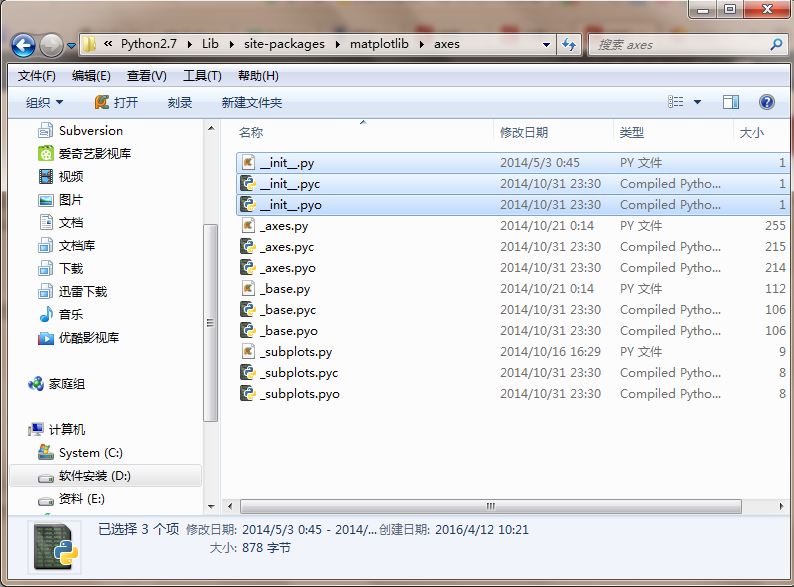
然而在我手里面删掉了init.py运行仍然还是有问题,一怒之下将里面关于初始化的init的相关的3个文件都删了~~
~~~~~~~~~~奇迹就出现了~~~~~~~~~~~~~~
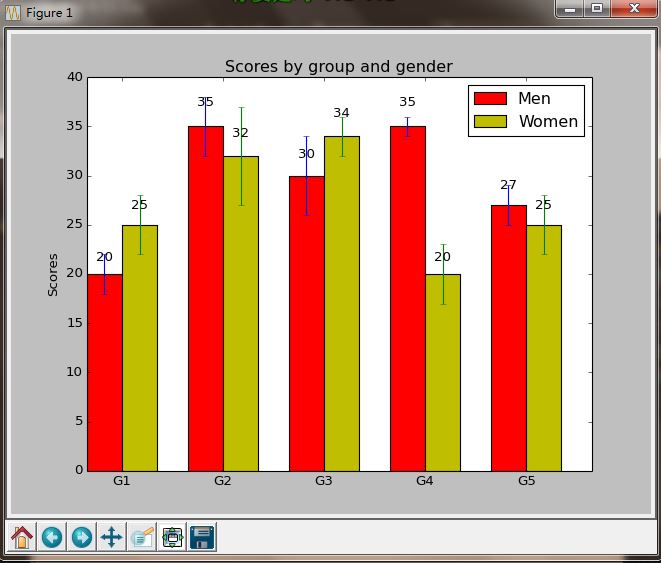
附录:[示例程序]>>>>>>来源于网络
__author__ = 'Administrator'
import numpy as np
#import matplotlib.pyplot as plt
from matplotlib import pyplot as plt
N = 5
menMeans = (20, 35, 30, 35, 27)
menStd =   (2, 3, 4, 1, 2)

ind = np.arange(N)  # the x locations for the groups
width = 0.35       # the width of the bars

fig, ax = plt.subplots()
rects1 = ax.bar(ind, menMeans, width, color='r', yerr=menStd)

womenMeans = (25, 32, 34, 20, 25)
womenStd =   (3, 5, 2, 3, 3)
rects2 = ax.bar(ind+width, womenMeans, width, color='y', yerr=womenStd)

# add some
ax.set_ylabel('Scores')
ax.set_title('Scores by group and gender')
ax.set_xticks(ind+width)
ax.set_xticklabels( ('G1', 'G2', 'G3', 'G4', 'G5') )

ax.legend( (rects1[0], rects2[0]), ('Men', 'Women') )

def autolabel(rects):
    # attach some text labels
    for rect in rects:
        height = rect.get_height()
        ax.text(rect.get_x()+rect.get_width()/2., 1.05*height, '%d'%int(height),
                ha='center', va='bottom')

autolabel(rects1)
autolabel(rects2)

plt.show()


 8922
8922

 被折叠的 条评论
为什么被折叠?
被折叠的 条评论
为什么被折叠?
 到【灌水乐园】发言


