


导入需要用到的库
#2019.7.14 By Zhong_sir
import pandas as pd
from pandas import DataFrame
import matplotlib.pyplot as plt
from matplotlib.ticker import MultipleLocator, FuncFormatter
%matplotlib inline
pd.set_option("display.max_rows",5000)
pd.set_option("display.max_columns",50)
数据获取及异常处理
通过网络爬虫已完成数据获取,之前有介绍,这里不再啰嗦。可利用requests和xpath等完成,注意伪装浏览器并设置time.sleep尽可能长。通过对爬到的文件进行观察,使用替换、过滤等命令完成异常处理(缺失、重复、异常等)
读取爬到的源文件并初始化
#2019.7.14 By Zhong_sir
alldata = pd.read_excel("最终结果.xls",header = None)
# print(alldata)
ISTEST = False
stationID = 'CHM00059663'
df_PRCP = DataFrame(columns=['datetime', 'year', 'month', 'day', 'dayIndex', 'value'])
nrow = alldata.shape[0]
pdi = 0
pMax = 0
数据处理
异常处理之前已经单独解决,这里就直接使用,舒服。。。
#2019.7.14 By Zhong_sir
def month_formatter(x):
    v = int(x / 31) + 1
    if v > 12:
        return '-'
    else:
        return str(v)

for row in range(0,nrow):
    dataList = alldata.iloc[row,:]
    dataList = list(dataList)
    _title = dataList[0]
    _year = _title.replace(stationID, '')[0:4]
    _month = _title.replace(stationID, '')[4:6]
    _type = _title.replace(stationID, '')[6:10]
    print('已处理完 ' + str(_year) + str(_month) + '数据')
    for i in range(1, len(dataList)):
        _datetime = str(_year) + '-' + str(_month) + '-' + str(i)
        if _type == 'PRCP':
            if _month == '01' and i == 1:
                pdi = 1
            else:
                pdi += 1
            _value = float(dataList[i])
            if _value > pMax:
                pMax = _value
                pMaxTime = _year + '/' + _month + '/' + str(i)
            _df = DataFrame({'datetime': [_datetime], 'year': [_year], 'month': [_month], 'day': [i], 'dayIndex': [pdi],
                            'value': [_value]})
            df_PRCP = df_PRCP.append(_df, ignore_index=True)
保存到Excel中
#2019.7.14 By Zhong_sir
df_PRCP.to_excel("1952-2019降雨数据.xlsx")
可视化设置
#2019.7.14 By Zhong_sir
df_PRCP = df_PRCP.set_index('datetime')
plt.rcParams['figure.figsize'] = (10, 6)
plt.rcParams['image.cmap'] = 'gray'
plt.rcParams['font.sans-serif'] = ['SimHei']
plt.rcParams['image.interpolation'] = 'nearest'
plt.rcParams['figure.dpi'] = 200
plt.rcParams['savefig.dpi'] = 200
可视化展示一
#2019.7.14 By Zhong_sir
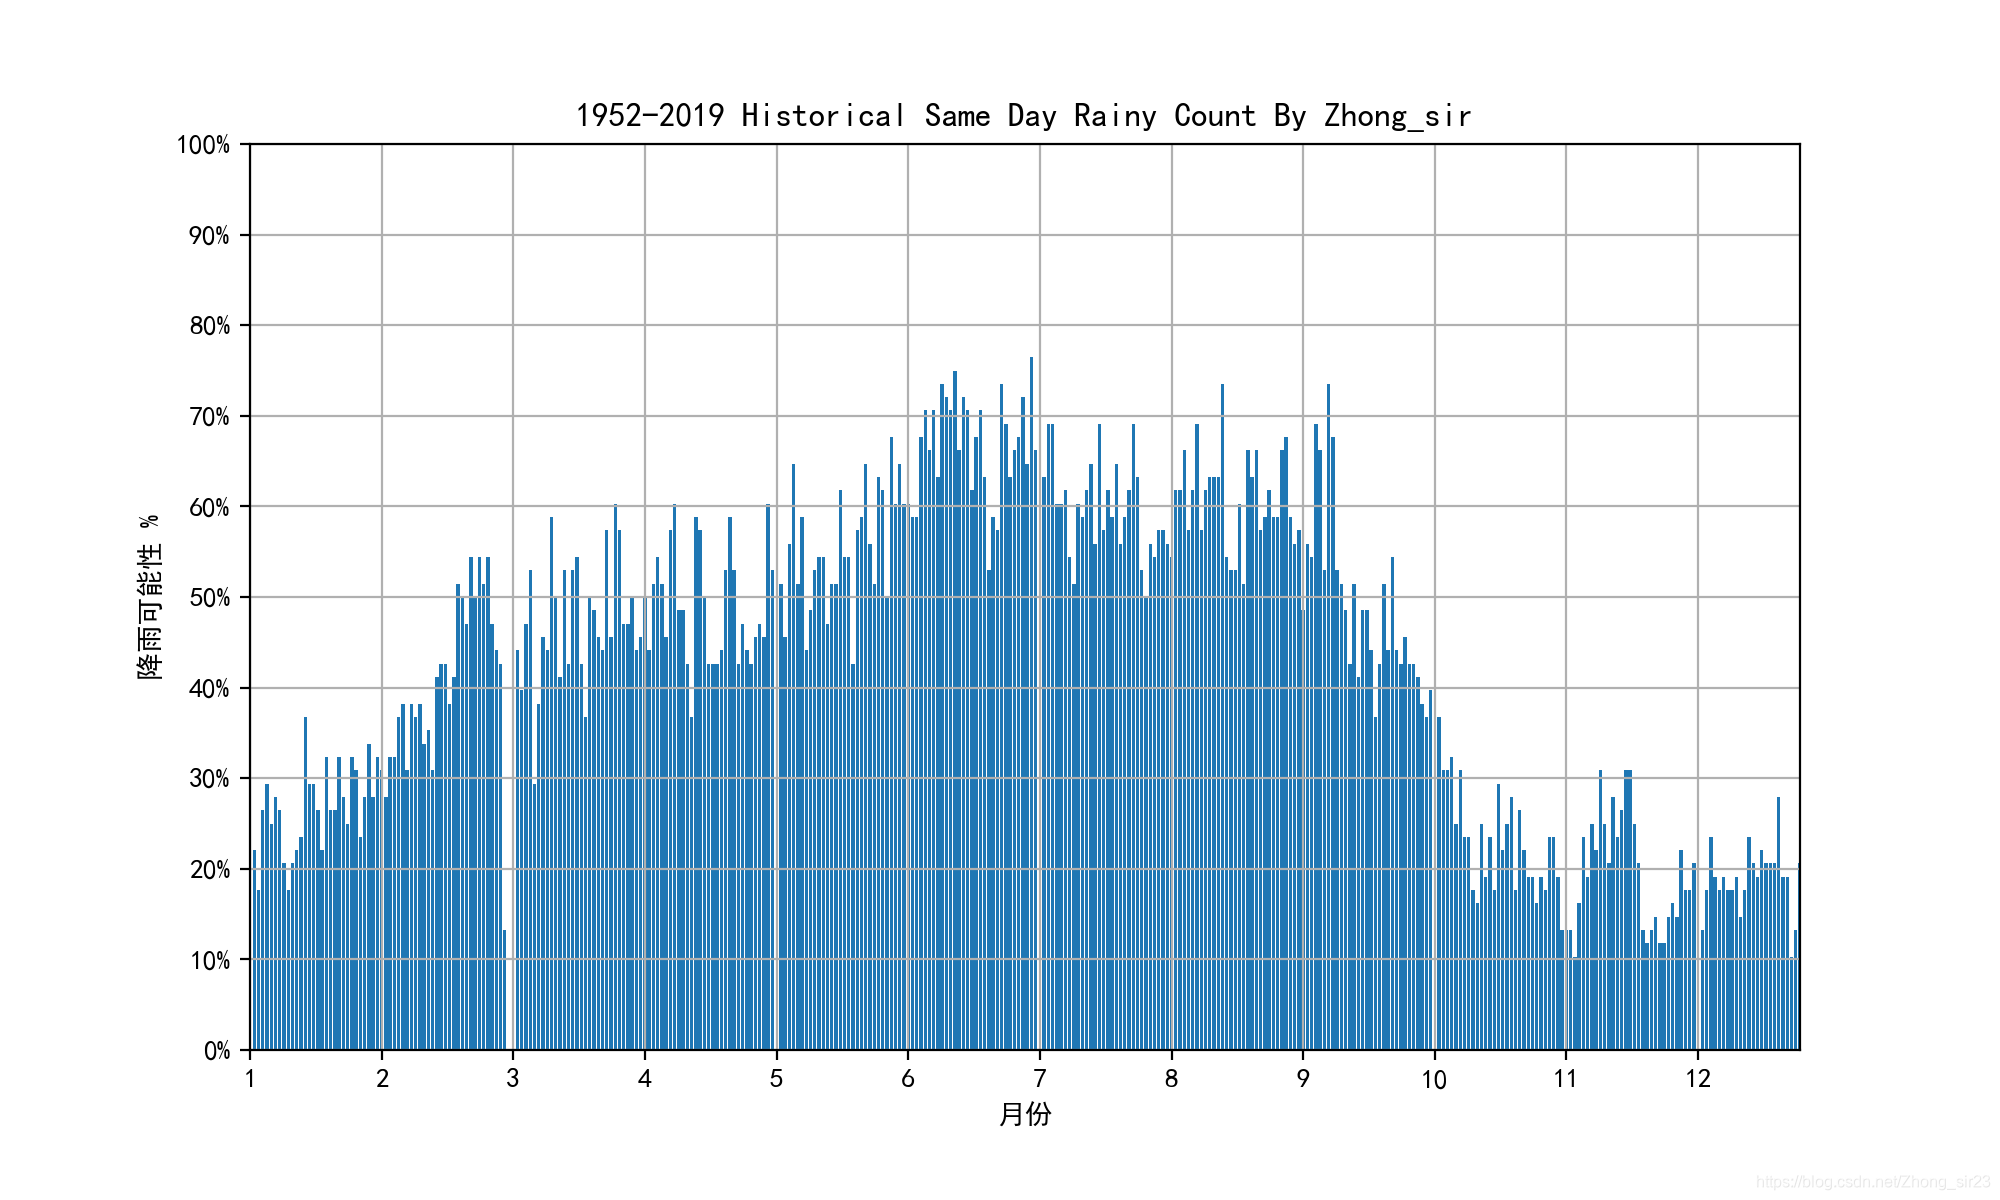
se_rainyD = (df_PRCP[df_PRCP['value'] > 0]).groupby('year')['value'].count()
df_rainyD = se_rainyD.to_frame('rainyDays')
se_HisRainyD = (df_PRCP[df_PRCP['value'] > 0]).groupby('dayIndex')['value'].count()
plt.xlabel("月份")
plt.ylabel("降雨可能性 %")
plt.title(" 1952-2019 Historical Same Day Rainy Count By Zhong_sir ")
plt.bar(se_HisRainyD.index, se_HisRainyD / len(df_PRCP.groupby('year')) * 100)
plt.gca().xaxis.set_major_locator(MultipleLocator(31))
plt.gca().xaxis.set_major_formatter(FuncFormatter(month_formatter))
plt.gca().grid()
plt.xlim(0, 365)
plt.ylim(0, 100)
plt.gca().yaxis.set_major_locator(plt.MultipleLocator(10))
plt.gca().yaxis.set_major_formatter(FuncFormatter(lambda x, y: str(y * 10 - 10) + '%'))
if ISTEST == False:
plt.savefig("历史上同一天下雨概率统计.png")
plt.show()
可视化展示二
#2019.7.14 By Zhong_sir
plt.gca().xaxis.set_major_locator(MultipleLocator(31))
plt.gca().xaxis.set_major_formatter(FuncFormatter(month_formatter))
plt.gca().yaxis.set_major_locator(plt.MultipleLocator(20))
plt.gca().yaxis.set_major_formatter(FuncFormatter(lambda x, y: str(y * 20) + 'mm'))
plt.gca().grid()
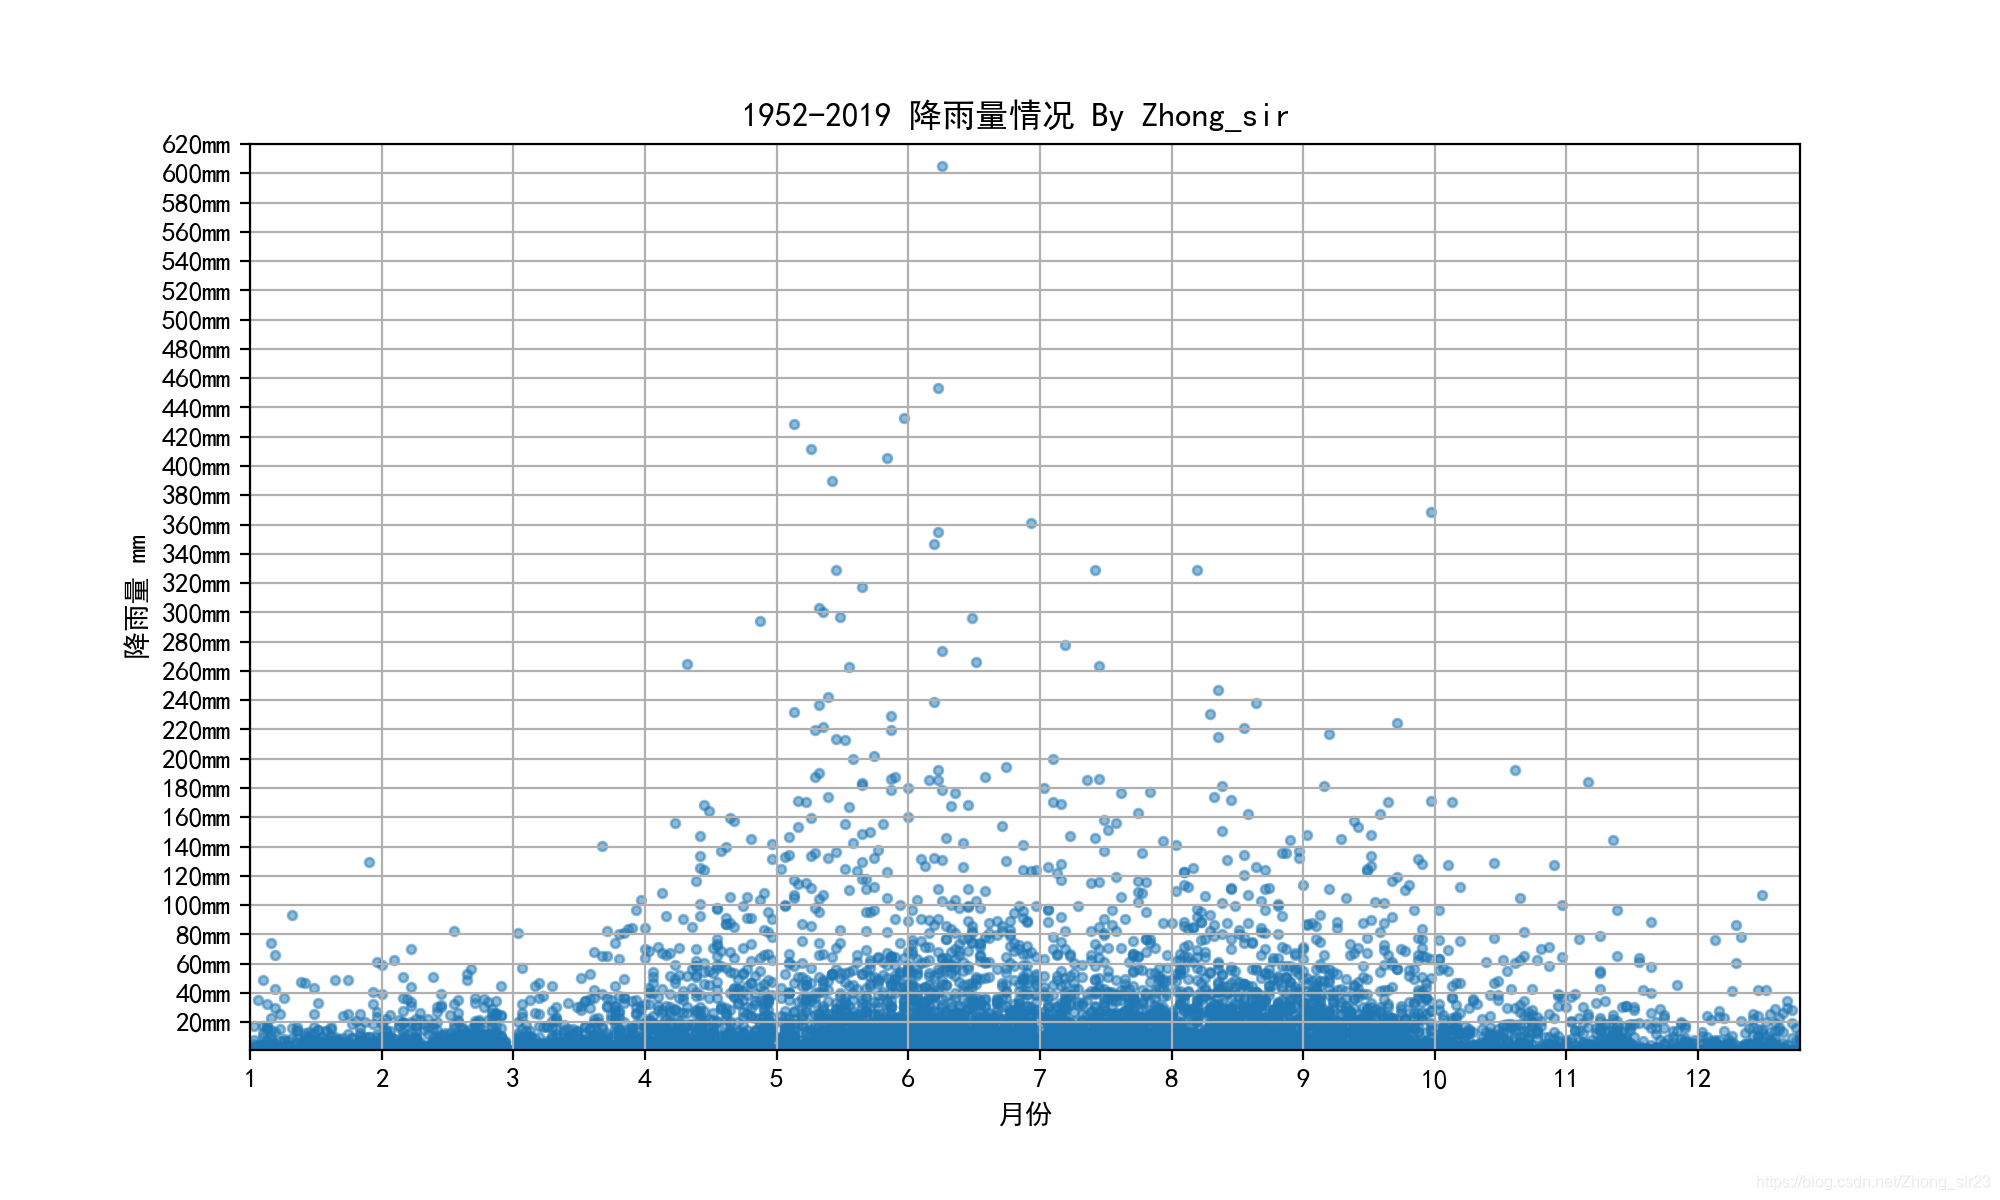
plt.scatter(df_PRCP['dayIndex'], df_PRCP['value'], s=40, marker='.', alpha=0.5)
plt.xlim(0, 365)
plt.ylim(1, 620)
plt.title('1952-2019 降雨量情况 By Zhong_sir ')
plt.xlabel("月份")
plt.ylabel("降雨量 mm")
if ISTEST == False:
plt.savefig("历史降雨量分布.png")
plt.show()
可视化展示三
#2019.7.14 By Zhong_sir
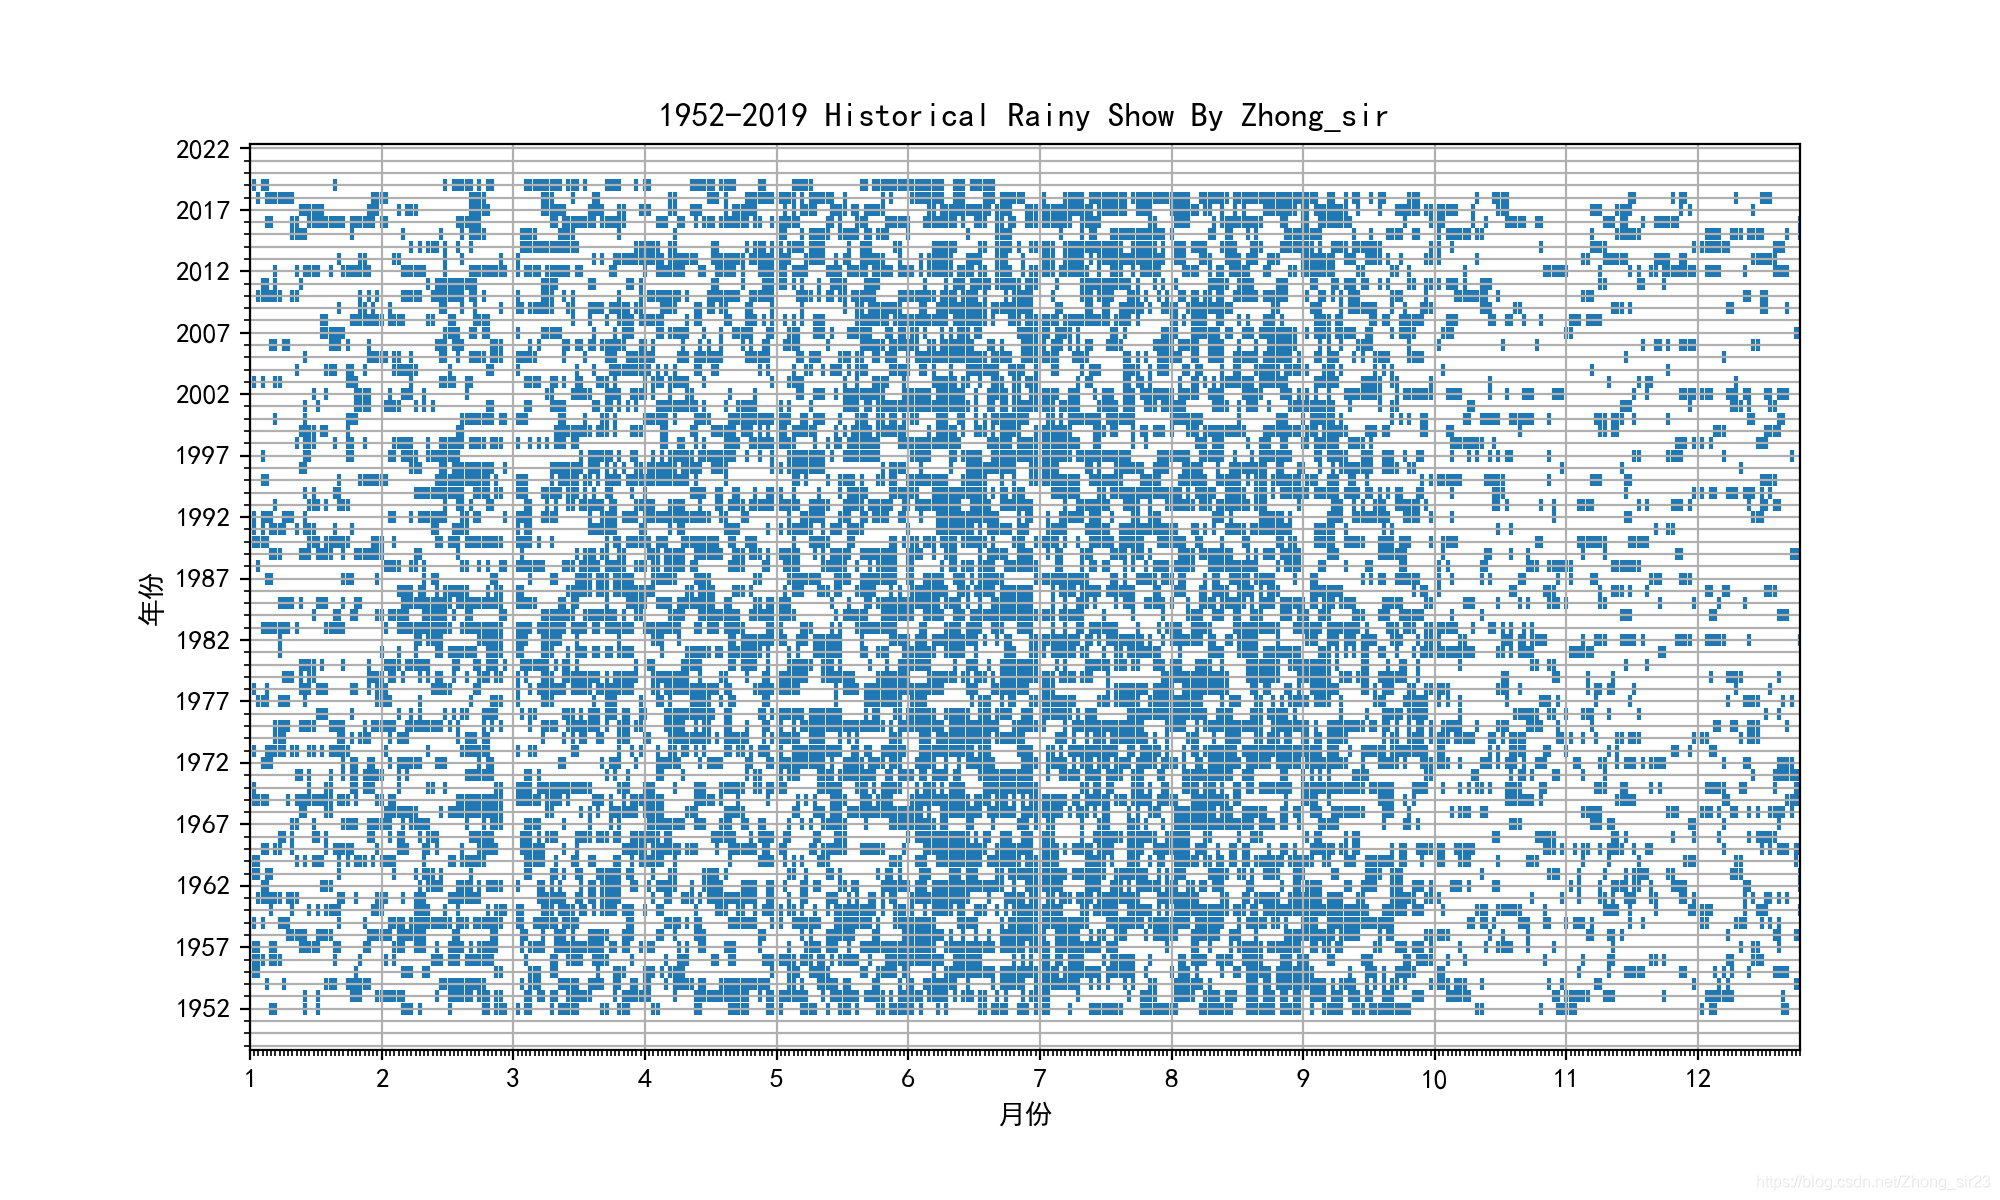
df_rainyAll = df_PRCP[df_PRCP['value'] > 0]
plt.scatter(df_rainyAll['dayIndex'], df_rainyAll['year'], s=20, marker='|', alpha=1)
plt.xlabel("月份")
plt.ylabel("年份")
plt.title(" 1952-2019 Historical Rainy Show By Zhong_sir ")
plt.xlim(0, 365)
plt.gca().xaxis.set_major_locator(MultipleLocator(31))
plt.gca().xaxis.set_major_formatter(FuncFormatter(month_formatter))
plt.gca().yaxis.set_major_locator(MultipleLocator(5))
plt.gca().yaxis.set_major_formatter(FuncFormatter(lambda x, y: int(x + 1952)))
plt.gca().xaxis.set_minor_locator(MultipleLocator(1))
plt.gca().yaxis.set_minor_locator(MultipleLocator(1))
plt.gca().xaxis.grid(True, which='major')
plt.gca().yaxis.grid(True, which='minor')
if ISTEST == False:
plt.savefig("历史降雨情况.png")
plt.show()
总结
图形还未加上色彩模块,后续跟进!这段时间就先缓缓。先做土工试验和学abaqus数值模拟吧,导师催得紧。。。


 7820
7820

 被折叠的 条评论
为什么被折叠?
被折叠的 条评论
为什么被折叠?
 到【灌水乐园】发言


