


Prometheus 监控
Prometheus 监控系统的架构包括以下组件:
Prometheus Server:
Prometheus 服务器是监控系统的核心组件,负责收集、存储和处理指标数据。它定期从各种数据源(如 Exporter、Agent 等)拉取指标数据,并将其存储在本地的时序数据库中。Prometheus 服务器还提供了强大的查询语言(PromQL),用于对数据进行实时查询和分析。
Exporter:
Exporter 是用于从不同数据源中收集指标数据的组件。Prometheus 社区提供了许多官方 Exporter,如 Node Exporter(用于收集主机级别的系统指标)、Blackbox Exporter(用于进行健康检查)、MySQL Exporter(用于监控 MySQL 数据库)等。此外,还有许多第三方 Exporter 可用于监控各种不同类型的应用程序和服务。
Push Gateway:
Push Gateway 是一个中间件组件,用于接收短暂性作业(如批处理任务、临时服务等)生成的指标数据,并将其暂时存储在内存中,以便被 Prometheus 服务器拉取。这使得 Prometheus 能够监控短暂性作业,而无需这些作业一直在线。
Alertmanager:
Alertmanager 是用于处理和发送警报的组件。它与 Prometheus 集成,负责管理警报规则、接收来自 Prometheus 服务器的警报通知,并根据配置的策略进行处理,如抑制重复警报、分组、静默等,然后将警报发送到各种通知渠道(如电子邮件、Slack 等)。
存储:
Prometheus 使用本地磁盘存储时序数据库,以存储收集到的指标数据。这使得 Prometheus 能够快速高效地查询历史数据,并支持灵活的数据保留策略。此外,Prometheus 还支持与远程存储系统(如 InfluxDB、Google Cloud Storage 等)集成,以实现长期存储。
Grafana:
尽管 Grafana 不是 Prometheus 的一部分,但它经常与 Prometheus 一起使用,用于创建仪表盘、图表和报表,以实时展示和分析监控数据。Grafana 提供了丰富的可视化功能,使用户能够直观地了解系统的运行状态和性能指标。
整个 Prometheus 监控系统的架构设计灵活且模块化,可以根据具体的需求和场景进行定制和扩展。通过合理配置和组合各种组件,可以构建一个高效、稳定且功能丰富的监控解决方案,帮助用户实时监控和管理其 IT 基础架构和应用程序。
准备
- 两台虚拟机
192.168.100.125  Prometheus端
192.168.100.126 node端- 开放防火墙端口
更改防火墙
在两台机器执行
请运行以下命令以开放端口
firewall-cmd --zone=public --add-port=80/tcp --permanent
firewall-cmd --zone=public --add-port=22/tcp --permanent
firewall-cmd --zone=public --add-port=3000/tcp --permanent
firewall-cmd --zone=public --add-port=9115/tcp --permanent
firewall-cmd --zone=public --add-port=9090/tcp --permanent
firewall-cmd --zone=public --add-port=9100/tcp --permanent
firewall-cmd --reload
1、打开 SELinux 的配置文件
vi /etc/selinux/config2、在打开的配置文件中,找到SELINUX这一行。这一行可能设置为enforcing(强制模式)或permissive(宽容模式)。如果你想要将 SELinux 设置为宽容模式,确保这一行的值是permissive:
SELINUX=permissive3、保存并关闭文件。如果你使用的是 vi 编辑器,按Esc,然后输入:wq并按Enter来保存并退出。
4、为了让新的 SELinux 配置生效,你需要重启你的系统:
reboot5、或者,你也可以尝试使用setenforce命令临时将 SELinux 设置为宽容模式,但这只是临时的,重启后 SELinux 会恢复到配置文件中的设置:
setenforce 0一、Prometheus 部署
Prometheus:
Prometheus 是一种开源的系统监控和警报工具包。它最初由 SoundCloud 开发,现已成为 CNCF(云原生计算基金会)的一部分。Prometheus 具有多维数据模型和灵活的查询语言,可实时收集和存储各种系统指标,如 CPU 使用率、内存使用率、磁盘空间、网络流量等。它支持通过 HTTP 等多种方式进行数据抓取,并能够对数据进行长期存储和分析。
以下在 Prometheus 端执行
1、下载wget
yum install wget2、在线下载
wget https://github.com/prometheus/prometheus/releases/download/v2.37.2/prometheus-2.37.2.linux-amd64.tar.gz
或者更快--wget https://githubfast.com/prometheus/prometheus/releases/download/v2.37.2/prometheus-2.37.2.linux-amd64.tar.gz
3、解压到/usr/local/,再重命名
tar -xzvf prometheus-2.37.2.linux-amd64.tar.gz -C /usr/local
cd /usr/local
mv prometheus-2.37.2.linux-amd64 prometheus
4、查看Prometheus 版本
cd /usr/local/prometheus
./prometheus  --version
检查 prometheus.yml 格式的命令(一定要在/usr/local/prometheus 目录下执行)
cd /usr/local/prometheus
./promtool check config prometheus.yml
5、创建 prometheus 本地 TSDB 数据存储目录
mkdir -p /var/lib/prometheus6、使用systemctl 管理 Prometheus
vi /usr/lib/systemd/system/prometheus.service


[Unit]
Description=Prometheus
Documentation=https://prometheus.io/
After=network.target

[Service]
Type=simple
User=root
ExecStart=/usr/local/prometheus/prometheus --config.file=/usr/local/prometheus/prometheus.yml --storage.tsdb.path=/var/lib/prometheus --web.enable-lifecycle
ExecReload=/bin/kill -HUP $MAINPID
KillMode=process
Restart=on-failure

[Install]
WantedBy=multi-user.target![]()
7、设置 Prometheus 开机启动
systemctl enable prometheus
systemctl start prometheus
8、查看prometheus 服务状态
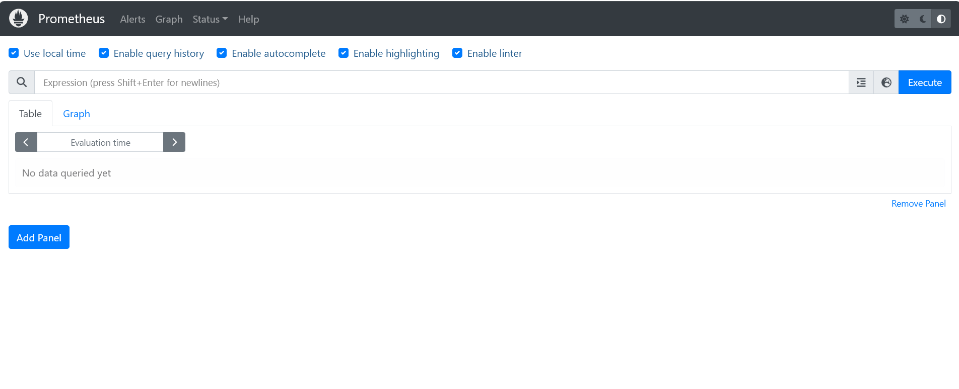
systemctl status prometheus9、访问Prometheus 的网页界面
浏览器输入 http://你的 ip 地址:9090
二、node-exporter 部署
Node Exporter:
Node Exporter 是 Prometheus 生态系统中的一个组件,用于收集主机级别的系统指标。它是一个轻量级的代理,定期收集主机的 CPU、内存、磁盘、网络等指标,并将其暴露为 Prometheus 可以拉取的格式。Node Exporter 使得 Prometheus 能够监控和记录服务器的性能指标,从而实现对整个基础架构的实时监控和分析。
以下在 node 端执行
1、给被监控的机器下载和解压 node-exporter
yum install wget -y
wget https://github.com/prometheus/node_exporter/releases/download/v1.4.0/node_exporter-1.4.0.linux-amd64.tar.gz
tar -zvxf node_exporter-1.4.0.linux-amd64.tar.gz   -C /usr/local/
cd /usr/local
mv node_exporter-1.4.0.linux-amd64 node_exporter
如果下载慢试试
wget https://githubfast.com/prometheus/node_exporter/releases/download/v1.4.0/node_exporter-1.4.0.linux-amd64.tar.gz2、systemctl 管理 node_exporter
vi /usr/lib/systemd/system/node_exporter.service
[Unit]
Description=node_exporter
Documentation=https://prometheus.io/
After=network.target
[Service]
Type=simple
User=root
ExecStart=/usr/local/node_exporter/node_exporter
ExecReload=/bin/kill -HUP $MAINPID
KillMode=process
Restart=on-failure
[Install]
WantedBy=multi-user.target
![]()
3、设置开机启动
systemctl enable node_exporter
systemctl start node_exporter
以下在 prometheus 端执行
4、在prometheus 主机添加 node 节点监控
在 prometheus Server 配置文件中添加被监控的机器
vi  /usr/local/prometheus/prometheus.yml

添加

  - job_name: "node1"
    static_configs:
    - targets: ['被监控的计算机IP:9100']
5、检查prometheus.yml 格式(一定要在 /usr/local/prometheus 目录下执行)
cd /usr/local/prometheus
/usr/local/prometheus/promtool check config prometheus.yml
6、热加载 prometheus 配置
curl -X POST http://127.0.0.1:9090/-/reload7、访问Prometheus 的网页界面,查看 node 节点已经被监控
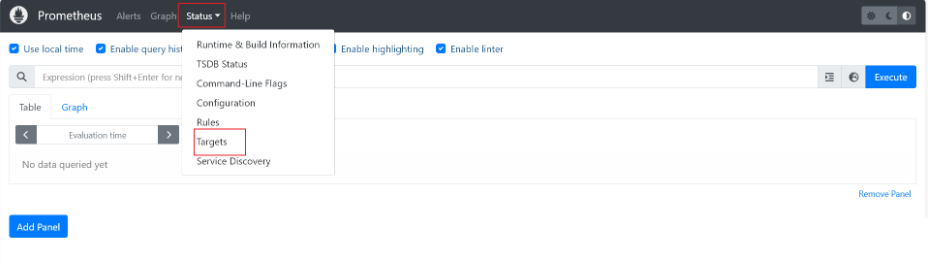
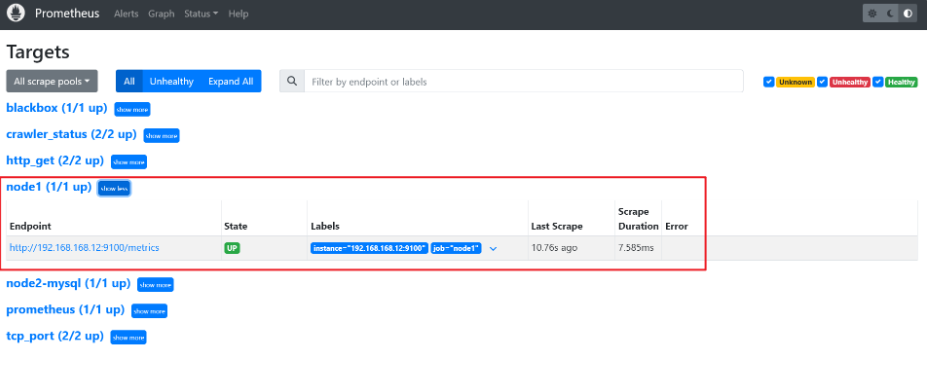
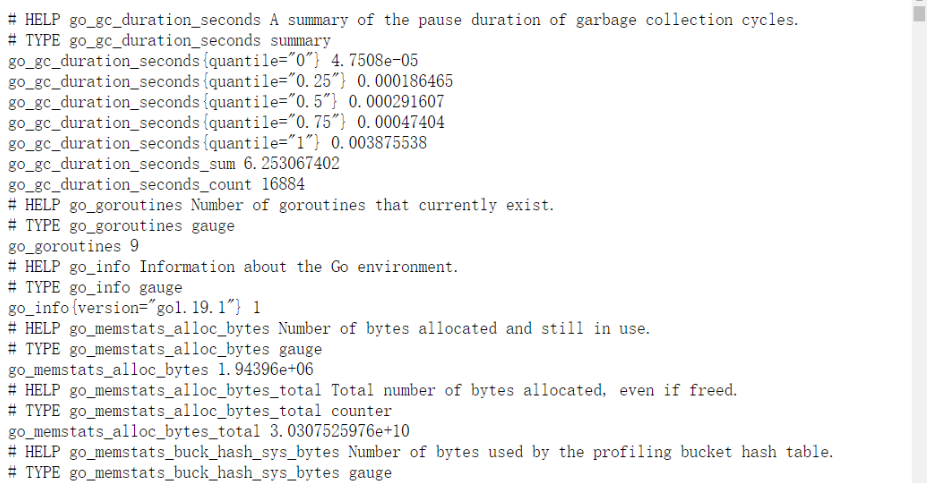
8、查看http metrics 采集指标
http://被监控的计算机 IP:9100/metrics,查看从 exporter 具体能抓到的数据
9、node_exporter 的 PromQL 查询语句
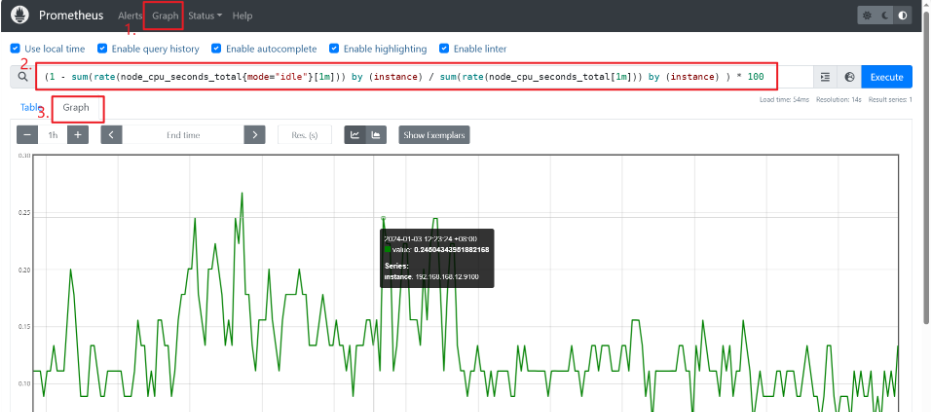
一些 PromQL 如下
获取系统信息
node_uname_info获取系统 uptime 时间
sum(time() - node_boot_time_seconds)by(instance)系统启动时间
node_boot_time_seconds系统当前时间
time()CPU 核数
count(node_cpu_seconds_total{mode='system'}) by (instance)计算 CPU 使用率
(1 - sum(rate(node_cpu_seconds_total{mode="idle"}[1m])) by (instance) / sum(rate(node_cpu_seconds_total[1m])) by (instance) ) * 100计算内存使用率
(1- (node_memory_Buffers_bytes + node_memory_Cached_bytes + node_memory_MemFree_bytes) / node_memory_MemTotal_bytes) * 100查看节点总内存
node_memory_MemTotal_bytes/1024/1024/1024计算磁盘使用率
(1 - node_filesystem_avail_bytes{fstype=~"ext4|xfs"} /
node_filesystem_size_bytes{fstype=~"ext4|xfs"}) * 100
磁盘 IO
磁盘读 IO 使用
sum by (instance) (rate(node_disk_reads_completed_total[5m]))磁盘写 IO 使用
sum by (instance) (rate(node_disk_writes_completed_total[5m]))网络带宽
下行带宽
sum by(instance) (irate(node_network_receive_bytes_total{device!~"bond.*?|lo"}[5m]))上行带宽
sum by(instance) (irate(node_network_transmit_bytes_total{device!~"bond.*?|lo"}[5m]))三、blackbox_exporter 探针
Blackbox Exporter:
Blackbox Exporter 也是 Prometheus 生态系统中的一个组件,专门用于对网络服务进行探测和监控。它可以执行 HTTP、TCP、ICMP 等类型的健康检查,并记录响应时间、状态码等信息。Blackbox Exporter 可以用于监控 Web 服务、数据库、消息队列等各种网络应用,并及时发现并报告它们的健康状态和可用性问题。
部署 blackbox_exporter
1、给被监控的计算机下载 blackbox_exporter
wget https://github.com/prometheus/blackbox_exporter/releases/download/v0.22.0/blackbox_exporter-0.22.0.linux-amd64.tar.gz
tar -zvxf blackbox_exporter-0.22.0.linux-amd64.tar.gz -C /usr/local/
cd /usr/local/
mv blackbox_exporter-0.22.0.linux-amd64  blackbox_exporter
下载慢尝试:
wget https://githubfast.com/prometheus/blackbox_exporter/releases/download/v0.22.0/blackbox_exporter-0.22.0.linux-amd64.tar.gz2、查看 blackbox_exporter 版本信息
cd /usr/local/blackbox_exporter
./blackbox_exporter  --version
3、systemctl 管理 blackbox_exporter
vi /usr/lib/systemd/system/blackbox_exporter.service
[Unit]
Description=blackbox_exporter
After=network.target
[Service]
User=root
Type=simple
ExecStart=/usr/local/blackbox_exporter/blackbox_exporter --config.file=/usr/local/blackbox_exporter/blackbox.yml
ExecReload=/bin/kill -HUP $MAINPID
KillMode=process
Restart=on-failure
[Install]
WantedBy=multi-user.target
4、启动、开机启动 blackbox_exporter
systemctl start blackbox_exporter && systemctl enable blackbox_exporter
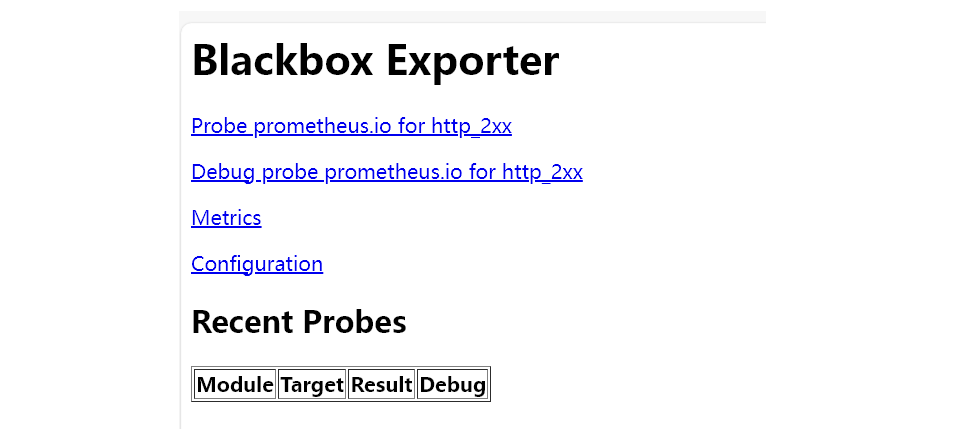
ps -ef | grep blackbox_exporter5、http访问测试(blackbox_exporter 默认监听 9115 端口)
http://被监控的计算机IP:9115
6、blackbox_exporter 配置文件
blackbox_exporter 的配置文件无特殊需求使用默认配置即可
cat /usr/local/blackbox_exporter/blackbox.yml以下在 Prometheus 端操作
在 prometheus.yml 中添加 blackbox_exporter 的配置, 要注意 yml 文件的语法规范
vi /usr/local/prometheus/prometheus.ymlICMP 监控主机存活状态的配置
#icmp ping 监控
  - job_name: crawler_status
    metrics_path: /probe
    params:
      module: [icmp]
    static_configs:
      - targets: ['223.5.5.5','114.114.114.114']
        labels:
          instance: node_status
          group: 'icmp-node'
    relabel_configs:
      - source_labels: [__address__]
        target_label: __param_target
      - source_labels: [__param_target]
        target_label: instance
      - target_label: __address__
        replacement: 安装blackbox_expoter的ip地址:9115
TCP 监控端口的配置
#监控tcp端口
  - job_name: tcp_port
    metrics_path: /probe
    params:
      module: [tcp_connect]
    file_sd_configs:
      - files: ['/usr/local/prometheus/conf.d/tcp_port/*.yml']
        refresh_interval: 10s
    relabel_configs:
      - source_labels: [__address__]
        target_label: __param_target
      - source_labels: [__param_target]
        target_label: instance
      - target_label: __address__
        replacement: 安装blackbox_expoter的ip地址:9115
HTTP GET 监控的配置
# http get  监控
  - job_name: http_get
    metrics_path: /probe
    params:
      module: [http_2xx]
    file_sd_configs:
       - files: ['/usr/local/prometheus/conf.d/http_get/*.yml']
         refresh_interval: 10s
    relabel_configs:
     - source_labels: [__address__]
       target_label: __param_target
     - source_labels: [__param_target]
       target_label: instance
     - target_label: __address__
       replacement: 安装blackbox_expoter的ip地址:9115
上面三段配置都在写 prometheus.yml 里面
编辑 tcp 监控 targets 文件
上一个配置指定了配置文件,在这里新建文件
mkdir -p /usr/local/prometheus/conf.d/tcp_port
vi /usr/local/prometheus/conf.d/tcp_port/tcp_port.yml
写入并改写要监控的 ip 和端口号
- targets: ['192.168.100.126:80','192.168.100.126:22']
  labels:
   group: 'tcp port'
编辑 http_get 监控 targets 文件
mkdir -p /usr/local/prometheus/conf.d/http_get
vi /usr/local/prometheus/conf.d/http_get/http_get.yml
写入要监控的内容
- targets:
  - http://192.168.100.126:80/
  labels:
    name: 'http_get'
重新启动 Prometheus
systemctl restart prometheus四、配置 Prometheus Rule 告警规则
1、创建rule 告警目录
mkdir -p /usr/local/prometheus/rules/2、编辑rule 配置文件
vi /usr/local/prometheus/rules/rules.yml
groups:
- name: http_status_code
rules:
- alert: probe_http_status_code
expr: probe_http_status_code != 200
for: 1m
labels:
severity: critical
annotations:
summary: "{{ $labels.instance }} 状态码异常"
description: "{{ $labels.instance }} 网站访问异常!!! (value: {{ $value }})"
- name: icmp_ping_status
rules:
- alert: icmp_ping_status
expr: probe_icmp_duration_seconds{phase="rtt"} == 0
for: 1m
labels:
severity: critical
annotations:
summary: "主机 {{ $labels.instance }} ICMP异常"
description: "{{ $labels.instance }} ICMP异常!!!(value: {{ $value }})"
value: '{{ $value }}'
##延迟高
- name: link_delay_high
rules:
- alert: link_delay_high
expr: probe_icmp_duration_seconds{phase="rtt"} >0.005
for: 1m
labels:
severity: critical
annotations:
summary: " {{ $labels.instance }} 延迟高!"
description: "{{ $labels.instance }} 延迟高!!!(value: {{ $value }})"
3、检查 rule 文件格式(一定要在/usr/local/prometheus/rules 目录下执行)
cd /usr/local/prometheus/rules
/usr/local/prometheus/promtool  check rules  rules.yml
4、在Prometheus 主机配置文件中引入 rule 告警目录
vi /usr/local/prometheus/prometheus.yml找到 rule_files 那一行,改为
rule_files: ['/usr/local/prometheus/rules/*.yml']5、重新启动 Prometheus
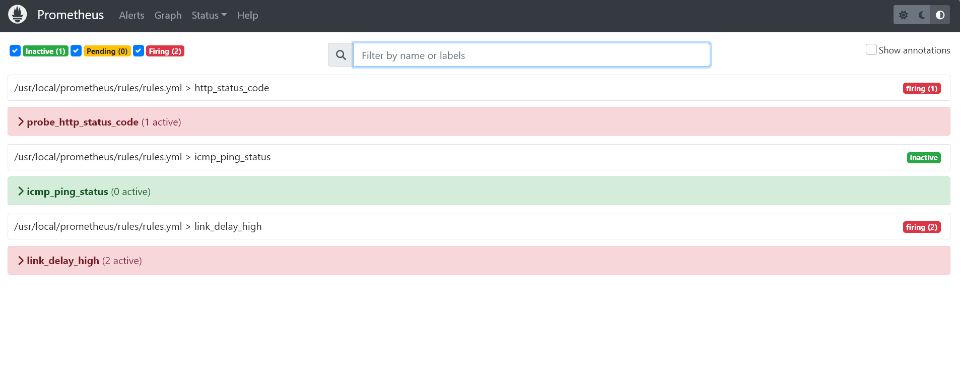
systemctl restart prometheus6、访问Prometheus 前端页面查看 Rules
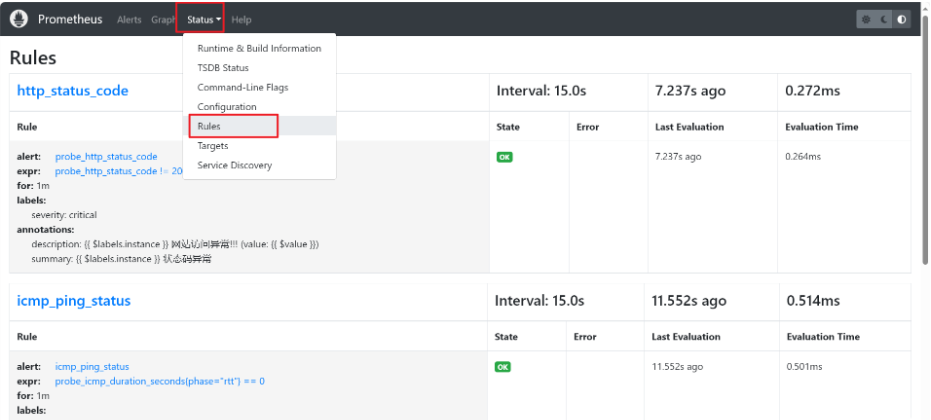
查看 Alerts
五、安装 Grafana
Grafana:
Grafana 是一款开源的数据可视化和监控平台,可以与 Prometheus 等多种数据源集成。它提供了丰富的图表、仪表盘和警报功能,使用户能够直观地展示和分析监控数据。Grafana 支持灵活的查询语言和可定制的仪表盘布局,可以满足各种不同场景下的监控需求,并为用户提供实时的数据可视化和分析能力。
wget https://dl.grafana.com/enterprise/release/grafana-enterprise-9.2.2-1.x86_64.rpm
yum install grafana-enterprise-9.2.2-1.x86_64.rpm
1、启动Grafana 服务
systemctl enable grafana-server
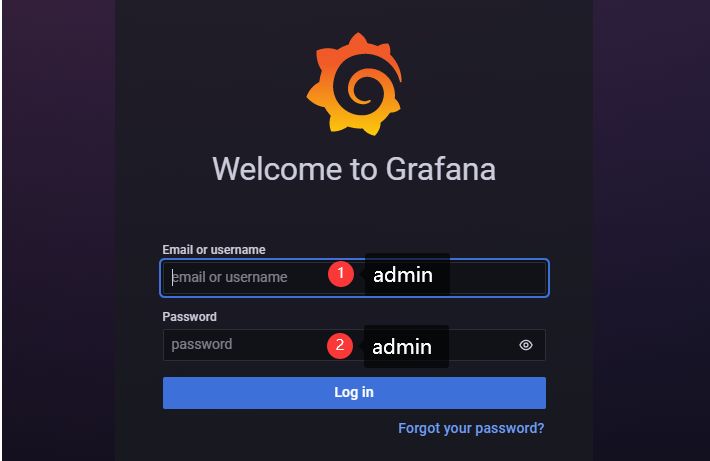
systemctl start grafana-server访问地址 访问地址:http://Prometheus:3000
默认的账号密码是 admin/admin
第一次登录后会要求更改密码
2、配置 Prometheus
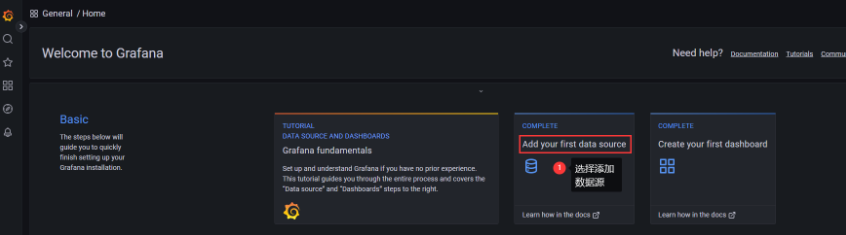
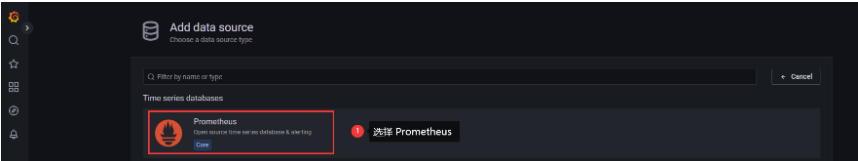
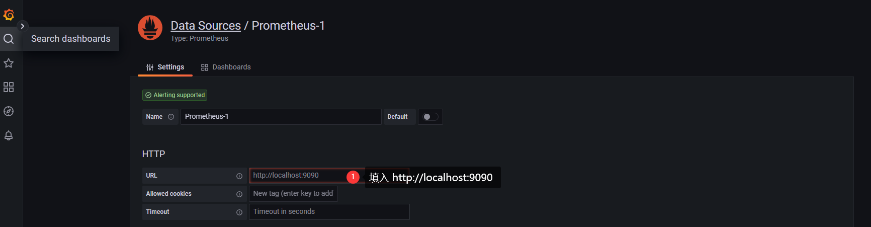
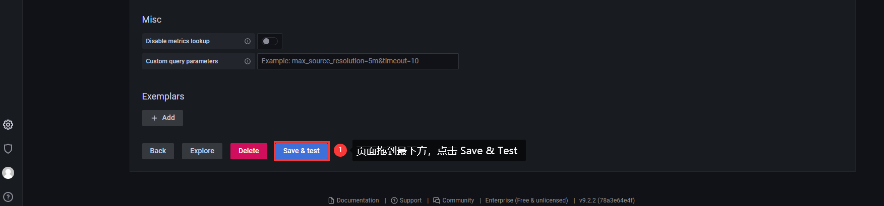
进入 Grafana 后,添加数据源:
3、配置显示模板
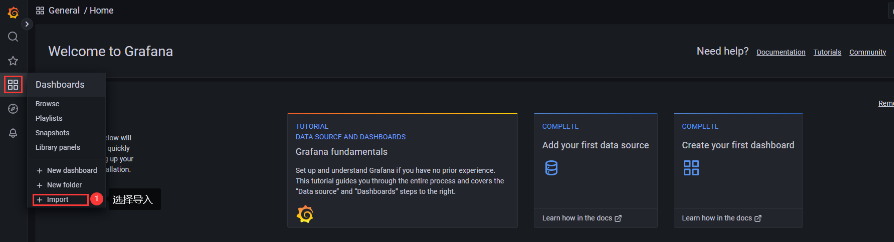
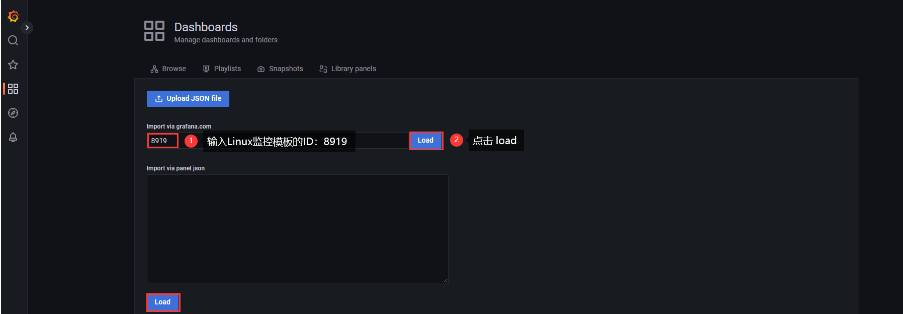
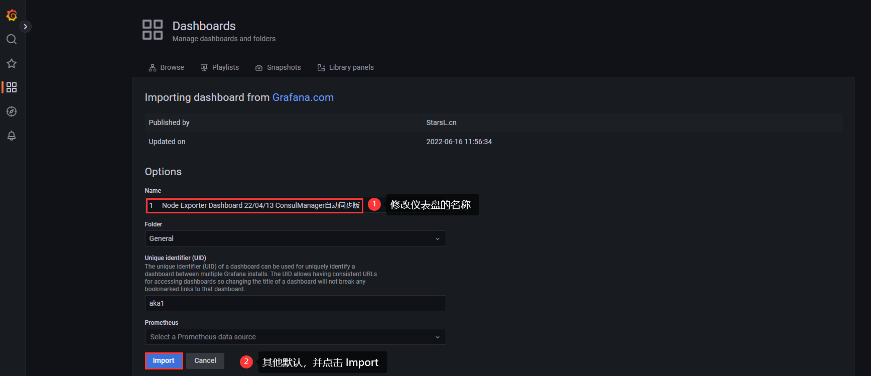
最终就能看到配置后的结果
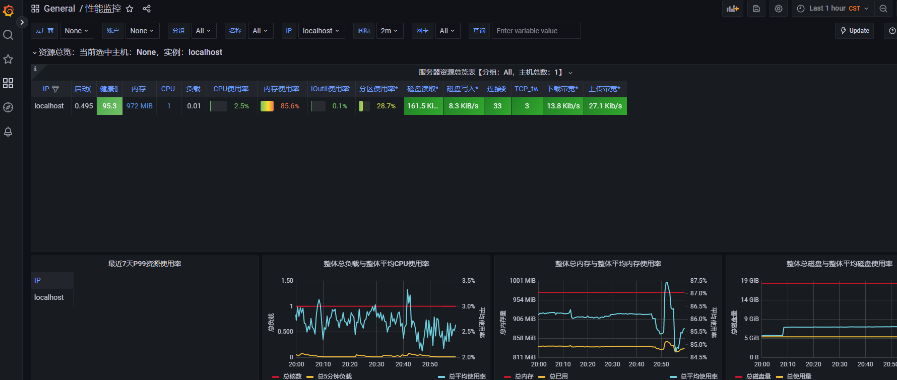
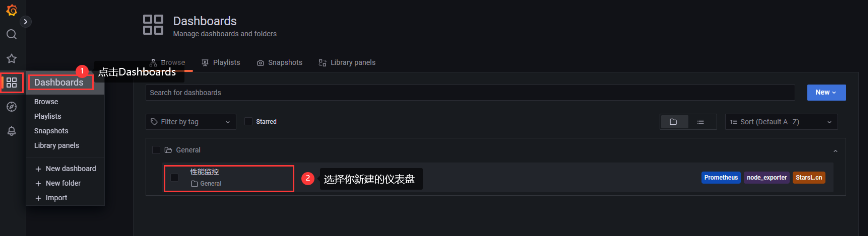
后续进入的话,可以从菜单>Dashboards 进入


 2571
2571

 被折叠的 条评论
为什么被折叠?
被折叠的 条评论
为什么被折叠?
 到【灌水乐园】发言


