


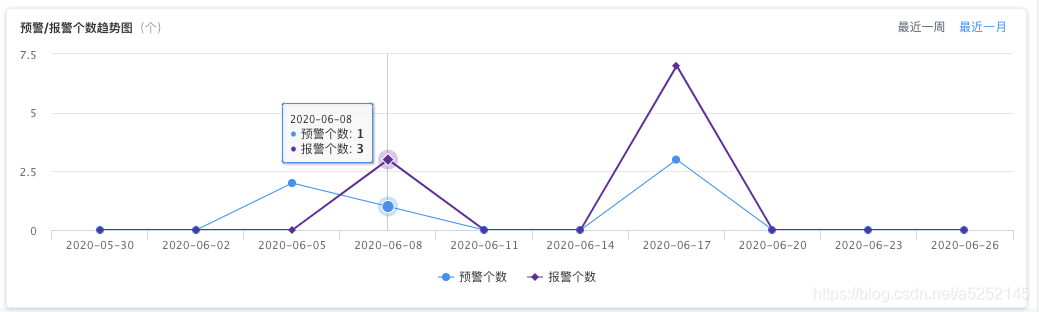
Vue项目中使用highcharts-折线图(配置)
效果图:
- 封装lineChart组件
<template>
    <div class="chart">
        <div :id="id" class="chart-common" :data="data"></div>
    </div>
</template>

<script>
    import HighCharts from 'highcharts'
    export default {
        name: "chart",
        // 传入id: 若一个页面出现多个折线图时,id必须不同
        // data: 折线图配置数据
        props: ['id','data'],
        data() {
            return {
            }
        },
        created() {
        },
        mounted() {
            HighCharts.chart(this.id, this.data);
        }
    }
</script>

<style scoped lang="less">
    .chart {
        width: 100%;
        margin-top: 10px;
        .chart-common {
            height: 300px;
            border: 1px solid #e8eaec;
            padding: 3px;
            border-radius: 4px;
            transition: all 0.2s ease-in-out;
            &:hover {
                box-shadow: 0 1px 6px rgba(0, 0, 0, 0.2);
                border-color: #eee;
            }
        }
    }
</style>
- vue页面文件中引用lineChart
// 1
import lineChart from './common/lineChart';
import { diskReadWriteNum } from "./access/chartsData";   // 折线图静态配置文件,放在一chartData.js中,防止代码冗余
// 2
components: {
    lineChart
}
// 3
<lineChart :id="chartId" :data="alarmtresChartData"></lineChart>
chartId: 'char-id',
alarmtresChartData:  Object.assign(diskReadWriteNum)  // 深拷贝一份
// 4 数据请求成功 只需要关注a、b、c即可
this.$request(config).then(({data: res}) => {
    if (res.success) {

        let dateList = [];  // x轴数据
        let alarmNumList = [];  // 报警Y轴
        let earlyNumList = [];  // 预警Y轴

        if(type === 'alarm') {
            // 报警
            res.data.forEach(item => {
                let date = this.timestampToTimeLong(item.timestamp);
                dateList.push(date);
                alarmNumList.push(item.count);
            })
            // a
            this.alarmtresChartData.series[0].data = alarmNumList;
        } else {
            // 预警
            res.data.forEach(item => {
                let date = this.timestampToTimeLong(item.timestamp);
                dateList.push(date);
                earlyNumList.push(item.count);
            })
            // b
            this.alarmtresChartData.series[1].data = earlyNumList;
        }
        // c
        this.alarmtresChartData.xAxis.categories = dateList;
        // d 重新刷新div
        this.isReloadChart = false;  // 这里见我另一篇文章,vue强制刷新某一个div
        this.$nextTick(() => {
            this.isReloadChart = true;
        })
    }
});
- lineChart配置文件chartsData.js
const diskReadWriteNum = {
    credits: {
        enabled: false // 禁用版权信息
    },
    // 标题
    title: {
        useHTML: true,
        text: '<div style="font-weight: 700">' + window.i18nTool.$t('预警/报警个数趋势图')
            + '<span style="color: #999999">(' + window.i18nTool.$t('个') + ')</span></div>',
        align: 'left',
        // 水平对齐方式
        style: {
            fontSize: '12px',
            'font-weight': 700
        }
    },
    // 副标题
    subtitle: {
        text: ''
    },
    // X轴
    xAxis: {
        title: {
            text: ''
        },
        // 数据项
        categories: ['12:00:00', '13:10:00', '14:20:00', '15:30:00', '16:40:00', '17:50:00', '18:60:00', '19:70:00']
        // time = Date.UTC(2013,11,14,0,0,0,0);  // UTC格式时间戳
    },
    // Y轴
    yAxis: {
        title: {
            text: ''
        }
    },
    // 数据列
    series: [{
        name: window.i18nTool.$t('预警个数'),
        color: '#2d8cf0',
        data: [12, 34, 23, 35, 47, 32, 12, 19],
        lineWidth: 1, // 线宽
        cursor: 'pointer', // 鼠标样式
        dashStyle: 'Solid' // 线条样式
    }, {
        name: window.i18nTool.$t('报警个数'),
        color: '#5f299a',
        data: [8, 12, 69, 60, 17, 22, 59, 36],
        lineWidth: 1, // 线宽
        cursor: 'pointer', // 鼠标样式
        dashStyle: 'Solid', // 线条样式
        type: 'spline'   // 线条平滑
    }],
    // 数据列配置 每条折现以不同图标显示(三角形、圆形等) 折现数据上的数据点
    plotOptions: {
        series: {
            marker: {
                radius: 1, // 大小
                enabled: true,  // 为true时,自定义显示 下方label无效
                states: {
                    // 状态
                    hover: {
                        radius: 2,
                        lineWidthPlus: 1
                    }
                }
            },
            // 使用label需去除marke属性
            // label: {
            //     connectorAllowed: true
            // }
            // pointStart: 2010  // 如果没有为数据列中提供x值,则pointStart定义要开始的值。
        }
    },
    // 图例(折线数据名字)
    legend: {
        itemStyle: {
            fontWeight: 400
        }
    },
    tooltip: {
        shared: true,   // 鼠标滑过是否显示全部数据
        crosshairs: false,  // true:鼠标滑过,为长方形背景
        // axisPointer: {
        //     type: 'cross'
        // },
        // 配置鼠标划过时标示线
        crosshairs: [
            // 横向标示线
            {
                width: 1,
                color: '#ccc'
            },
            // 纵向标示线
            // {
            //     width: 1,
            //     color: 'green'
            // }
        ],
        // 时间格式化字符 默认会根据当前的数据点间隔取对应的值 当前图表中数据点间隔为 1天,所以配置 day 值即可
        // dateTimeLabelFormats: {
        //     day: '%Y-%m-%d'
        // }
    },
    // 响应式
    // responsive: {
    //     rules: [{
    //         // 响应条件
    //         condition: {
    //         },
    //         // 图表配置
    //         chartOptions: {
    //         }
    //     }]
    // }

};

module.exports = {
    diskReadWriteNum
};


 1433
1433


 被折叠的 条评论
为什么被折叠?
被折叠的 条评论
为什么被折叠?
 到【灌水乐园】发言


