


第1章 安装准备
由于Elasticsearch、Logstash、Kibana均不能以root账号运行。
但是Linux对非root账号可并发操作的文件、线程都有限制。
所以,部署ELK相关的机器都要调整:
1.1 安装jdk


 1 yum install java-1.8.0-openjdk  java-1.8.0-openjdk-devel  -y
 2 [root@elk3 tools]# echo "export JAVA_HOME=/usr/lib/jvm/java-1.8.0-openjdk-1.8.0.51.x86_64 \
 3
 4 > export CLASSPATH=.:$JAVA_HOME/jre/lib/rt.jar:$JAVA_HOME/lib/dt.jar:$JAVA_HOME/lib/tools.jar\
 5
 6 > export PATH=$PATH:$JAVA_HOME/bin" >> /etc/profile
 7 [root@elk2 ~]# source  /etc/profile
 8
 9 [root@elk3 tools]# java -version
10
11 openjdk version "1.8.0_161"
12
13 OpenJDK Runtime Environment (build 1.8.0_161-b14)
14
15 OpenJDK 64-Bit Server VM (build 25.161-b14, mixed mode)
1.2 修改文件限制
 1 # 修改系统文件
 2
 3 vim /etc/security/limits.conf
 4
 5 #增加的内容
 6
 7 * soft nofile 65536
 8
 9 * hard nofile 65536
10
11 * soft nproc 2048
12
13 * hard nproc 4096
1.3 调整进程数
#修改系统文件

vim /etc/security/limits.d/20-nproc.conf

#调整成以下配置

*          soft    nproc     4096

root       soft    nproc     unlimited
1.4 调整虚拟内存&最大并发连接
#修改系统文件

vim /etc/sysctl.conf

#增加的内容

vm.max_map_count=655360

fs.file-max=655360
1.5 创建普通用户
groupadd elsearch

useradd elsearch -g elsearch -p 123456

chown -R elsearch.elsearch /server/tools/elasticsearch-6.2.3
1.6 创建日志和数据目录
mkdir -p /var/data/elasticsearch && chown -R elsearch.elsearch /var/data/elasticsearch
mkdir -p /var/log/elasticsearch && chown -R elsearch.elsearch /var/log/elasticsearch
第2章 部署ELK
Elasticsearch是一个高度可扩展的开源全文搜索和分析引擎。它允许您快速,近实时地存储,搜索和分析大量数据。它通常用作支持具有复杂搜索功能和需求的应用程序的底层引擎/技术。
2.1 安装elasticsearch
2.1.1 配置elasticsearch配置文件
 1 cat >/server/tools/elasticsearch-6.2.3/config/elasticsearch.yml <<END
 2
 3 cluster.name: ES
 4
 5 node.name: ES0
 6
 7 path.data: /var/data/elasticsearch
 8
 9 path.logs: /var/log/elasticsearch
10
11 network.host: 10.0.0.19
12
13 http.port: 9200
14
15 transport.tcp.port: 9300
16
17 discovery.zen.ping.unicast.hosts: ["10.0.0.19:9300", "10.0.0.21:9300","10.0.0.22:9300"]
18
19 discovery.zen.minimum_master_nodes: 2
20
21 END
22
23 cat >/server/tools/elasticsearch-6.2.3/config/elasticsearch.yml <<END
24
25 cluster.name: ES
26
27 node.name: ES1
28
29 path.data: /var/data/elasticsearch
30
31 path.logs: /var/log/elasticsearch
32
33 network.host: 10.0.0.21
34
35 http.port: 9200
36
37 transport.tcp.port: 9300
38
39 discovery.zen.ping.unicast.hosts: ["10.0.0.19:9300", "10.0.0.21:9300","10.0.0.22:9300"]
40
41 discovery.zen.minimum_master_nodes: 2
42
43 END
44
45
46
47 cat >/server/tools/elasticsearch-6.2.3/config/elasticsearch.yml <<END
48
49 cluster.name: ES
50
51 node.name: ES2
52
53 path.data: /var/data/elasticsearch
54
55 path.logs: /var/log/elasticsearch
56
57 network.host: 10.0.0.22
58
59 http.port: 9200
60
61 transport.tcp.port: 9300
62
63 discovery.zen.ping.unicast.hosts: ["10.0.0.19:9300", "10.0.0.21:9300","10.0.0.22:9300"]
64
65 discovery.zen.minimum_master_nodes: 2
66
67 END
2.1.2 启动
elsearch@elk1 elasticsearch-6.2.3]$ ./bin/elasticsearch
2.2 安装配置Logstash
2.2.1 安装准备
 1 [root@elk3 ~]# mkdir -p /server/tools
 2
 3 [root@elk3 ~]# cd /server/tools/
 4
 5 [root@elk3 tools]# tar xf  kibana-6.2.3-linux-x86_64.tar.gz
 6
 7 [root@elk3 tools]# tar xf  logstash-6.2.3.tar.gz
 8
 9 groupadd elsearch
10
11 useradd elsearch -g elsearch -p 123456
12
13 chown -R elsearch.elsearch /server/tools/
2.2.2 配置Logstash
数据&日志目录
#创建Logstash数据目录
#创建Logstash日志目录
mkdir -p /var/data/logstash &&  chown -R elsearch.elsearch /var/data/logstash

mkdir -p /var/logs/logstash &&   chown -R elsearch.elsearch /var/logs/logstash
配置数据&日志目录
#打开目录
cd /server/tools/logstash-6.2.3/
#修改配置
vim config/logstash.yml
#增加以下内容

path.data: /var/data/logstash

path.logs: /var/logs/logstash
2.2.3 启动logstash
切换普通用户
[root@elk3 config]# su - elsearch

#进入Logstash根目录

[elsearch@elk3 ~]$ cd /server/tools/logstash-6.2.3/

#启动

/bin/logstash -f config/system.conf

启动成功后,在启动输出的最后一行会看到如下信息:

[2018-04-03T10:54:35,819][INFO ][logstash.pipeline        ] Pipeline started succesfully {:pipeline_id=>"main", :thread=>"#<Thread:0x15a6d6d9 run>"}

[2018-04-03T10:54:36,086][INFO ][logstash.agent           ] Pipelines running {:count=>1, :pipelines=>["main"]}
2.3 Kibana 配置
2.3.1 安装准备
[root@elk3 tools]# tar xf kibana-6.2.3-linux-x86_64

chown elsearch:elsearch /server/tools/kibana-6.2.3-linux-x86_64
2.3.2 修改配置
#进入kibana根目录

cd /server/tools/kibana-6.2.3-linux-x86_64

#修改配置

vi config/kibana.yml

#修改以下内容

[root@elk3 kibana-6.2.3-linux-x86_64]# egrep -v "^#|^$" config/kibana.yml

server.port: 5601

server.host: "10.0.0.24"

elasticsearch.url: "http://10.0.0.21:9200"

[root@elk3 kibana-6.2.3-linux-x86_64]#
2.3.3 启动
切换普通用户启动
[root@elk3 kibana-6.2.3-linux-x86_64]# su - elsearch
[elsearch@elk3 ~]$ cd /server/tools/kibana-6.2.3-linux-x86_64/
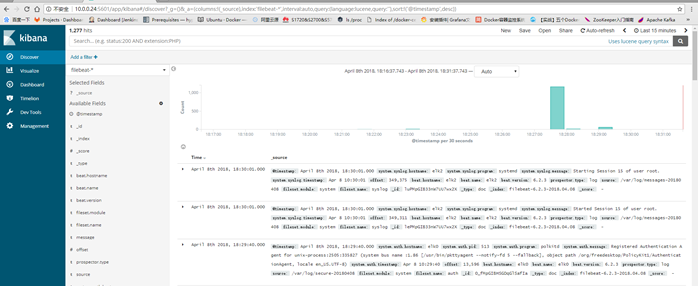
[elsearch@elk3 kibana-6.2.3-linux-x86_64]$ bin/kibana2.3.4 浏览器访问
http://10.0.0.24:5601

第3章 Filebeat配置
系统Filebeat模块收集并分析由基于Unix / Linux的常见发行版的系统日志记录服务创建的日志。
3.1 安装
curl -L -O https://artifacts.elastic.co/downloads/beats/filebeat/filebeat-6.2.3-x86_64.rpm

rpm -vi filebeat-6.2.3-x86_64.rpm

安装插件

bin/elasticsearch-plugin install ingest-geoip

bin/elasticsearch-plugin install ingest-user-agent
3.2 修改/etc/filebeat/filebeat.yml以设置连接信息
output.elasticsearch:

  hosts: ["<es_url>"]

  username: "elastic"

  password: "<password>"

setup.kibana:

  host: "<kibana_url>"
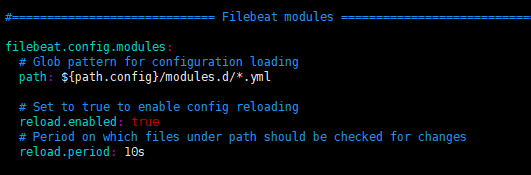
3.3 启用并配置系统模块
filebeat modules enable system

修改/etc/filebeat/modules.d/system.yml文件中的设置。
3.4 启动Filebeat
filebeat setup

systemctl restart filebeat.service
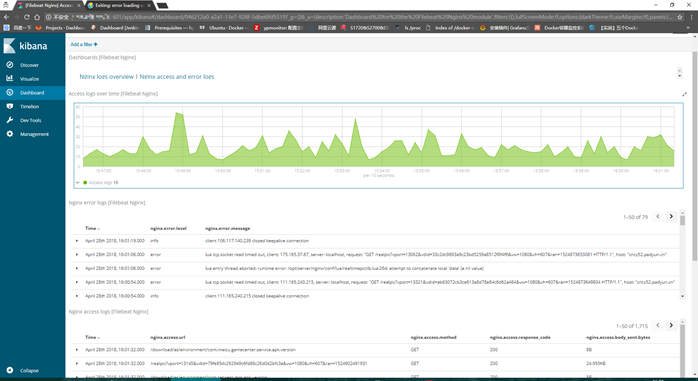
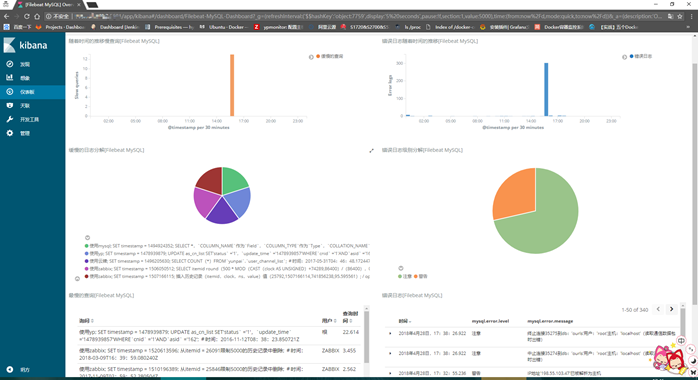
3.5 配置nginx和mysql日志查询
 1 #vim /etc/filebeat/modules.d/mysql.yml
 2
 3 - module: mysql
 4
 5   # Error logs
 6
 7   error:
 8
 9     enabled: true
10
11
12
13     # Set custom paths for the log files. If left empty,
14
15     # Filebeat will choose the paths depending on your OS.
16
17     var.paths: ["/data/mysql/czypweb.err*"]
18
19
20
21   # Slow logs
22
23   slowlog:
24
25     enabled: true
26
27
28
29     # Set custom paths for the log files. If left empty,
30
31     # Filebeat will choose the paths depending on your OS.
32
33 var.paths: ["/data/mysql/mysql-slow.log*"]
34
35 #vim /etc/filebeat/modules.d/nginx.yml
36
37
38
39 - module: nginx
40
41   # Access logs
42
43   access:
44
45     enabled: true
46
47
48
49     # Set custom paths for the log files. If left empty,
50
51     # Filebeat will choose the paths depending on your OS.
52
53     var.paths: ["/usr/local/openresty/nginx/logs/access.log*"]
54
55
56
57   # Error logs
58
59   error:
60
61     enabled: true
62
63
64
65     # Set custom paths for the log files. If left empty,
66
67     # Filebeat will choose the paths depending on your OS.
68
69     var.paths: ["/usr/local/openresty/nginx/logs/error.log*"]
70
71 修改filebeat配置文件开启模块功能
展示效果
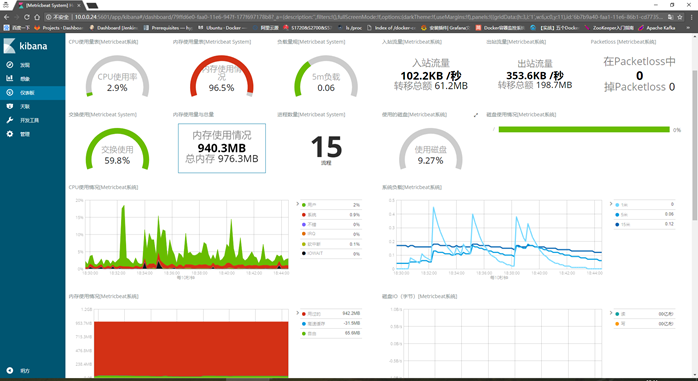
第4章 System metrics
系统Metricbeat模块从主机收集CPU,内存,网络和磁盘统计信息。它收集系统范围的统计信息以及每个进程和每个文件系统的统计信息。
4.1 下载
curl -L -O https://artifacts.elastic.co/downloads/beats/metricbeat/metricbeat-6.2.3-x86_64.rpm

sudo rpm -vi metricbeat-6.2.3-x86_64.rpm
4.2 配置
/etc/metricbeat/metricbeat.yml

metricbeat.config.modules:

  path: ${path.config}/modules.d/*.yml

  reload.enabled: true

  reload.period: 10s

output.elasticsearch:

  hosts: ["<es_url>"]

  username: "elastic"

  password: "<password>"

setup.kibana:

  host: "<kibana_url>"
4.3 启用并配置系统模块
metricbeat modules enable system
4.4 启动Metricbeat
metricbeat setup
service metricbeat start
systemctl enable metricbeat.service开机自启


 741
741


 被折叠的 条评论
为什么被折叠?
被折叠的 条评论
为什么被折叠?
 到【灌水乐园】发言


