


检查服务器环境
系统版本
>=Centos 7.0
BE节点 确认 CPU 是否支持 AVX2 指令集
cat /proc/cpuinfo |grep avx2 下载
Download StarRocks Free | StarRocks
Download Grafana | Grafana Labs
StarRocks安装(单节点为例)
FE
]$ tar -zxf StarRocks-2.5.6.tar.gz -C /opt/module/配置FE节点
进入 StarRocks-x.x.x/fe 路径,修改FE配置文件conf/fe.conf
添加元数据目录配置项。
meta_dir = ${STARROCKS_HOME}/meta
添加 Java 目录配置项。
JAVA_HOME = ${JAVA_HOME}
在StarRocks-x.x.x/fe目录下面,创建元数据路径
mkdir -p meta启动 FE 节点
./bin/start_fe.sh --daemon

./bin/stop_fe.sh --daemon
通过查看日志log/fe.log和JPS命令查询java进程确认是否启动成功。
启动成功则可以在浏览器访问WEB UI ip:http_port(默认 http_port 为 8030),用户名为 root,密码为空。
添加FE节点
可通过 MySQL 客户端连接 StarRocks 以添加 FE 节点。
在 FE 进程启动后,使用 MySQL 客户端连接 FE 实例。
mysql -h 127.0.0.1 -P9030 -uroot说明 root 为 StarRocks 默认内置 user,密码为空,端口为 fe/conf/fe.conf 中的 query_port 配置项,默认值为 9030。
查看 FE 状态。
SHOW PROC '/frontends'\GBE
配置BE节点
进入StarRocks-x.x.x/be目录,创建 BE 节点中的数据路径 storage。
mkdir -p storage添加BE节点
通过 MySQL 客户端将 BE 节点添加至 StarRocks 集群。
//添加节点
ALTER SYSTEM ADD BACKEND "host:port";
//host 需要与 priority_networks 相匹配,port 需要与 be.conf 文件中的设置的 heartbeat_service_port 相同,默认为 9050。
//删除节点
ALTER SYSTEM decommission BACKEND "host:port";
启动BE节点
./bin/start_be.sh --daemon

./bin/stop_be.sh --daemon
确认BE启动是否成功,在通过mysql客户端执行命令
SHOW PROC '/backends'\G修改用户登录密码
SET PASSWORD [FOR user_identity] = [PASSWORD('plain password')]|['hashed password'];
SET PASSWORD命令可以修改一个用户的登录密码。如果[FOR user_identity]字段不存在,那么修改当前用户的密码。
SET PASSWORD FOR root = PASSWORD('123456');
Prometheus部署
]$ tar -zxf prometheus-2.37.8.linux-amd64.tar.gz -C /opt/module/
]$ mv prometheus-2.37.8.linux-amd64 prometheus
]$ cd /opt/module/prometheus
]$ vim prometheus.yml
# my global config
global:
scrape_interval: 15s # global acquisition interval, 1m by default, here set to 15s
evaluation_interval: 15s # global rule trigger interval, 1m by default, here set to 15s
scrape_configs:
# The job name is added as a label `job=<job_name>` to any timeseries scraped from this config.
- job_name: 'StarRocks_Cluster01' # Each cluster is called a job, job name is customizable
metrics_path: '/metrics' # Specify the Restful API to get metrics
static_configs:
- targets: ['fe_host1:http_port','fe_host3:http_port','fe_host3:http_port']
labels:
group: fe # Here the group of FE is configured which contains 3 Frontends
- targets: ['be_host1:http_port', 'be_host2:http_port', 'be_host3:http_port']
labels:
group: be # The group of BE is configured here which contains three Backends
- job_name: 'StarRocks_Cluster02' # Multiple StarRocks clusters can be monitored in Prometheus
metrics_path: '/metrics'
static_configs:
- targets: ['fe_host1:http_port','fe_host3:http_port','fe_host3:http_port']
labels:
group: fe
- targets: ['be_host1:http_port', 'be_host2:http_port', 'be_host3:http_port']
labels:
group: be
-----------------------------单机版实例----------------------------------
# Here it's Prometheus itself.
scrape_configs:
- job_name: 'StarRocks01'
metrics_path: '/metrics'
static_configs:
- targets: ['ft-bigdata-01:8030']
labels:
group: fe
- targets: ['ft-bigdata-01:8040']
labels:
group: be
启动Prometheus
nohup ./prometheus --log.level="info" >> nohup.out 2>&1 &访问Prometheus
Prometheus可以通过web页面进行简单的访问。通过浏览器打开9090端口,即可访问Prometheus的页面。例如, 192.168.110.23:9090 。
点击导航栏中, Status-->Targets ,可以看到配置文件prometheus.yml中所有分组Job的监控主机节点。正常情况下,所有节点都应为UP,表示数据采集正常:
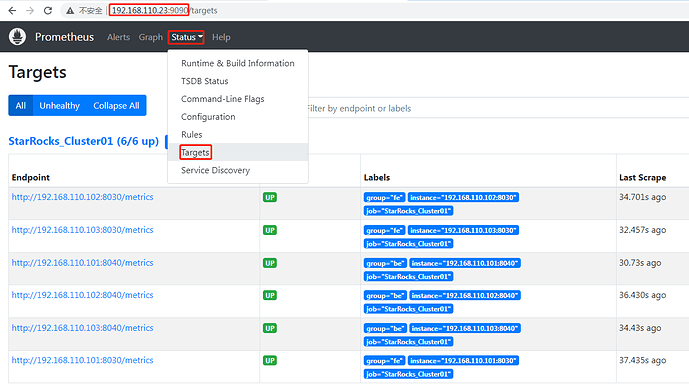
至此,Prometheus就配置完成了。
Grafana部署
]$ tar -zxf grafana-9.5.2.linux-amd64.tar.gz -C /opt/module/

]$ cd /opt/module/启动Grafana
nohup ./bin/grafana-server >> nohup.out 2>&1 &访问Grafana
使用浏览器访问 192.168.110.23:3000 ,即可看到grafana页面,默认用户名密码都是admin
数据源配置
配置路径为: Configuration-->Data sources-->Add data source-->Prometheus
配置DashBoard
1)下载模板
StarRocks提供了Grafana DashBoard模版,下载地址为:http://starrocks-thirdparty.oss-cn-zhangjiakou.aliyuncs.com/StarRocks-Overview-19.json 55
浏览器打开下载地址,右键,另存为,在桌面保存即可。这里注意,我们需要将json文件下载到 “浏览器所在的机器上” ,因为json文件是需要通过浏览器上传的,所以这里不是下载到Linux服务器上,而是需要下载到咱们打开Web所用的机器上。
备注:2.4版本调整了metric信息,所以需要修改Json中的两处starrocks_be_memory_allocated_bytes为starrocks_be_process_mem_bytes。
2) 导入模板
Import dashboard --> Upload dashboard JSON file --> StarRocks选择数据源(选择之前创建的)
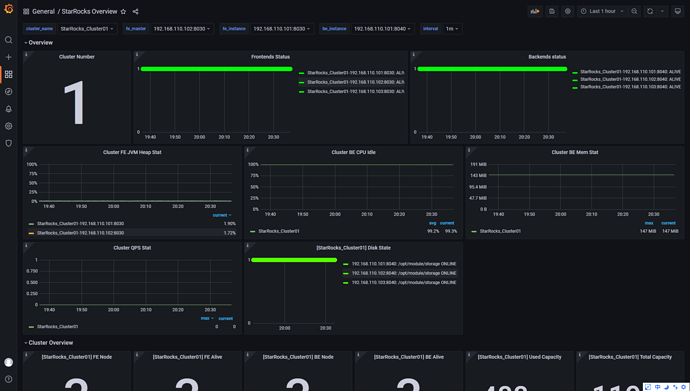
后续访问Grafana查看监控状况
在浏览器中访问 192.168.110.23:3000 ,输入用户名密码后,点击搜索按钮(Search dashboards),选择StarRocks Overview即可。
参考文档
- 官网文档 Monitor and Alerting @ Monitor_and_Alert @ StarRocks Docs
- Prometheus+Grafana部署及监控模板配置 Prometheus+Grafana部署及监控模板配置 - 🙌 StarRocks 技术分享 - StarRocks中文社区论坛
- StarRocks用户、角色与权限 第5.2章:StarRocks用户、角色与权限_流木随风的博客-CSDN博客


 956
956


 被折叠的 条评论
为什么被折叠?
被折叠的 条评论
为什么被折叠?
 到【灌水乐园】发言


