源码下载:
http://download.csdn.net/download/adam_zs/10182484
'''
信用卡欺诈检测
样本数据极度不均衡:
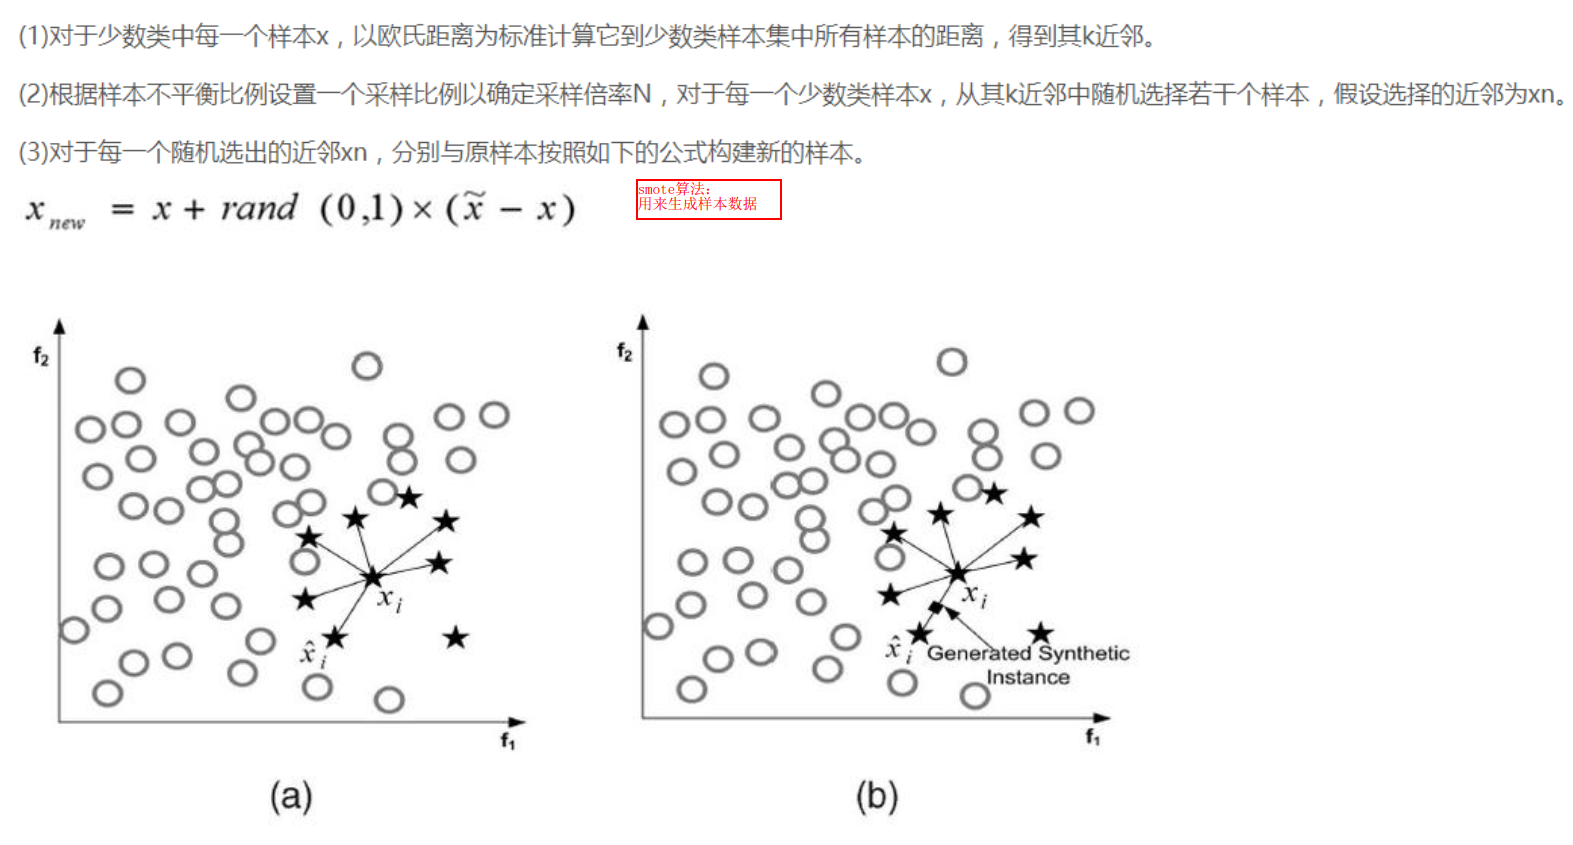
1.过采样 让两个样本的数量同样多
2.下采样 让两个样本的数量同样少
'''
import numpy as np
import pandas as pd
import matplotlib.pyplot as plt
pd.set_option('display.height', 1000)
pd.set_option('display.max_rows', 1000)
pd.set_option('display.max_columns', 1000)
pd.set_option('display.width', 1000)
data = pd.read_csv("creditcard.csv")
# print(data.head())
'''
Time交易持续时间
V1-V28 特征属性
Amount 交易金额
Class 0正常 1异常
Time V1 V2 V3 V4 V5 V6 V7 V8 V9 V10 V11 V12 V13 V14 V15 V16 V17 V18 V19 V20 V21 V22 V23 V24 V25 V26 V27 V28 Amount Class
0 0.0 -1.359807 -0.072781 2.536347 1.378155 -0.338321 0.462388 0.239599 0.098698 0.363787 0.090794 -0.551600 -0.617801 -0.991390 -0.311169 1.468177 -0.470401 0.207971 0.025791 0.403993 0.251412 -0.018307 0.277838 -0.110474 0.066928 0.128539 -0.189115 0.133558 -0.021053 149.62 0
1 0.0 1.191857 0.266151 0.166480 0.448154 0.060018 -0.082361 -0.078803 0.085102 -0.255425 -0.166974 1.612727 1.065235 0.489095 -0.143772 0.635558 0.463917 -0.114805 -0.183361 -0.145783 -0.069083 -0.225775 -0.638672 0.101288 -0.339846 0.167170 0.125895 -0.008983 0.014724 2.69 0
2 1.0 -1.358354 -1.340163 1.773209 0.379780 -0.503198 1.800499 0.791461 0.247676 -1.514654 0.207643 0.624501 0.066084 0.717293 -0.165946 2.345865 -2.890083 1.109969 -0.121359 -2.261857 0.524980 0.247998 0.771679 0.909412 -0.689281 -0.327642 -0.139097 -0.055353 -0.059752 378.66 0
3 1.0 -0.966272 -0.185226 1.792993 -0.863291 -0.010309 1.247203 0.237609 0.377436 -1.387024 -0.054952 -0.226487 0.178228 0.507757 -0.287924 -0.631418 -1.059647 -0.684093 1.965775 -1.232622 -0.208038 -0.108300 0.005274 -0.190321 -1.175575 0.647376 -0.221929 0.062723 0.061458 123.50 0
4 2.0 -1.158233 0.877737 1.548718 0.403034 -0.407193 0.095921 0.592941 -0.270533 0.817739 0.753074 -0.822843 0.538196 1.345852 -1.119670 0.175121 -0.451449 -0.237033 -0.038195 0.803487 0.408542 -0.009431 0.798278 -0.137458 0.141267 -0.206010 0.502292 0.219422 0.215153 69.99 0
'''
# help(pd.value_counts)
count_classes = pd.value_counts(data["Class"]) # 默认按照值排序
# print(count_classes)
'''
0 284315
1 492
'''
count_classes.plot(kind='bar')
plt.title("Fraud class histogram")
plt.xlabel("Class")
plt.ylabel("Frequency")
# plt.show()
from sklearn.preprocessing import StandardScaler
# print(type(data['Amount'])) # pandas.core.series.Series
# print(type(data['Amount'].reshape(-1, 1))) # numpy.ndarray
# fit_transform转换为一个合适的数据
data['normAmount'] = StandardScaler().fit_transform(data['Amount'].reshape(-1, 1)) # -1表示行数程序推断,1表示列数
# print(help(data.drop))
data.drop(['Time', 'Amount'], axis=1)
# print(data.head())
X = data.ix[:, data.columns != 'Class']
y = data.ix[:, data.columns == 'Class']
'''下采样'''
# Number of data points in the minority class
fraud_indices = np.array(data[data['Class'] == 1].index) # 异常样本索引
normal_indices = np.array(data[data['Class'] == 0].index) # 正常样本索引
# choice(选择源,选择数量,replace:true采样结果有重复,false采样结果没有重复)
random_normal_indices = np.random.choice(normal_indices, len(fraud_indices), replace=False)
# 把两个样本合并
under_sample_indices = np.concatenate([fraud_indices, random_normal_indices])
# 下采样之后的数据 iloc根据索引位置取值
under_sample_data = data.iloc[under_sample_indices, :]
X_undersample = under_sample_data.ix[:, under_sample_data.columns != 'Class']
y_undersample = under_sample_data.ix[:, under_sample_data.columns == 'Class']
# print("Percentage of normal transactions: ",
# len(under_sample_data[under_sample_data.Class == 0]) / len(under_sample_data))
# print("Percentage of fraud transactions: ",
# len(under_sample_data[under_sample_data.Class == 1]) / len(under_sample_data))
# print("Total number of transactions in resampled data: ", len(under_sample_data))
from sklearn.cross_validation import train_test_split
# cross_validation 交叉验证模块
# test_size:测试集占30%,random_state=0 每次随机切分的结果一样
# 原始全部的数据集
X_train, X_test, y_train, y_test = train_test_split(X, y, test_size=0.3, random_state=0)
print("Number transactions train dataset: ", len(X_train))
print("Number transactions test dataset: ", len(X_test))
print("Total number of transactions: ", len(X_train) + len(X_test))
# 下采样数据集
X_train_undersample, X_test_undersample, y_train_undersample, y_test_undersample = train_test_split(X_undersample
, y_undersample
, test_size=0.3
, random_state=0)
print("")
print("Number transactions train dataset: ", len(X_train_undersample))
print("Number transactions test dataset: ", len(X_test_undersample))
print("Total number of transactions: ", len(X_train_undersample) + len(X_test_undersample))
from sklearn.linear_model import LogisticRegression # LogisticRegression逻辑回归
from sklearn.cross_validation import KFold, cross_val_score # KFold模型建立做几倍的交叉验证 cross_val_score交叉验证评估结果
from sklearn.metrics import confusion_matrix, recall_score, classification_report # confusion_matrix混淆矩阵
def printing_Kfold_scores(x_train_data, y_train_data):
fold = KFold(len(y_train_data), 5, shuffle=False) # 把原始训练集切分为5份
# Different C parameters
c_param_range = [0.01, 0.1, 1, 10, 100] # 正则化惩罚项
results_table = pd.DataFrame(index=range(len(c_param_range), 2), columns=['C_parameter', 'Mean recall score'])
results_table['C_parameter'] = c_param_range
# the k-fold will give 2 lists: train_indices = indices[0], test_indices = indices[1]
j = 0
for c_param in c_param_range: # 找最好的C参数
print('-------------------------------------------')
print('C parameter: ', c_param)
print('-------------------------------------------')
print('')
recall_accs = []
for iteration, indices in enumerate(fold, start=1): # 进行交叉验证
# Call the logistic regression model with a certain C parameter
lr = LogisticRegression(C=c_param, penalty='l1')
# Use the training data to fit the model. In this case, we use the portion of the fold to train the model
# with indices[0]. We then predict on the portion assigned as the 'test cross validation' with indices[1]
lr.fit(x_train_data.iloc[indices[0], :], y_train_data.iloc[indices[0], :].values.ravel())
# Predict values using the test indices in the training data
y_pred_undersample = lr.predict(x_train_data.iloc[indices[1], :].values)
# Calculate the recall score and append it to a list for recall scores representing the current c_parameter
recall_acc = recall_score(y_train_data.iloc[indices[1], :].values, y_pred_undersample) # 计算召回率
recall_accs.append(recall_acc)
print('Iteration ', iteration, ': recall score = ', recall_acc)
# The mean value of those recall scores is the metric we want to save and get hold of.
results_table.ix[j, 'Mean recall score'] = np.mean(recall_accs)
j += 1
print('')
print('Mean recall score ', np.mean(recall_accs))
print('')
best_c = results_table.loc[results_table['Mean recall score'].idxmax()]['C_parameter']
# Finally, we can check which C parameter is the best amongst the chosen.
print('*********************************************************************************')
print('Best model to choose from cross validation is with C parameter = ', best_c)
print('*********************************************************************************')
return best_c
best_c = printing_Kfold_scores(X_train_undersample, y_train_undersample)
import itertools
def plot_confusion_matrix(cm, classes,
title='Confusion matrix',
cmap=plt.cm.Blues):
"""
This function prints and plots the confusion matrix.
"""
plt.imshow(cm, interpolation='nearest', cmap=cmap)
plt.title(title)
plt.colorbar()
tick_marks = np.arange(len(classes))
plt.xticks(tick_marks, classes, rotation=0)
plt.yticks(tick_marks, classes)
thresh = cm.max() / 2.
for i, j in itertools.product(range(cm.shape[0]), range(cm.shape[1])):
plt.text(j, i, cm[i, j],
horizontalalignment="center",
color="white" if cm[i, j] > thresh else "black")
plt.tight_layout()
plt.ylabel('True label')
plt.xlabel('Predicted label')
lr = LogisticRegression(C=best_c, penalty='l1')
lr.fit(X_train_undersample, y_train_undersample.values.ravel())
y_pred_undersample = lr.predict(X_test_undersample.values)
# Compute confusion matrix
cnf_matrix = confusion_matrix(y_test_undersample, y_pred_undersample)
np.set_printoptions(precision=2)
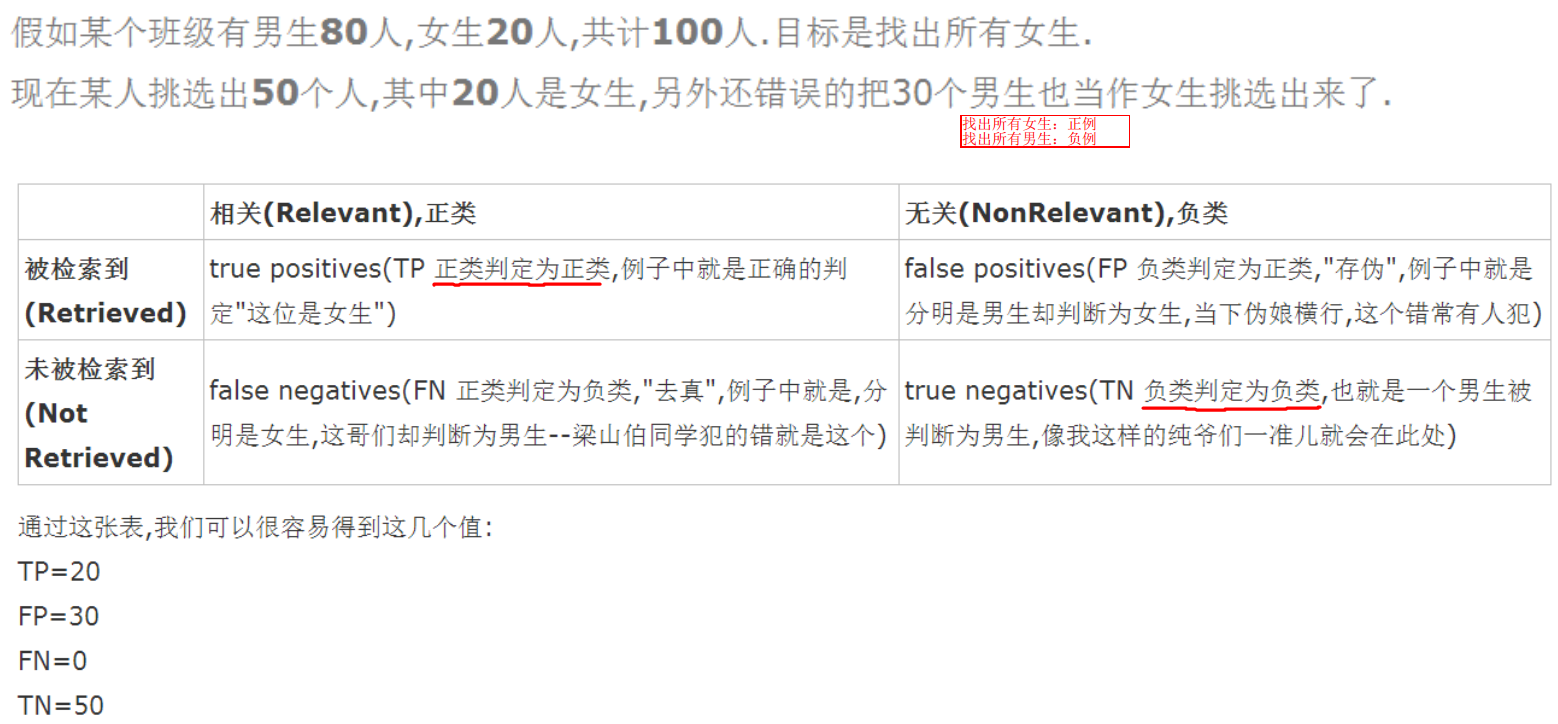
print("Recall metric in the testing dataset: ", cnf_matrix[1, 1] / (cnf_matrix[1, 0] + cnf_matrix[1, 1]))
# Plot non-normalized confusion matrix
class_names = [0, 1]
plt.figure()
plot_confusion_matrix(cnf_matrix
, classes=class_names
, title='Confusion matrix')
plt.show()
lr = LogisticRegression(C=best_c, penalty='l1')
lr.fit(X_train_undersample, y_train_undersample.values.ravel())
y_pred = lr.predict(X_test.values)
# Compute confusion matrix
cnf_matrix = confusion_matrix(y_test, y_pred)
np.set_printoptions(precision=2)
print("Recall metric in the testing dataset: ", cnf_matrix[1, 1] / (cnf_matrix[1, 0] + cnf_matrix[1, 1]))
# Plot non-normalized confusion matrix
class_names = [0, 1]
plt.figure()
plot_confusion_matrix(cnf_matrix
, classes=class_names
, title='Confusion matrix')
plt.show()
# 拿到数据不处理就开始给机器学习
best_c = printing_Kfold_scores(X_train, y_train)
lr = LogisticRegression(C=best_c, penalty='l1')
lr.fit(X_train, y_train.values.ravel())
y_pred_undersample = lr.predict(X_test.values)
# Compute confusion matrix
cnf_matrix = confusion_matrix(y_test, y_pred_undersample)
np.set_printoptions(precision=2)
print("Recall metric in the testing dataset: ", cnf_matrix[1, 1] / (cnf_matrix[1, 0] + cnf_matrix[1, 1]))
# Plot non-normalized confusion matrix
class_names = [0, 1]
plt.figure()
plot_confusion_matrix(cnf_matrix
, classes=class_names
, title='Confusion matrix')
plt.show()
lr = LogisticRegression(C=0.01, penalty='l1')
lr.fit(X_train_undersample, y_train_undersample.values.ravel())
y_pred_undersample_proba = lr.predict_proba(X_test_undersample.values) # predict_proba预测概率值
thresholds = [0.1, 0.2, 0.3, 0.4, 0.5, 0.6, 0.7, 0.8, 0.9] # 阈值 大于这个值的认为是True
plt.figure(figsize=(10, 10))
j = 1
for i in thresholds:
y_test_predictions_high_recall = y_pred_undersample_proba[:, 1] > i
plt.subplot(3, 3, j)
j += 1
# Compute confusion matrix
cnf_matrix = confusion_matrix(y_test_undersample, y_test_predictions_high_recall)
np.set_printoptions(precision=2)
print("Recall metric in the testing dataset: ", cnf_matrix[1, 1] / (cnf_matrix[1, 0] + cnf_matrix[1, 1]))
# Plot non-normalized confusion matrix
class_names = [0, 1]
plot_confusion_matrix(cnf_matrix
, classes=class_names
, title='Threshold >= %s' % i)
'''过采样'''
import pandas as pd
from imblearn.over_sampling import SMOTE # imblearn不平衡数据模块
from sklearn.metrics import confusion_matrix
credit_cards = pd.read_csv('creditcard.csv')
columns = credit_cards.columns
# The labels are in the last column ('Class'). Simply remove it to obtain features columns
features_columns = columns.delete(len(columns) - 1)
features = credit_cards[features_columns]
labels = credit_cards['Class']
features_train, features_test, labels_train, labels_test = train_test_split(features,
labels,
test_size=0.2,
random_state=0)
oversampler = SMOTE(random_state=0) # 用SMOTE算法生成数据,random_state=0每次生成的数据都是一样的
os_features, os_labels = oversampler.fit_sample(features_train, labels_train) # 只对训练集生成数据,测试集不用生成数据
len(os_labels[os_labels == 1])
os_features = pd.DataFrame(os_features)
os_labels = pd.DataFrame(os_labels)
best_c = printing_Kfold_scores(os_features, os_labels)
lr = LogisticRegression(C=best_c, penalty='l1')
lr.fit(os_features, os_labels.values.ravel())
y_pred = lr.predict(features_test.values)
# Compute confusion matrix
cnf_matrix = confusion_matrix(labels_test, y_pred)
np.set_printoptions(precision=2)
print("Recall metric in the testing dataset: ", cnf_matrix[1, 1] / (cnf_matrix[1, 0] + cnf_matrix[1, 1]))
# Plot non-normalized confusion matrix
class_names = [0, 1]
plt.figure()
plot_confusion_matrix(cnf_matrix
, classes=class_names
, title='Confusion matrix')
plt.show()
'''
样本数据不均衡,优先采用过采样
'''


 395
395


 被折叠的 条评论
为什么被折叠?


