


This article is an implement of:
1. dynamic update chart by matplotlib
2. raw data input by serial (COM port)
3. start/pause function for save value array
4. save as .csv format with system time as file name.
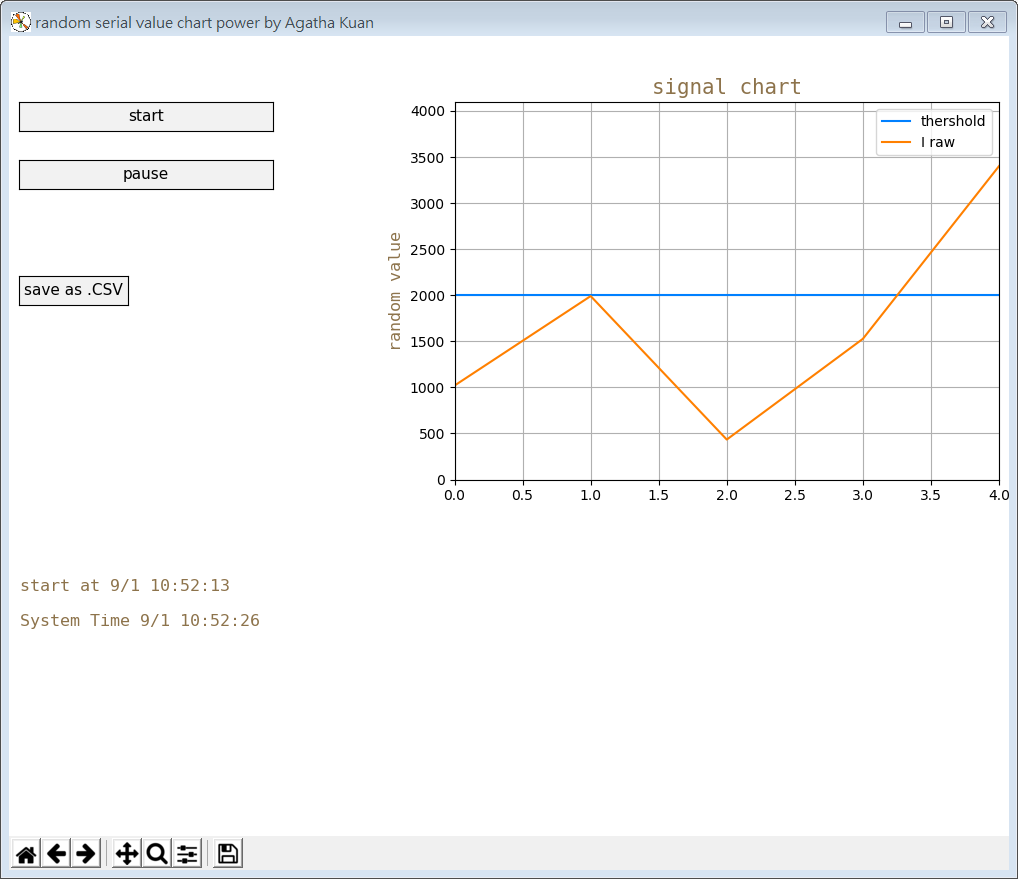
finally, it will be like this:
my Python Settings:
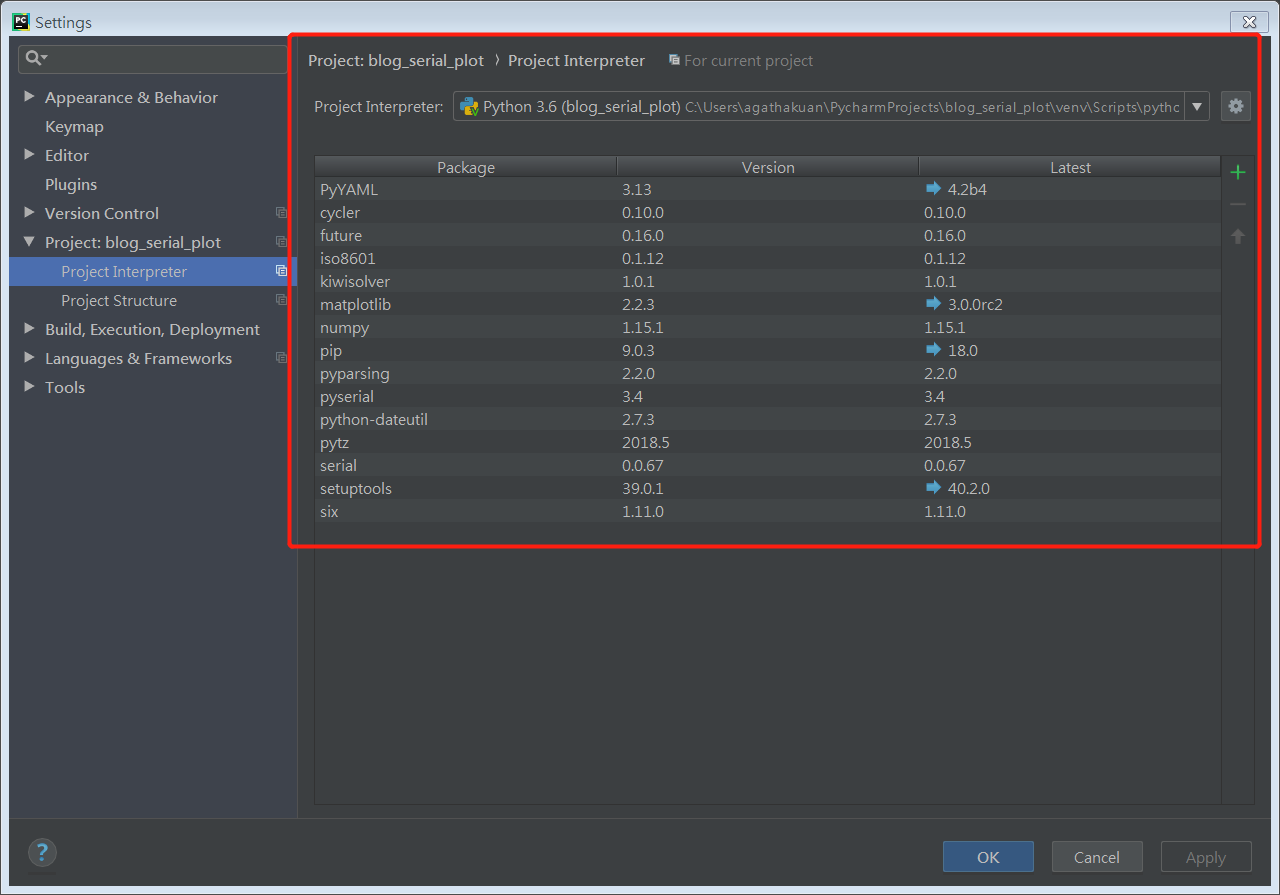
Install Package in Python 3.6:
from __future__ import print_function
import matplotlib
import matplotlib.pyplot as plt
from matplotlib.gridspec import GridSpec
from matplotlib.widgets import Button
import numpy as np
import serial
import datetime
import csv
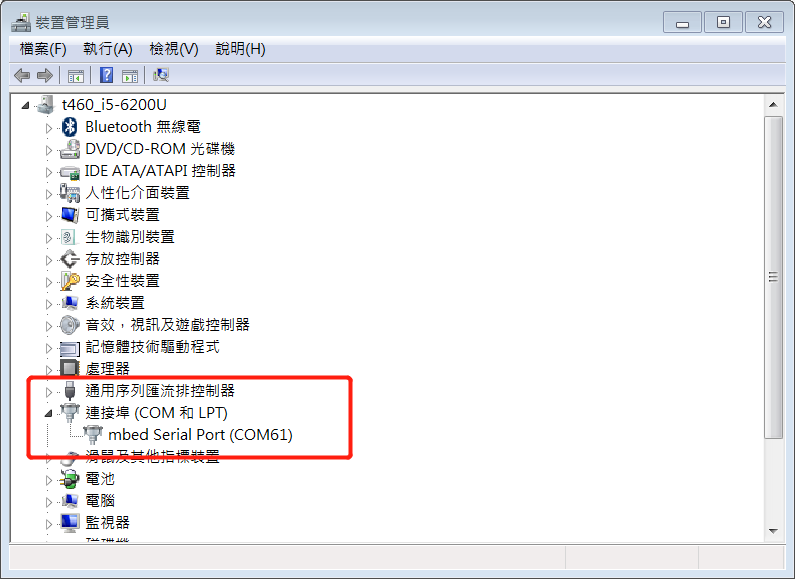
STEP 0. check your COM port number at Device manager:
my MCU now is COM61
STEP 1. check uart input format
For this example, I define my MCU input in this format:
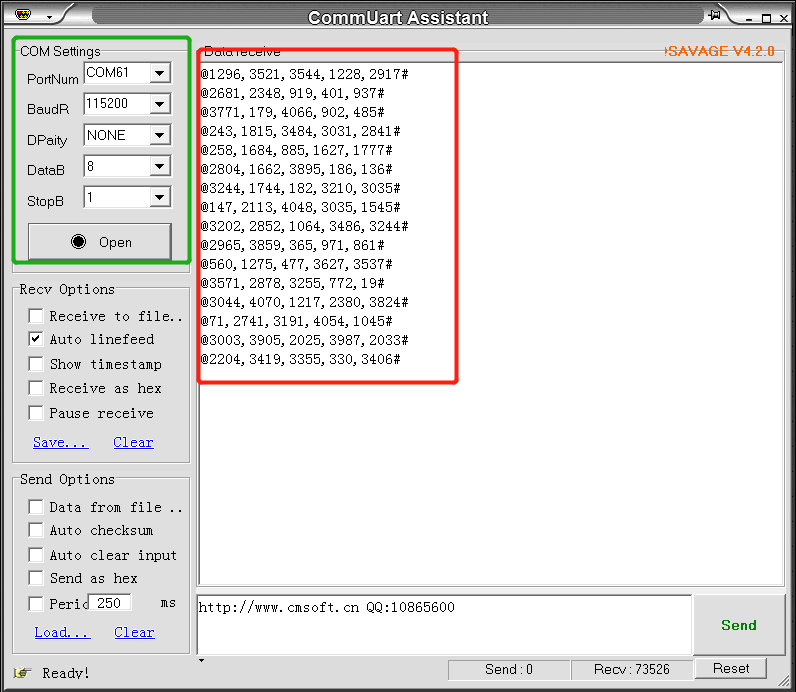
‘@’ (0x40) as begin, ‘#’ (0x23) as end
5 random values from 0 to 4096 , seperated by ‘,’ (0x2c)
and I want to dynamic show on plot
STEP 2. new Python project file, install package
at the front of this article, I post every package this project need.
from __future__ import print_function
import matplotlib
import matplotlib.pyplot as plt
from matplotlib.gridspec import GridSpec
from matplotlib.widgets import Button
import numpy as np
import serial
import datetime
import csv
STEP 3. add these file into project file path
main.py
replace
COM = ‘COM61’
as your COM number checked in STEP 0.
from __future__ import print_function
import matplotlib
import matplotlib.pyplot as plt
from matplotlib.gridspec import GridSpec
from matplotlib.widgets import Button
import datetime
import csv
import class_serial_input as serial
import class_line as line
UPDATE_INTERVAL_IN_MSEC = 80
SERIAL_DATA_IN = 1
SERIAL_DATA_STOP = 0
serial_data_flag = SERIAL_DATA_IN
COM = ‘COM61’
def start_func(label):
print(” in start func”)
global serial_data_flag
serial_data_flag = SERIAL_DATA_IN
def stop_func(label):
print(” in stop func”)
global serial_data_flag
serial_data_flag = SERIAL_DATA_STOP
def save_chart_csv(label):
print(” save chart as csv”)
i_line_data = i_line.get_i_line()
with open(‘output_%u_%u_%u_%u_%u_%u.csv’ % (now_time.year, now_time.month, now_time.day,
now_time.hour, now_time.minute, now_time.second),
‘w’, newline=”) as csvfile:
writer = csv.writer(csvfile, delimiter=’,’)
writer.writerow(i_line_data)
if __name__ == “__main__”:
print(“start up \r\n”)
#default_port = serial_data.Serial_data(“random_data” sys.argv[1])
default_port = serial.serial_input(“random_data”,com=COM)
#init matplot interface
fig = plt.figure(‘random serial value chart power by Agatha Kuan’, figsize=(10, 8))
gs = GridSpec(14, 14, left=0.01, bottom=0.01, right=1 - 0.01, top=1 - 0.01, wspace=1, hspace=1)
i_chart_axes = plt.subplot(gs[1:8, 6:14])
i_chart_axes.axis([0, 4, 0, 4096])
plt.ion()
plt.ylabel(“random value”, color=’#8d734b’, size=12, family=’monospace’)
plt.title(“signal chart”, color=’#8d734b’, size=15, family=’monospace’)
plt.grid(True)
#init line
i_line = line.Init_line(“line_1”)
#init button
point_start = plt.subplot(gs[1, :4])
button_start = Button(point_start, ‘start’, color=’0.95’, hovercolor=’0.6’)
button_start.label.set_fontsize(11)
button_start.on_clicked(start_func)
point_stop = plt.subplot(gs[2, :4])
button_stop = Button(point_stop, ‘pause’, color=’0.95’, hovercolor=’0.6’)
button_stop.label.set_fontsize(11)
button_stop.on_clicked(stop_func)
point_save_csv = plt.subplot(gs[4, :2])
button_save_csv = Button(point_save_csv, ‘save as .CSV’, color=’0.95’, hovercolor=’0.6’)
button_save_csv.label.set_fontsize(11)
button_save_csv.on_clicked(save_chart_csv)
now_time = datetime.datetime.now()
sys_start_time = datetime.datetime.now()
time_stamp = plt.subplot(gs[7:11, :2])
time_stamp.axis(‘off’)
time_stamp_text = plt.text(0.01, 0.05, ” “, color=’#8d734b’, size=12, family=’monospace’,
transform=time_stamp.transAxes)
while 1 :
if SERIAL_DATA_STOP != serial_data_flag:
default_port.get_serial_data()
i_tmp = default_port.get_data()
i_line.draw_update_thershold()
i_line.draw_update_signal_line(i_tmp)
i_chart_axes.relim(True)
i_chart_axes.autoscale_view(True, ‘y’, True)
now_time = datetime.datetime.now()
time_stamp_text.set_text(“start at %u/%u %u:%u:%u \n\n”
“System Time %u/%u %u:%u:%u \n”%(sys_start_time.month,sys_start_time.day,sys_start_time.hour,
sys_start_time.minute,sys_start_time.second,
now_time.month, now_time.day,now_time.hour,
now_time.minute, now_time.second))
fig.canvas.draw()
plt.pause(float(UPDATE_INTERVAL_IN_MSEC) / 1000.0)
default_port.clear_data()
class_serial_input.py
import serial
import numpy as np
POINT_TO_UPDATE = 5
SEPERATE_SIGN = 0x2C
DATA_MAX_LEN = (2+(1+4)*(POINT_TO_UPDATE+1))*2
__metaclass__ = type
class serial_input:
def __init__(self,name,com=’COM61’,baudrate=115200):
self.ser = serial.Serial(com, baudrate)
self.port = com
self.baudrate = baudrate
self.num_array = np.repeat(0x00, POINT_TO_UPDATE)
def get_serial_data(self):
self.ser.flushInput()
char_in = self.ser.read(DATA_MAX_LEN)
char_in = bytearray(char_in)
temp = np.repeat(0x00, DATA_MAX_LEN)
valid_tmp = np.repeat(0x00, DATA_MAX_LEN)
for i in range (DATA_MAX_LEN):
temp[i] = int(char_in[i])
start_addr = np.argwhere(temp == 0x40)
end_addr = np.argwhere(temp == 0x23)
if(int(start_addr[0]) < int(end_addr[0])):
start = int(start_addr[0])
end = int(end_addr[0])
for i in range (end-start):
valid_tmp[i] = temp[start+1+i]
else:
start = int(start_addr[0])
end = int(end_addr[1])
for i in range(end - start):
valid_tmp[i] = temp[start + 1 + i]
common_addr = np.argwhere(valid_tmp == 0x2c)
for i in range (int(common_addr[0])):
self.num_array[0] = self.num_array[0]+(valid_tmp[i]-0x30)*pow(10, int(common_addr[0])-1-i)
for i in range(1,4):
start = int(common_addr[i-1])
end = int(common_addr[i])
for j in range(0,end-start-1):
self.num_array[i] = self.num_array[i] + (valid_tmp[start+1+j]-0x30)*pow(10,end-start-2-j)
end_addr = np.argwhere(valid_tmp == 0x23)
for i in range (int(end_addr[0])-int(common_addr[3])-1):
self.num_array[4] = self.num_array[4]+(valid_tmp[int(common_addr[3])+1+i]-0x30)*pow(10, int(end_addr[0])-int(common_addr[3])-2-i)
def get_data(self):
print(self.num_array)
return self.num_array
def clear_data(self):
self.num_array = np.repeat(0x00, POINT_TO_UPDATE)
class_line.py
線條的顏色: https://www.cnblogs.com/darkknightzh/p/6117528.html
import matplotlib.pyplot as plt
import numpy as np
__metaclass__ = type
THRESHOLD_VALUE = 2000
TIME_WINDOW_WIDTH_IN_SEC = 2.0
POINTS_IN_ONE_UPDATE = 5
VIEW_POINT_IN_SEC = 1*POINTS_IN_ONE_UPDATE
TIME_STAMP_ARRAY = np.arange(0, VIEW_POINT_IN_SEC, 1)
class Init_line:
def __init__(self,name):
global TIME_STAMP_ARRAY
self.time_window_begin = 0.0
self.time_window_end = self.time_window_begin + TIME_WINDOW_WIDTH_IN_SEC
self.time_line_value = TIME_STAMP_ARRAY
self.thershold_line_value = np.repeat(THRESHOLD_VALUE, len(self.time_line_value))
freq = 5.0
omega = 2.0 * np.pi * freq
constant_for_signal_shift = 1
self.i_raw_line_value = np.sin(omega * self.time_line_value) + constant_for_signal_shift
self.thershold_line, = plt.plot(self.time_line_value, self.thershold_line_value,label=”thershold”,color=’#0080FF’)
self.i_raw_line, = plt.plot(self.time_line_value, self.i_raw_line_value,label=”I raw”, color=’#FF8000’)
plt.legend(loc=’upper right’)
def draw_thershold(self):
self.thershold_line, = plt.plot(self.time_line_value, self.thershold_line_value)
def draw_update_thershold(self):
global TIME_STAMP_ARRAY
self.time_line_value = TIME_STAMP_ARRAY
self.thershold_line.set_data(self.time_line_value, self.thershold_line_value)
def draw_init_signal_line(self):
self.i_raw_line, = plt.plot(self.time_line_value, self.i_raw_line_value)
def draw_update_signal_line(self,update_i_temp):
self.i_raw_line_value = np.roll(self.i_raw_line_value, -POINTS_IN_ONE_UPDATE)
self.i_raw_line_value[-(POINTS_IN_ONE_UPDATE):] = update_i_temp
self.i_raw_line.set_data(self.time_line_value, self.i_raw_line_value)
def get_i_line(self):
return self.i_raw_line_value
STEP 4.run the Python file

when you run this python script, the PLOT start to update.
STEP 5. SAVE as csv file with time stamp as file name

press pause button to pause the update plot, then
press save as csv button
you will see a csv file in project path with time stamp as file name
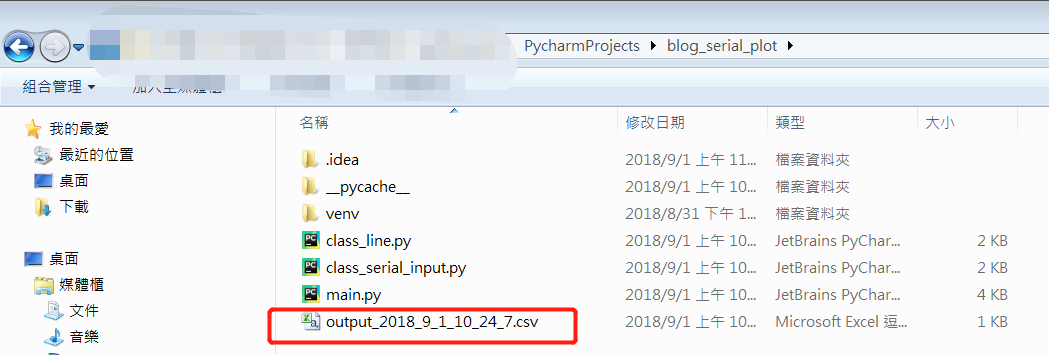
open the file in EXCEL, you can see the raw data:

NOTE:
- this implement only use matplotlib to draw figure and canvas, didn’t use other graphic UI structure like TKinter or PyQT5
- the speed of COM data update is limited cause I didn’t use multi-thread programming.
reference:


 被折叠的 条评论
为什么被折叠?
被折叠的 条评论
为什么被折叠?
 到【灌水乐园】发言


