


推荐步骤:
安装elasticsearch
elasticsearch-head图形化管理ELK工具
安装elasticsearch-head
安装logstash
安装kibana
客户端验证配置
配置监控客户端
实验环境:三台linux服务器,一台win7火狐客户端
给两台虚拟机分别添加一块NAT网卡
配置ELK
1.安装elasticsearch
导入公钥
[root@centos01 ~]# rpm --import https://artifacts.elastic.co/GPG-KEY-elasticsearch
2)导入elasticsearch程序到Linux系统安装程序
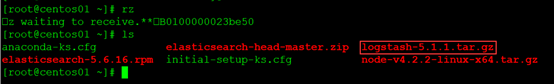
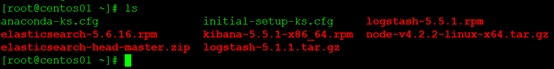
使用rz命令上传elasticsearch-5.6.16.rpm 软件包
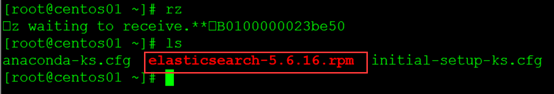
[root@centos01 ~]#yum -y install local elasticsearch-5.6.16.rpm
3)修改elasticsearch,备份主配置文件
[root@centos01~]#cp /etc/elasticsearch/elasticsearch.yml /etc/elasticsearch/elasticsearch.yml.bak
[root@centos01 ~]# vim /etc/elasticsearch/elasticsearch.yml
cluster.name: ELK 群集名字
node.name:centos01
network.host:192.168.100.10 监听IP地址
discovery.zen.ping.unicast.hosts:[“centos01”, “centos02”]
配置计算机加入ELK群集
4)配置hosts文件解析计算机名
root@centos01 ~]#vim /etc/hosts
192.168.100.10 centos01
192.168.100.20 centos02
5)配置守护进程运行elasticsearch
[root@centos01 ~]#systemctl daemon-reload
6)启动服务设置服务开机自动启动
[root@centos01 ~]#systemctl start elasticsearch
[root@centos01 ~]#systemctl enable elasticsearch
[root@centos01 ~]#/etc/init.d/elasticsearch start
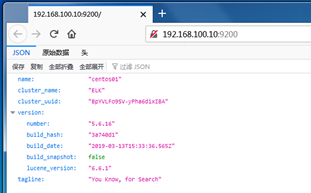
7)监听9200端口
[root@centos01 ~]#netstat -anptu | grep 9200

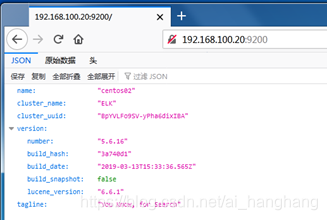
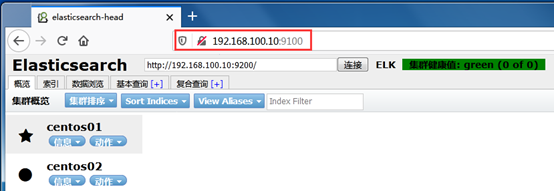
客户端访问测试
第二台如上配置!!!
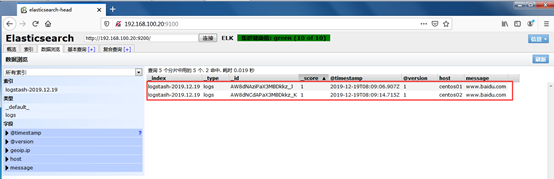
2.elasticsearch-head图形化管理ELK工具
1)安装node,安装/usr/local/node中
通过rz命令上传软件包

[root@centos01 ~]#tar zxvf node-v4.2.2-linux-x64.tar.gz -C /usr/local/
[root@centos01 ~]# cd /usr/local/
[root@centos01local]# mv node-v4.2.2-linux-x64/ node
2)连接管理命令
[root@centos01 ~]#ln -s /usr/local/node/bin/npm /usr/local/bin/npm
[root@centos01 ~]#ln -s /usr/local/node/bin/node /usr/local/bin/node
3)配置安装源,生成elasticsearch-head
[root@centos01~]# git clone git://github.com/mobz/elasticsearch-head.git

4)配置环境变量加载node,使用大G在行尾添加
[root@centos01 ~]#vim /etc/profile
exportNODE_HOME=/usr/local/node
exportPATH= P A T H : PATH: PATH:NODE_HOME/bin
exportNODE_PATH=$NODE_HOME/lib/node_modules/
[root@centos01 ~]#source /etc/profile
5)修改elasticsearch连接elasticsearch-head
[root@centos01 ~]#vim /etc/elasticsearch/elasticsearch.yml
http.cors.enabled:true
http.cors.allow-origin:"*"
重启服务
[root@centos01 ~]#/etc/init.d/elasticsearch stop
[root@centos01 ~]#/etc/init.d/elasticsearch start
监听默认端口号9200

centos01,centos02配置一样!
3.安装elasticsearch-head
1)修改安装位置
[root@centos01 ~]#mv elasticsearch-head /usr/local/
2)安装grunt-cli程序
[root@centos01 ~]#cd /usr/local/elasticsearch-head/
[root@centos01elasticsearch-head]# npm install -g grunt-cli
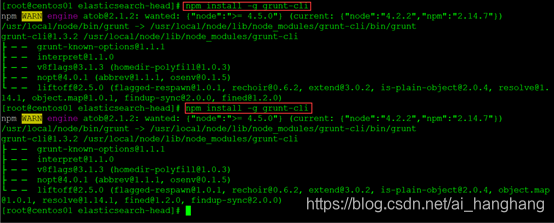
3)检查grunt是否安装成功
[root@centos01elasticsearch-head]# grunt -version
grunt-cli v1.3.2
4)修改elasticsearch-head配置文件
[root@centos01 ~]#vim /usr/local/elasticsearch-head/Gruntfile.js
99 keepalive: true,
100 hostname: “*”
5)修改elasticsearch-head
[root@centos01 ~]#vim /usr/local/elasticsearch-head/_site/app.js
4374 this.base_uri =
this.config.base_uri || this.prefs.get(“app-base_uri”) ||
“http://192.168.100.10:9200”;
6)安装npm
[root@centos01 ~]#cd /usr/local/elasticsearch-head/
[root@centos01elasticsearch-head]# npm install
7)启动服务
[root@centos01elasticsearch-head]# grunt server&
8)重新启动elasticsearch服务
[root@centos01 ~]#/etc/init.d/elasticsearch restart
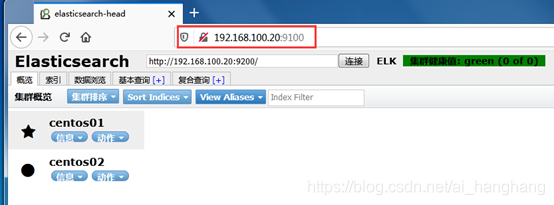
客户端访问验证
4.安装logstash
1)安装logstash,两种方法,一种使用网络源安装,第二种通过本地rpm包上传
使用rz命令上传logstash-5.1.1.tar.gz 软件包,使用网络源安装
[root@centos01 ~]#tar zxvf logstash-5.1.1.tar.gz -C /usr/local/
[root@centos01local]# mv logstash-5.1.1/ logstash
[root@centos01 ~]#yum -y install logstash
第二种方法:
使用rz命令上传logstash-5.5.1.rpm 软件包
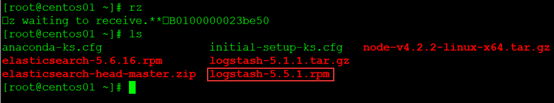
[root@centos01~]# rpm -ivh logstash-5.5.1.rpm
2)优化安装命令
[root@centos01 ~]#ln -s /usr/share/logstash/bin/logstash /usr/local/bin/
3)配置存储数据目录
[root@centos01 ~]#mkdir -p /usr/share/logstash/config
[root@centos01 ~]#ln -s /etc/logstash/* /usr/share/logstash/config/
4)启动logstash
[root@centos01 ~]#systemctl start logstash
[root@centos01 ~]#systemctl enable logstash
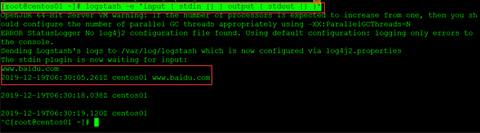
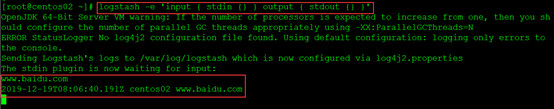
5)写入测试数据测试日志服务器
[root@centos01~]# logstash -e ‘input { stdin {} } output { stdout {} }’
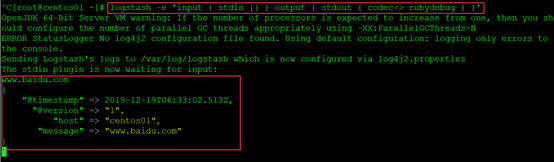
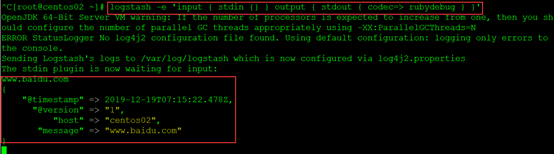
[root@centos01~]# logstash -e ‘input { stdin {} } output { stdout { codec=> rubydebug } }’
[root@centos01~]# logstash -e ‘input { stdin {} } output { elasticsearch {
hosts=>[“192.168.100.10:9200”] } }’
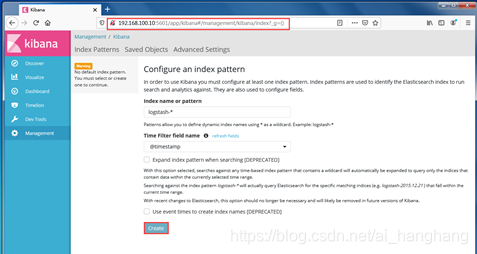
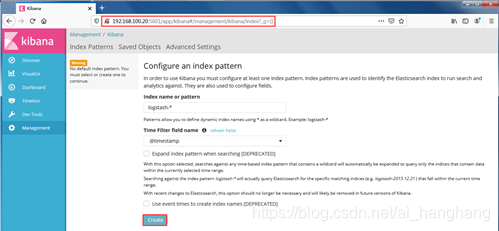
5.安装kibana
1)安装kibana,使用rz命令上传kibana-5.5.1-x86_64.rpm软件包
[root@centos01 ~]#rpm -ivh kibana-5.5.1-x86_64.rpm
1)修改kibana主配置文件,备份主配置文件
[root@centos01 ~]#cp /etc/kibana/kibana.yml /etc/kibana/kibana.yml.bak
[root@centos01 ~]# vim /etc/kibana/kibana.yml
server.port: 5601
server.host:“0.0.0.0”
elasticsearch.url:“http://192.168.100.10:9200”
kibana.index:".kibana"
3)启动服务设置服务开机自动启动
[root@centos01 ~]#systemctl start kibana
[root@centos01 ~]#systemctl enable kibana
客户端访问验证,默认端口号5601
6.配置监控客户端
1)安装logstash,通过rz命令上传logstash-5.5.1.rpm软件包
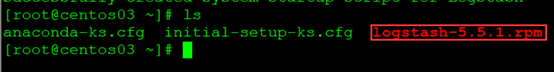
[root@centos03 ~]#rpm -ivh logstash-5.5.1.rpm
2)安装apache
[root@centos03 ~]#yum -y install httpd
[root@centos03 ~]#systemctl start httpd
[root@centos03 ~]#systemctl enable httpd
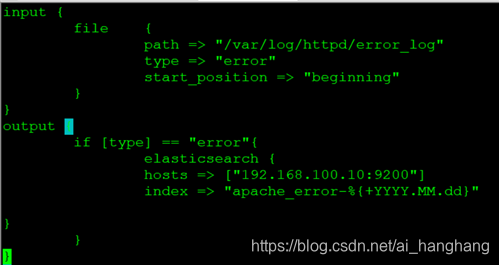
3)配置监控apache的错误日志
[root@centos03 ~]#vim /etc/logstash/conf.d/apache_error.conf
input {
file
{
path =>
“/var/log/httpd/error_log”
            type => "error"

            start_position =>
“beginning”
}
}
output {
    if [type] == "error"{

            elasticsearch {

            hosts =>
[“192.168.100.10:9200”]
index => "apache_error-%{+YYYY.MM.dd}"
}
}
}
4)启动服务设置服务开机自动启动
[root@centos03 ~]#systemctl start logstash
[root@centos03 ~]#systemctl enable logstash
5)启动监控apache服务器
[root@centos03 ~]#/usr/share/logstash/bin/logstash -f /etc/logstash/conf.d/apache_error.conf
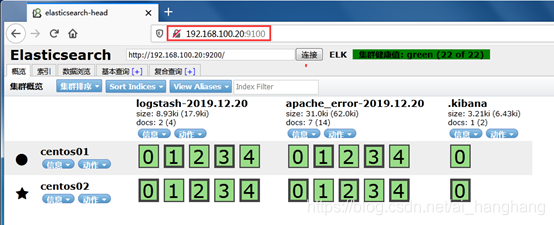
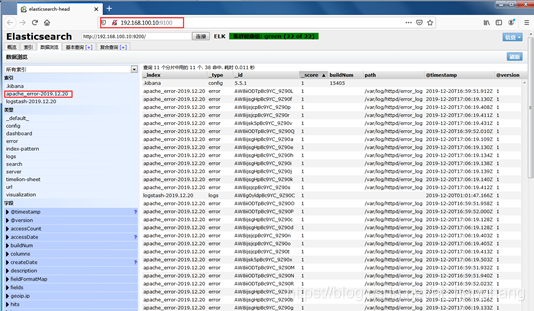
6)开台客户端访问验证


 3023
3023


 被折叠的 条评论
为什么被折叠?
被折叠的 条评论
为什么被折叠?
 到【灌水乐园】发言


