


D3全称是Data-Driven Documents数据驱动文档,是一个开源的javascript库,可以用于数据可视化图形的创建,该库更接近底层,与 g2、echarts 不同,d3 能直接操作 svg,所以拥有极大的自由度,几乎可以实现任何 2d 的设计需求。
正如其名 Data Driven Documents,其本质是将数据与 DOM 绑定,并将数据映射至 DOM 属性上,D3扮演的是一个驱动程序的角色,联系着数据和文档。
与echarts 相比,D3.js 不会生成事先定义好的图表,而是提供一些方法用来生成带数据的标签,绑定可视化的属性,由自己定义如何制作图表,还提供很多数据处方法,可以更好的显示的数据模型。echarts 可以提供更方便的图表组件,满足大部分的需求,D3.js 可以提供更丰富的自定义功能,适合定制化。
学习D3.js 更多的时候是学习它如何加载、绑定数据、数据处理、变换和过渡等这些方法的过程,而且D3.js 用了一种与 jQuery 一样的 链式语法。官方文档的 API 非常的多,本文也只是小小的记录一下项目实现。功能比较简单,做个记录。
下载依赖包: npm install d3 d3-graphviz@4 App.vue
<template>
<div id="app">
<Graph :code="jsonToDot()"/>
</div>
</template>
<script>
import Graph from "./components/Graph"; // 封装了一个子组件
export default {
data() {
return {
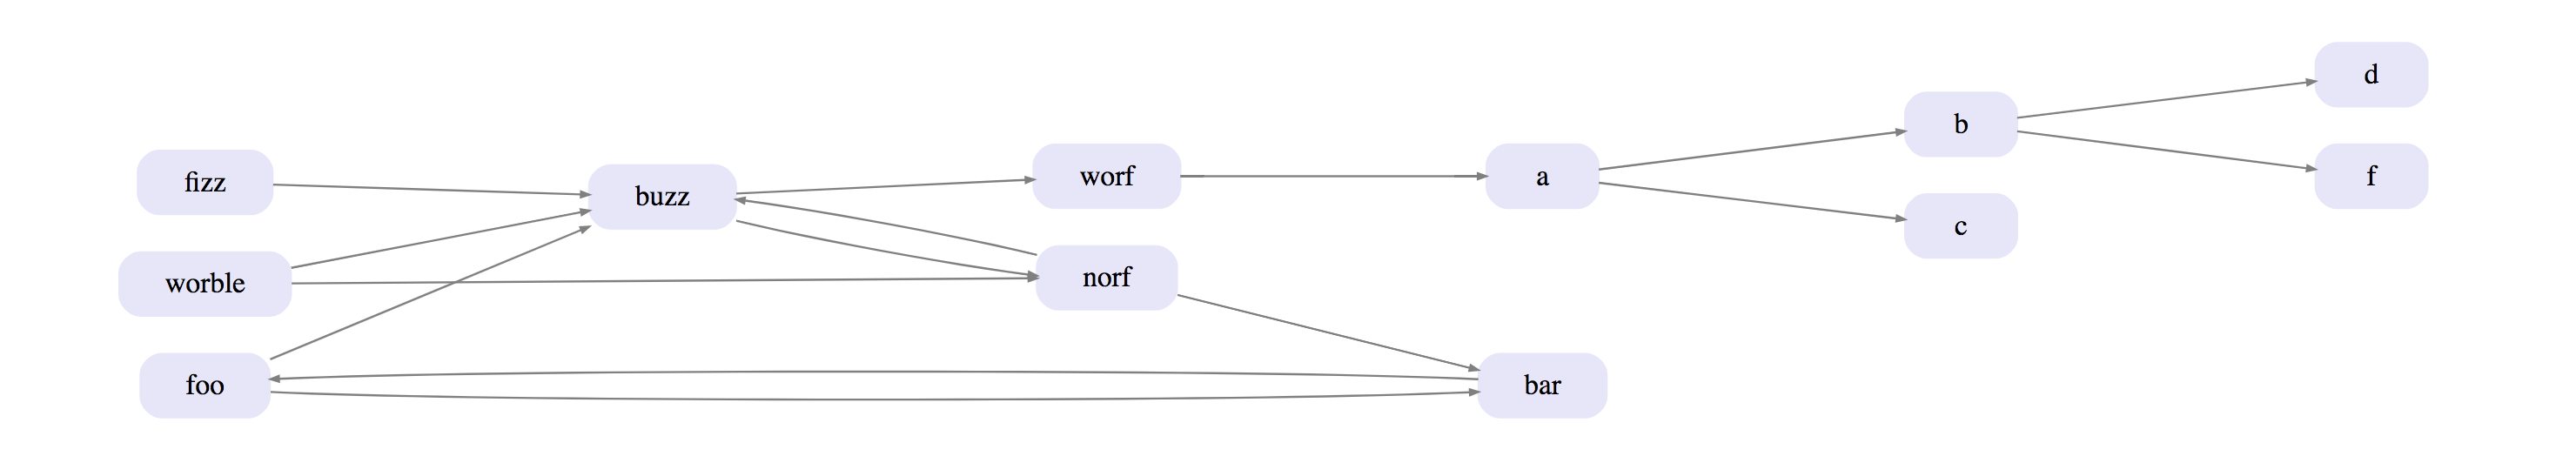
dot: JSON.stringify({ // 测试数据
foo: ["bar", "buzz"],
bar: ["foo"],
norf: ["bar", "buzz"],
worf: ["a"],
fizz: ["buzz"],
worble:["norf","buzz"],
buzz:["norf","worf"],
a:["b","c"],
b:["d","f"]
})
};
},
components: {
Graph
},
methods: {
jsonToDot() { // 处理数据格式为 插件可以解析的格式
const json = JSON.parse(this.dot);
return (
Object.entries(json).reduce((acc, [node, dependencies]) => {
return dependencies.reduce(
/**
* 此处为单个节点关系,设置样式
* arrowsize: 箭头尺寸
* color:连接线的颜色
* style:节点边框形状,rounded 圆角
*/
(acc, dependency) => acc + ` "${node}" -> "${dependency}"\n [arrowsize=.4, color=grey, style="rounded"]`,
acc
);
/**
* 此处设置graph图所有点线关系的统一样式
* ranksep: node之间的间距
* graph - rankdir: 布局方向,LR从左到右,TB从上到下(默认)
* graph - bb: 以点为单位的绘图边界框
* node - margin: 节点内边距
* node - shape: 节点形状
* node - height: 节点高度
* node - style: 节点样式,圆角,填充色
* node - color: 颜色
* node - fillcolor: 背景填充色
* edge - style: 连线样式 solid实线
* edge - arrowhead: 连线箭头样式
* edge - arrowtail: 连线箭尾样式
* ......
* 还有很多属性,可参考下方提供的参考文档
*/
},`digraph G { ranksep = 2.0; graph [rankdir=LR,bb="0,0,412.05,372.8"];node [margin=".3,.1",shape=box,height=.3, style="rounded,filled", color="lightgreen", fillcolor="lightgreen"]; edge [style=solid,arrowhead=normal,arrowtail=dot,]; \n`) + "}"
);
}
}
};
</script>Graph.vue: 其中/@hpcc-js/wasm/dist/index.min.js该文件服务器地址不是很稳定,建议下载下来,存在自己项目的服务器上。
<template>
  <div>
    <script src="https://unpkg.com/@hpcc-js/wasm/dist/index.min.js" type="javascript/worker"/>
    <div id="graph"/>
  </div>
</template>
<script>
import * as d3 from 'd3'
import * as d3Graphviz from 'd3-graphviz'
export default {
  props: {
    code: {
      type: String,
      default:  `digraph G {
            node [shape="record"];
            edge [style="dashed"];
            a -> b
          }`
    }
  },
  methods: {
   render() {
      // scale 缩放比例
      // fit(true) 自适应缩放,当节点比较多时可以显示完成的图,但是会看不清楚,节点较少时,会很大,慎用!!默认值false
      d3Graphviz.graphviz("#graph").width(window.innerWidth).height(1500).scale(0.8).attributer(function (d) {
        // 当节点非常多时,默认将主节点调至视口中间。 适用于数据量差不多的数据,统一调整图表视口,否则数据较少时,图表上移可视窗口会看不见
        /* const px2pt = 3 / 4;
        * if (d.tag === 'svg') {
        *   var selection = d3.select(this);
        *   var width = d.attributes.width;
        *   var height = d.attributes.height;
        *   var w = d.attributes.viewBox.split(" ")[2];
        *   var h = d.attributes.viewBox.split(" ")[3];
        *   var x = (width - w) / 3;
        *   var y = height;
        *   console.log(width, height, w, h, x, y, width * px2pt, height * px2pt);
        *   //   selection.attr("viewBox", -x + " " + y + " " + w + " " + (height * px2pt));
        *   d.attributes.viewBox = 0 + " " + 0 + " " + w + " " + h;
        *  }
        */
        // 当节点非常多时,默认将主节点调至视口中间。比例是我自己估算的, 适用于数据数量不确定,相差较大的数据
        const childNum = 8 / 5;
        if (d.tag === 'g' && d.parent.tag == 'svg') {
          if (d.children.length > 500) {
            d.translation.y = d.children.length * childNum
          }
        }
      }).renderDot(this.code)
    }
  },
  mounted() {
    this.render();
  },
  watch: {
    code() {
      this.render();
    }
  }
};
</script>
实现效果图:
官方文档:
官方案例参考 D3 Graphviz Examples:
案例列表: https://codesandbox.io/examples/package/d3-graphviz
本人参考案例:https://codesandbox.io/s/graph-viz-ltx0q-ltx0q?file=/src/App.vue


 2675
2675


 被折叠的 条评论
为什么被折叠?
被折叠的 条评论
为什么被折叠?
 到【灌水乐园】发言


