


Task1:Create a State Diagram
{Passage} UML state diagrams with draw.io
UML state diagrams with draw.io - draw.io
State diagrams have been used in programming to describe the various possible states that a system can be in for decades. They also quickly show which states lead to each other, and what triggers a change of state.
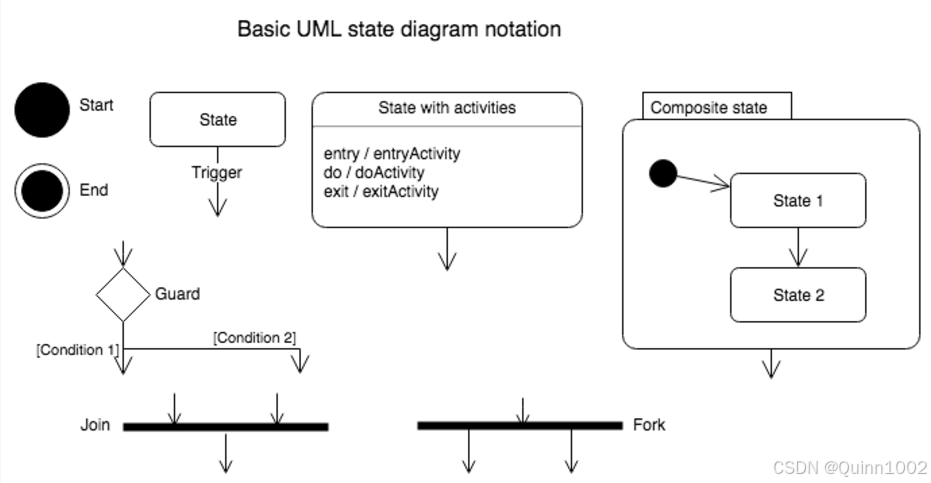
The different between forks/joins and guards
Guards represent decisions based on conditions, similar to those in flow charts.
Forks and joins occur where there are two or more parallel things being done in a program – concurrent states.
{Passage} State Machine Diagrams | Unified Modeling Language (UML)
State Machine Diagrams | Unified Modeling Language (UML) - GeeksforGeeks
{Passage} How a loan management system works
How a Loan Management System Works — Infinity Enterprise Lending Systems
What Is a Loan Management System?
From helping you process new customers and loans to creating statements and reports for your existing clients, a loan management system just makes everything easier.
How a Loan Management System Can Help?
from eligibility(资格) down to that last payment
When a new customer comes; Collecting their financial documents and reviewing it all for any red flags that may prevent them from being able to pay back their loan. With a Loan Management System, -> credit scores and other associated financial information.
A Loan Management System allows people to calculate important figures, deadlines and fees on the fly – even sending out notices for upcoming payments and more.
Get the ability to automatically stay on top of all those different accounts and the different stages of maturation that they’re all in – even late fees are a cinch when you’re able to automatically calculate them and send them off without logging in.
Create a better understanding of how your business is doing
Manage All Your Loans With Loan Management Software
Task2: Write a feature proposal
Task Overview: Credit risk prediction is a critical aspect of loan approval but currently is largely handled manually. Learn how to make this process more efficient by incorporating machine learning into the loan approval pipeline.
Goal: Research how ML systems are currently used to assess credit risk; Write a proposalfor your team lead to see if you should pursue this opportunity.
Background
Risk is typically assessed by manual review of financial statements and credit reports.
Incorporate ML. Adding a credit risk modeling step.
Dig into its plausibility. First, how machine learning systems are currently used to assess credit risk. Second, write up a brief proposal for this feature. proposal includes [how it works, potential challenges, limitations].
Task Instruction
- Determine the data your model will need. What
input variableswill be used to predict credit risk? - Determine what the model will output. What will the
output variableslook like? - Explore possible
model types and architecturesthat can be used for this system. - Consider the
risks or challengesof creating a credit risk modeling system.
*Proposal
Credit Risk Modeling Proposal
[Sum up the benefits of a machine learning system for credit risk modeling here]
Credit risk modeling is the application of risk models to creditor practices to help create strategies that maximize return (interest) and minimize risk (defaults). It can handle large volumes of data, identify complex patterns, and make accurate predictions. They key benefits include:
- Improved Accuracy: Machine Learning models can capture non-linear relationships and interactions between variables, leading to more accurate predictions of credit risk.
- Scalability: These models can process vast amounts of data quickly, allowing for the assessmet of a large number of loan applications in a short period.
- Adaptability: Machine Learning models can be continuously trained and updated with new data, ensuring that they remain releant in changing economic conditions.
- Cost-Effectiveness: By automating the risk assessment process, institutions can reduce the need for manual intervention, thereby lowering operational costs.
- Enhanced Customer Experience: Faster and more accurate risk assessments can lead to quicker loan approvals, improving customer satisfaction.
Standard Answer: Efficiency, Accurate risk management, Adaptability to new data
Data Requirements
[What does a system like this require? What variables would help build a good system?]
In credit risk models, the target variable or the data requirements are often the events of loan defaults or the events of loan prepayments. According to Khemakhem and Meisenzahl, the key factors in predicting creditworthiness of borrowing companies are profitability ratios, reypayment capacity, solvecy, duration of a credit report, guarantees, company size, loan number, ownership structure, corporate banking relationship (duration) and unemplayment rate.
There are multiple methods to help find the most predictive set to use, among a large set of potential factors, such as Hypothesis Tests, Clustering and Principle Component Analysis and Factor Analysis.
Finding the best set of variables (or factors) means less cost in terms of measurement and data storage, more accurate predictions, and better understanding of the underlying relationship between the risk and risk factors.
Standard Answer: Loan amount, loan purpose, employment category, education level, income, credit score, debt-to-income ratio, loan repayment history and outstanding loans.
Data Outputs
[What are important outputs that loan officers will use to make an informed loan approval decision?]
The outputs from a credit risk modeling system are crucial for loan officers to make informed decisions. Some of the key outputs include:
- Probability of Default (PD): A score indicating the likelihood that a borrower will default on their loan.
- Loss Given Default (LGD): The expected loss if a borrower defaults.
- Exposure at Default (EAD): The amount of money that would be at risk if a borrower defaults at a specific point of time.
- Credit Score: A composite score that summarizes the borrower’s creditworthiness.
- Risk Rating: A categorical rating indicating the level of risk associated with a loan.
- Recommendation: A clear recommendation on whether to approve or deny a loan application.
Standard Answer: Credit risk score and Probability of default
Architecture
[Review the various model types and architectures available for this type of machine learning system. What are the common choices and what will perform best given our restraints?]
There are lots of risk models and algorithms for prediction, such as Naïve Bayes Classifier (linear regression), Support Vector Machines (logistic regression), Dicision Trees, Random Forest, Gradient Boosting (Generalized Linear Models), Time Series (Neural Networks).
Besides, mathematical optimization is a class of methods that are often used together with predictive models, such as Nelder-Mead, Non-negative Least Squares, Maximum Likelihood, that can be used to find the best mix of credit products in a portfolio to keep risk low while achieving a high expected return.
Risks and Challenges
[What are some of the risks and challenges we’ll need to keep in mind while developing this credit risk modeling system?]
Developing a credit risk modeling system comes with several risks and challenges:
- Data Quality Issues: Inaccurate, incomplete, or biased data can lead to incorrect predictions and poor decision-making.
- Model Interpretability: Complex models like neural networks can be “black boxes”, making it difficult to understand how decision are made. This can be a challenge in regulated industries where transparency is required.
- Customer Privacy: Handling sensitive customer data requires strict adherence to privacy laws and regulations, such as GDPR or CCPA.
Standard Answer: Ethical considerations, Data quanlity, Data drift
Task3: Query data from the web
Task Overview: How Technology Analysts at Citi work with a variety of different teams; The importance of having consistently fresh stock market data for Citi teams to make the right decisions.
Goal: Build an internal tool to assist employees in monitoring the stock market in real time using Java and an API.
Background
The importance of risk assessment in finance is not always enough to check risk just once. When it comes to the stock market, things are constantly changing. Need fresh data in oder to make most up-to-date decisions.
Build an internal tool to assist employees in monitoring the stock market in real time. The tool should be able to retrieve live stock data from a reliable source and store it in a database for easy access.
Task Instruction
Queries the Dow Jones Industrial Average stock price from Yahoo Finance every five seconds and stores the stock value and timestamp in a queue.
-
Installing the Gradle package manager.
-
Install an application programming interface (API) of your choice for querying stock prices.
-
Create a new folder for your application. Navigate to this folder in the terminal and run the command “gradle init” to create a new Java application. You’ll be prompted through a series of selections to generate your project. When asked about the type of project to generate, select “Application”, and for the implementation language, select “Java.” For all other prompts, we suggest the default option. For example, we created our application using the following responses:
a. Select type of project to generate: Application
b. Select implementation language: Java
c. Split functionality across multiple subprojects: No — Only one application project
d. Select build script DSL: GroovyGenerate build using new APIs and behavior (some features may change in the next minor release)? No
e. Select test framework: JUnit Jupiter
-
Locate the gradle.build file in your project. This will be found in the app directory, located in the root of your project. Update the gradle.build file to include the dependency for the Yahoo Finance API:
dependencies {
implementation group: 'com.yahoofinance-api', name: 'YahooFinanceAPI', version: '3.17.0'
}
- Locate the AppTest.java file in your project. This will be found in the directory app/src/test/java/project_name. Remove the default tests from the AppTest.java file so that your changes will compile.
- Locate the App.java file in your project. This will be found in the directory app/src/main/java/project_name. Update the App.java file to create an application that queries the Dow Jones Industrial Average stock price from Yahoo Finance every five seconds and stores the stock value and timestamp in a queue.
- Compile your application by running the command “gradle build”.
- Run your application by running the command “gradle run”.
- Test your application and debug as needed.
*Build the Java Project
任务讲解
这个任务要求创建一个Java应用程序,每5秒钟从Yahoo Finance查询Dow Jones Industrial Average(道琼斯工业平均指数,DJIA)的股票价格,并将股票值和时间戳存储在一个队列中。
涉及的软件和插件
- Gradle: 建构工具,用于管理项目依赖和构建过程。
- Yahoo Finance API (com.yahoofinance-api):一个Java库,允许从Yahoo Finance获取股票数据。
- JUnit Jupiter:一个测试框架,用于编写和运行测试用例。
Gradle的安装
- 下载Gradle安装包:官网连接或网盘下载。
使用Yahoo Finance API
- 添加依赖:在
build.gradle文件中添加implementation group: 'com.yahoofinance-api', name: 'YahooFinanceAPI', version: '3.17.0'。 - 导入类:在Java代码中导入
com.yahoofinance.YahooFinance等相关类。
使用JUnit Jupiter进行测试
- 创建测试类:在
src/test/java目录下创建测试类,类名以Test结尾。 - 编写测试方法:使用
@Test注解标记测试方法。 - 运行测试:在终端中运行
gradle test命令。
如何开始
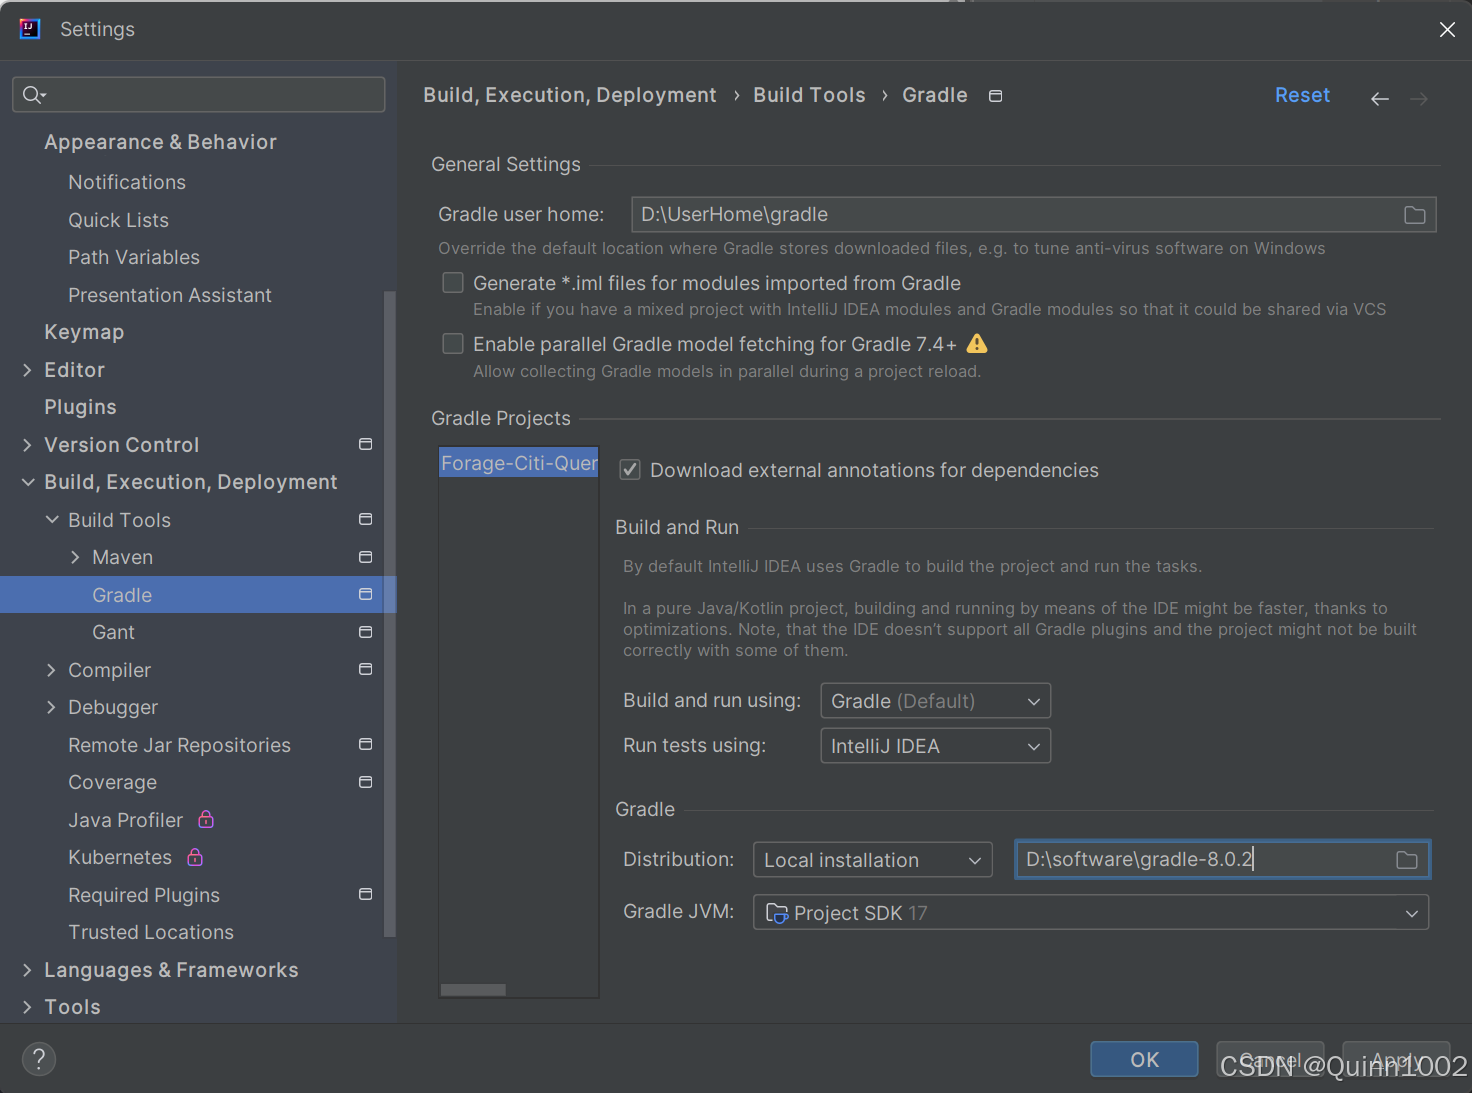
Step1: 安装Gradle并初始化Gradle项目
参考:Gradle安装与配置教程(Windows版) - 知乎
- 环境配置:复制
gradle-8.0.2路径,创建GRADLE_HOME系统变量,并在Path中添加%GRADLE_HOME%\bin - 验证Gradle是否安装成功:按Win和R键,输入
cmd打开命令提示行。输入gradle -v,如果有下面的版本说明Gradle环境变量配置成功。 - 配置下载源:由于Gradle自带Maven下载源是国外的,在后续下载依赖的过程中会比较慢。这里我们需要将下载源换成国内镜像。确保能够查看文件扩展名的情况下,进入init.d文件夹,需要新建一个
init.gradle文件。
allprojects {
    repositories {
        mavenLocal()
        maven { name "Alibaba" ; url "https://maven.aliyun.com/repository/public" }
        maven { name "Bstek" ; url "https://nexus.bsdn.org/content/groups/public/" }
        mavenCentral()
    }
    buildscript {
        repositories {
            maven { name "Alibaba" ; url 'https://maven.aliyun.com/repository/public' }
            maven { name "Bstek" ; url 'https://nexus.bsdn.org/content/groups/public/' }
            maven { name "M2" ; url 'https://plugins.gradle.org/m2/' }
        }
    }
}
- 使用Intellij IDEA创建Gradle项目(跟着上述连接进行操作即可)
- 使用JUnit4进行测试:在IDEA左侧目录打开
build.gradle文件,在dependencies中添加一条依赖:
dependencies {
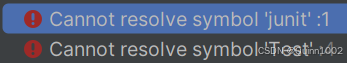
testImplementation 'junit:junit:4.12'
}
Error1:运行测试文件时报错,
Cannot resolve symbol 'junit'。
Reference:IDEA junit找不包的问题:Cannot resolve symbol ‘junit‘_cannot resolve symbol 'junit-CSDN博客
Step2: 配置built.gradle文件以加入Yahoo Finance API依赖
- 打开
build.gradle文件。 - 在
dependencies块中添加Yahoo Finance API依赖:
dependencies {
    implementation group: 'com.yahoofinance-api', name: 'YahooFinanceAPI', version: '3.17.0'
}
Step3: 编写主代码
YahooFinance用法参照如下:sstrickx/yahoofinance-api: Java Client API for Yahoo Finance
package com.example.app;

/**
 * @author Zhang
 * @className App
 * @time 2024/11/25 16:38
 * @description TODO
 */

// 导入必要的类
import yahoofinance.YahooFinance;
import yahoofinance.quotes.stock.StockQuote;
import yahoofinance.YahooFinance;

import java.util.LinkedList;
import java.util.Queue;
import java.util.concurrent.Executors;
import java.util.concurrent.ScheduledExecutorService;
import java.util.concurrent.TimeUnit;

public class App {
    public static void main(String[] args) {
        // 创建队列来储存股票值和时间戳
        Queue<PriceTimePair> queue = new LinkedList<>();
        ScheduledExecutorService scheduler = Executors.newScheduledThreadPool(1);
        scheduler.scheduleAtFixedRate(() -> {
            // 使用ScheduledExecutorService每5秒钟查询一次股票价格并存储到队列中
            try {
                StockQuote quote = YahooFinance.get("^DJI").getQuote();
                double price = quote.getPrice().doubleValue();
                long timestamp = System.currentTimeMillis();
                queue.add(new PriceTimePair(price, timestamp));
                System.out.println("Price: " + price + " Timestamp: " + timestamp);
            } catch (Exception e) {
                e.printStackTrace();
            }
        }, 0, 5, TimeUnit.SECONDS);

        // 保持主线程运行,直到程序结束
        while (true) {
            try {
                Thread.sleep(1000);
            } catch (InterruptedException e) {
                e.printStackTrace();
            }
        }
    }

    public static class PriceTimePair {
        private double price;
        private long timestamp;

        public PriceTimePair(double price, long timestamp) {
            this.price = price;
            this.timestamp = timestamp;
        }

        public double getPrice() {
            return price;
        }

        public long getTimestamp() {
            return timestamp;
        }
    }
}
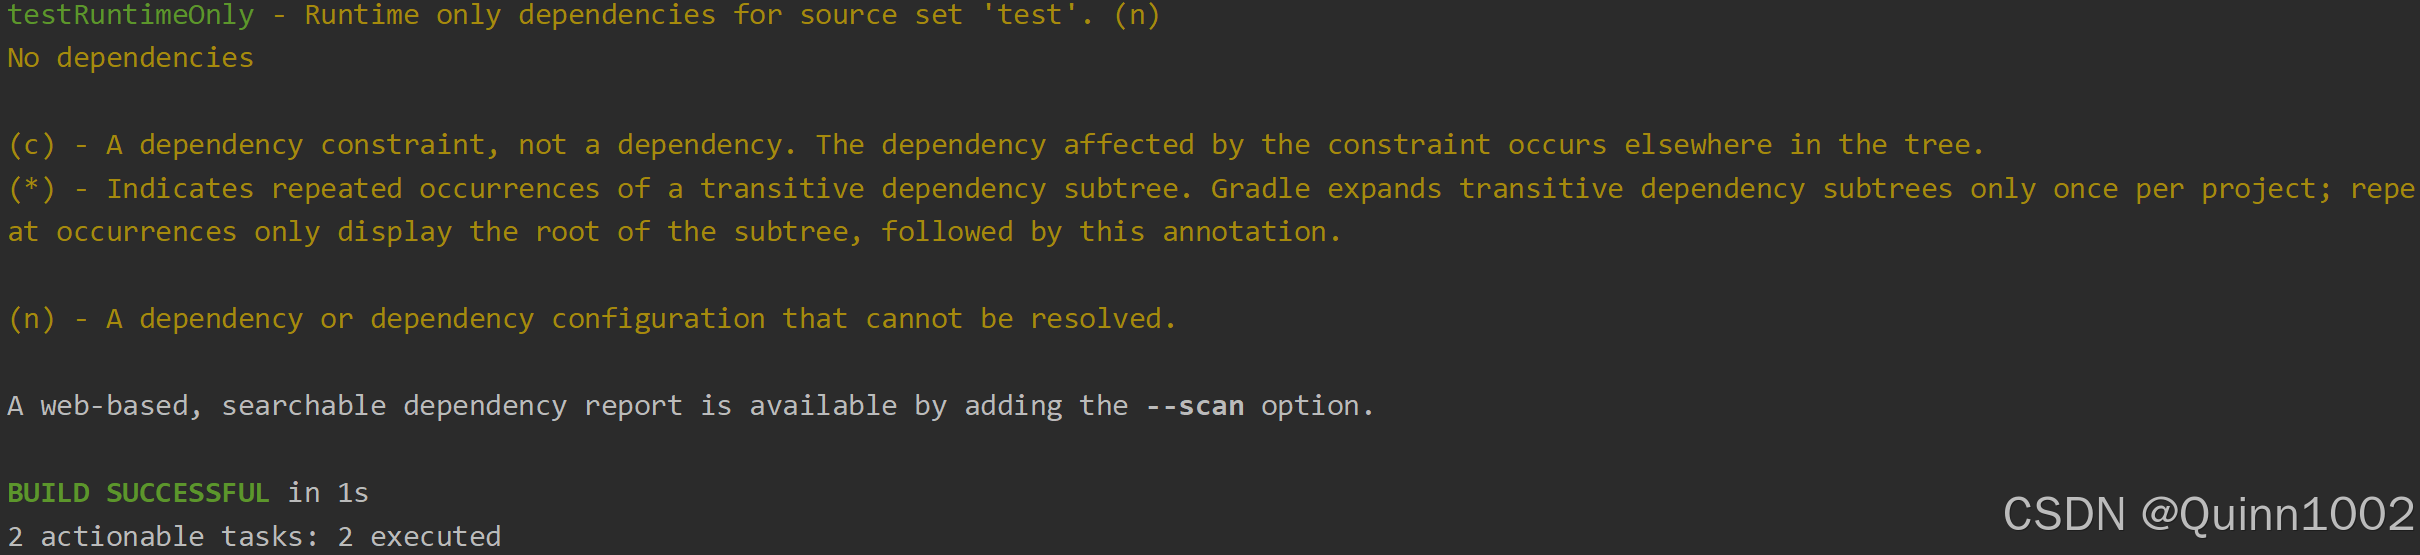
Error2:无法解析
com.yahoofinance-api。Solution: 手动在Maven中央仓库下载相应的jar包,放到libs文件夹下并导入,输入
./gradlew clean denpendencies后,build成功。并且在导入时需要使用:import yahoofinance而不是import com.yahoofinance。
最终的build.gradle文件
plugins {
    id 'java'
}

group = 'org.example'
version = '1.0-SNAPSHOT'

repositories {
    mavenCentral()
    maven { url 'https://jitpack.io' }
}

dependencies {
    testImplementation platform('org.junit:junit-bom:5.9.1')
    testImplementation 'org.junit.jupiter:junit-jupiter'
    testImplementation 'junit:junit:4.12'
    implementation files('libs/YahooFinanceAPI-3.17.0.jar')
    implementation 'org.slf4j:slf4j-api:1.7.30'
    implementation 'ch.qos.logback:logback-classic:1.2.3'
    implementation 'com.fasterxml.jackson.core:jackson-core:2.14.0'
    implementation 'com.fasterxml.jackson.core:jackson-annotations:2.14.0'
    implementation 'com.fasterxml.jackson.core:jackson-databind:2.14.0'
}

test {
    useJUnitPlatform()
}
// 参考答案
package citi;

import java.io.IOException;
import java.math.BigDecimal;
import java.util.ArrayList;
import java.util.Date;
import java.util.LinkedList;
import java.util.Queue;

import yahoofinance.YahooFinance;
import yahoofinance.Stock;


public class App {

    // The URL for the API
    private static final String YAHOO_FINANCE_API = "https://finance.yahoo.com/quote/";

    public static void main(String[] args) {

        // Stock symbol for the Dow Jones Industrial Average
        String symbol = "^DJI";
        // Wait time in milliseconds between queries
        int waitTimeMs = 5000;
        // Queue for containing timestamps and stock price
        Queue<ArrayList<Object>> stockDataQueue = new LinkedList<>();

        // This is the loop for querying data
        while (true) {

            // Try to query the stock information
            try {
                Stock stock = YahooFinance.get(symbol);
                // Get the current stock price
                BigDecimal price = stock.getQuote().getPrice();
                // Record the timestamp for the query
                Date timestamp = new Date();

                // Add the stockData to the queue, in the form (timestamp, price)
                ArrayList<Object> stockData = new ArrayList<Object>();
                stockData.add(timestamp);
                stockData.add(price);
                stockDataQueue.add(stockData);

                // Print the stockData
                System.out.println(stockData);

            }

            // Catch exception if there is a connection error
            catch(IOException e) {
                System.out.println("Failure to connect. Trying again.");
            }

            // Wait before repeating the query
            try {
                Thread.sleep(waitTimeMs);
            } catch (InterruptedException e) {
                e.printStackTrace();
            }
        }
    }
}
由于Yahoo不再对中国大陆提供服务,所以网络连接失败,将无法访问其上数据。

Task4: Visualize live data
Task Overview: The importance of making data tools accessible for nontechnical employees at Citi; How to use visual aids like dashboards to help the team monitor risk in real-time.
Goal: Update your application from Task 3 to display a line graph of recorded stock prices.
Background
Make this application more accessible to the nontechnical employees at the company. Create a line graph that contains a time tick on the x-axis and the stock price on the y-axis. This plot should update each time your application queries a stock price. On refresh, it should display all the currently stored stock prices.
Task Instruction
- Update the gradle.build file in your package as described in the resource link “Getting Started with JavaFX using Gradle”.
- pdate the App.java file for your existing application to add a feature that displays a line graph every time Yahoo Finance is queried. This line graph should have a time tick on the x-axis and the stock price on the y-axis. This plot should update each time your application queries a stock price. On refresh, it should display all the currently stored stock prices.
*Build the Java Project
任务讲解
使用JavaFX来显示一个折线图,要求每次查询雅虎财经数据时更新,x轴是时间,y轴是股票价格,并且在刷新时显示所有储存的股票价格。
如何开始
Step1: build.gradle文件
在 build.gradle 文件中添加JavaFX依赖和配置插件:
plugins {
    id 'application'
    id 'org.openjfx.javafxplugin' version '0.1.0'
}

group = 'org.openjfx'
version = '1.0-SNAPSHOT'

repositories {
    mavenCentral()
    maven { url 'https://jitpack.io' }
}

javafx {
    version = '17'
    modules = ['javafx.controls', 'javafx.fxml']
}

dependencies {
    testImplementation platform('org.junit:junit-bom:5.9.1')
    testImplementation 'org.junit.jupiter:junit-jupiter'
    testImplementation 'junit:junit:4.12'
    implementation files('libs/YahooFinanceAPI-3.17.0.jar')
    implementation 'org.slf4j:slf4j-api:1.7.30'
    implementation 'ch.qos.logback:logback-classic:1.2.3'
    implementation 'com.fasterxml.jackson.core:jackson-core:2.14.0'
    implementation 'com.fasterxml.jackson.core:jackson-annotations:2.14.0'
    implementation 'com.fasterxml.jackson.core:jackson-databind:2.14.0'
    implementation 'org.openjfx:javafx-controls:17'
    implementation 'org.openjfx:javafx-fxml:17'
}

test {
    useJUnitPlatform()
}

application {
    mainClass = 'com.example.app.App';
}
Step2: 修改App.java文件
将 App.java 修改为继承自 javafx.application.Application,并在 start 方法中创建和更新折线图: [App.java](task2 Query data from the web\Forage-Citi-QueryDataFromWeb-Gradle\src\main\java\com\example\app\App.java)
package com.example.app;

/**
 * @author Zhang
 * @className App
 * @time 2024/11/25 16:38
 * @description TODO
 */

// 导入必要的类
import javafx.application.Platform;
import yahoofinance.YahooFinance;
import yahoofinance.quotes.stock.StockQuote;

import java.util.Date;
import java.util.LinkedList;
import java.util.Queue;
import java.util.concurrent.Executors;
import java.util.concurrent.ScheduledExecutorService;
import java.util.concurrent.TimeUnit;

import javafx.application.Application;
import javafx.scene.Scene;
import javafx.scene.chart.LineChart;
import javafx.scene.chart.NumberAxis;
import javafx.scene.chart.XYChart;
import javafx.scene.chart.XYChart.Data;
import javafx.stage.Stage;

// Step 1: Create a JavaFX application.
public class App extends Application {
    private LineChart<Number, Number> lineChart;
    private XYChart.Series<Number, Number> series;

    @Override
    public void start(Stage stage) {
        // Initialize the line chart.
        NumberAxis xAxis = new NumberAxis();
        xAxis.setLabel("Time");
        NumberAxis yAxis = new NumberAxis();
        yAxis.setLabel("Price");
        lineChart = new LineChart<>(xAxis, yAxis);
        lineChart.setTitle("Stock Price Chart");

        series = new XYChart.Series<>();
        series.setName("Stock Price");
        lineChart.getData().add(series);

        Scene scene = new Scene(lineChart, 800, 600);
        stage.setScene(scene);
        stage.show();

        runScheduledTask();
    }

    // Step 2: Create a ScheduledExecutorService to fetch stock prices.
    public void runScheduledTask() {
        // Create a Queue to store the stock prices.
        Queue<PriceTimePair> queue = new LinkedList<>();

        // Create a ScheduledExecutorService to fetch stock prices every 5 seconds.
        ScheduledExecutorService scheduledExecutorService = Executors.newScheduledThreadPool(1);
        scheduledExecutorService.scheduleAtFixedRate(() -> {
            try {
                // Fetch the stock price.
                StockQuote stockQuote = YahooFinance.get("^DJI").getQuote();
                double price = stockQuote.getPrice().doubleValue();
                Date timestamp = new Date();
                queue.add(new PriceTimePair(price, timestamp));
                System.out.println("Price: " + price + " Timestamp: " + timestamp);

                // Update the line chart.
                Platform.runLater(() -> updateLineChart(queue));
            } catch (Exception e) {
                e.printStackTrace();
            }
        }, 0, 5, TimeUnit.SECONDS);
    }

    // Step 3: Update the line chart with the latest stock price.
    private void updateLineChart(Queue<PriceTimePair> queue) {
        while (!queue.isEmpty()) {
            PriceTimePair priceTimePair = queue.poll();
            series.getData().add(new Data<>(priceTimePair.getTimestamp().getTime(), priceTimePair.getPrice()));
        }
        // Limit the number of data points to 100.
        while (series.getData().size() > 100) {
            series.getData().remove(0);
        }
    }

    // Step 4: Create a class to store the stock price and timestamp.
    private static class PriceTimePair {
        private double price;
        private Date timestamp;
        public PriceTimePair(double price, Date timestamp) {
            this.price = price;
            this.timestamp = timestamp;
        }
        public double getPrice() {
            return price;
        }
        public Date getTimestamp() {
            return timestamp;
        }
    }

    public static void main(String[] args) {
        launch(args);
    }
}
修改后无法运行,显示“Execution failed for task ':ExampleApp.main()'. Process 'command 'D:\Java\jdk17\bin\java.exe'' finished with non-zero exit value 1”。找了很多方案没有解决,下载了参考答案依旧有这个问题...
// 参考答案
package com.example.app;

import java.io.IOException;
import java.math.BigDecimal;
import java.time.Instant;
import java.util.ArrayList;
import java.util.Date;
import java.util.LinkedList;
import java.util.Queue;

import javafx.application.Application;
import javafx.scene.chart.LineChart;
import javafx.scene.chart.NumberAxis;
import javafx.scene.chart.XYChart;
import javafx.scene.Scene;
import javafx.stage.Stage;

import yahoofinance.YahooFinance;
import yahoofinance.Stock;


public class ExampleApp extends Application {
    // The URL for the API
    private static final String YAHOO_FINANCE_API = "https://finance.yahoo.com/quote/";
    // Stock symbol for the Dow Jones Industrial Average
    private String symbol = "^DJI";
    // Wait time in milliseconds between queries
    private int waitTimeMs = 1000;

    private LineChart<Number, Number> lineChart;
    private XYChart.Series<Number, Number> series;

    @Override
    public void start(Stage stage) {
        stage.setTitle("Dow Jones Industrial Average");
        final NumberAxis xAxis = new NumberAxis();
        final NumberAxis yAxis = new NumberAxis();
        xAxis.setLabel("Time (seconds)");
        yAxis.setLabel("Stock Price (USD)");
        lineChart = new LineChart<>(xAxis, yAxis);
        lineChart.setTitle("Dow Jones Industrial Average Stock Price");
        series = new XYChart.Series<>();
        //series.setName("Line");
        lineChart.getData().add(series);
        Scene scene = new Scene(lineChart, 800, 600);
        stage.setScene(scene);
        stage.show();

        // Start a background thread for querying and updating the chart data
        new Thread(this::updateData).start();
    }

    private void updateData() {
        // Queue for containing timestamps and stock price
        Queue<ArrayList<Object>> stockDataQueue = new LinkedList<>();
        long startSeconds = Instant.now().getEpochSecond();

        // This is the loop for querying data
        while (true) {

            // Try to query the stock information
            try {
                Stock stock = YahooFinance.get(symbol);
                // Get the current stock price
                BigDecimal price = stock.getQuote().getPrice();
                // Record the timestamp for the query
                Date timestamp = new Date();
                long currSeconds = Instant.now().getEpochSecond();


                // Add the stockData to the queue, in the form (timestamp, price)
                ArrayList<Object> stockData = new ArrayList<Object>();
                stockData.add(timestamp);
                stockData.add(price);
                stockDataQueue.add(stockData);

                // Print the stockData
                System.out.println(stockData);

                //Update the chart data
                long secSinceStart = currSeconds - startSeconds;
                series.getData().add(new XYChart.Data(secSinceStart, price));

                // Update the chart on the JavaFX Application Thread
                lineChart.getData().retainAll();
                lineChart.getData().add(series);
            }

            // Catch exception if there is a connection error
            catch(IOException e) {
                System.out.println("Failure to connect. Trying again.");
            }

            // Wait before repeating the query
            try {
                Thread.sleep(waitTimeMs);
            } catch (InterruptedException e) {
                e.printStackTrace();
            }

        }
    }

    public static void main(String[] args) {
        launch(args);
    }
}


 被折叠的 条评论
为什么被折叠?
被折叠的 条评论
为什么被折叠?
 到【灌水乐园】发言


