Web开发系列 - Web Chart
Posted on 2009-07-27 11:49 peterzb 阅读(2606) 评论(0) 编辑 收藏 所属分类: VB/VB.NET, Java, ASP.NET
整理一些可以在Web开发中使用的图表控件, 主要为客户端实现方式, 如Flash, JavaScript, Silverlight; 如果是GDI+方式生成统计图表可以看我前几天整理的另外一篇博文
C# WinForm开发系列 - Chart Controls .


I hope you enjoyed reading this article. You may subscribe to my RSS Feed, scroll down to leave a comment, or get back to the homepage.
Site Tour Creator
List of Ajax form Validators
Rounded Borders in CSS without Images
Great Accordion Scripts
蛙蛙推荐:利用OWC创建图表的完美解决方案


另外附上C# WinForm开发系列相关文章如下:

野路子实现的轻量级伪OLAP展示(FusionCharts)


10 Free Chart Scripts 转载自 S.Sams 博文
This week I’ve been working on a project that required data to be shown visually. I needed a Chart Script that was attractive yet gets the data across. The Charts scripts below are built using JavaScript, Flash, Silverlight, and Java.
- Flot - Flot is a pure Javascript plotting library for jQuery. The focus is on easy usage , attractive plots and interactive features. With Flot you can interact with the data, look at specific data by zooming in, plot a time series, and other various options.

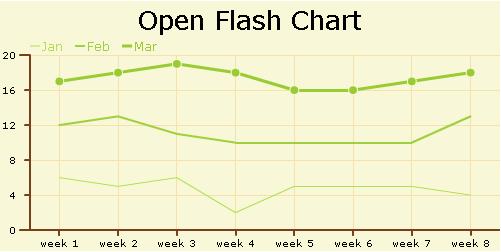
- Open Flash Chart - Open Flash Chart is a Flash charting component. It is fairly easy to setup and has classes written in PHP, Perl, Python, Java, Ruby on Rails, and .Net to connect to the Chart. You can create some really nice looking Bar Charts, Pie Charts, Area Charts and etc…

- AmCharts - AmCharts are animated interactive flash charts. The charts include Pie Charts, Line Charts, Scatter/Bubble Charts, Bar/Column Charts, and even a stock chart. AmCharts can extract data from simple CSV or XML files, or they can read dynamic data generated with PHP, .NET, Java, Ruby on Rails, Perl and ColdFusion. All the charts are free but they have a link to AmCharts on the upper left.

- Emprise JavaScript Charts - Emprise JavaScript Charts is a 100% Pure JavaScript Charting Solution that requires no JavaScript frameworks. Emprise JavaScript Charts include Line, Area, Scatter, Pie, Bar charts with zooming, scaling and scrolling ability. Tested and works with all major browsers.

- PlotKit - PlotKit is a Chart and Graph Plotting Library for Javascript. PlotKit works with MochiKit javascript library. It has support for HTML Canvas and also SVG via Adobe SVG Viewer and native browser support. PlotKit also has great documentation.

- Flotr - Flotr is a javascript plotting library based on the Prototype Framework version 1.6.0.2. Flotr lets you create graphs in modern browsers with features like legend support, negative value support, mouse tracking, selection support, zoom support, event hooks, CSS styling support and much more.

- PHP/SWF Charts - PHP/SWF Charts is simple yet powerful tool to create attractive web charts and graphs from dynamic data. You use PHP to gather the data and put it into flash. It supports many charts types, Line, Column, Stacked column, Floating column, 3D column, Stacked 3D column, Parallel 3D column, Pie, 3D Pie, Bar, Stacked bar, Floating bar, Area, Stacked area, Candlestick, Scatter, Polar, Mixed, Composite and Joined. These Charts have some great features like Animated transitions, Printable charts, and more.

- Visifire - Visifire (Powered by Silverlight) is a set of open source data visualization components. With Visifire you can create animated Silverlight Charts with ASP, ASP.Net, PHP, JSP, ColdFusion, Ruby on Rails or just simple HTML.

- FusionCharts - FusionCharts is a cross-browser and cross-platform flash charting component that can be used with ASP.NET, ASP, PHP, JSP, ColdFusion, Ruby on Rails, simple HTML pages or even PowerPoint Presentations. All you need to know is the language you’re programming in.

- JFreeChart - JFreeChart is an open source Java chart library that makes it easy for developers to display quality charts in their applications. The JFreeChart project was founded seven years ago, in February 2000, by David Gilbert and is used by approximately 40,000 to 50,000 developers. JFreeChart supports many different output types that includes JPEG, GIF, PDF, EPS and SVG. This is a great resource for Java developers.

If you know of any other Charting Scripts please post below.
Popularity: 37%
I hope you enjoyed reading this article. You may subscribe to my RSS Feed, scroll down to leave a comment, or get back to the homepage.
Related Posts
Free Flash Charting ComponentSite Tour Creator
List of Ajax form Validators
Rounded Borders in CSS without Images
Great Accordion Scripts
-- S.Sams Lifexperience!
蛙蛙推荐:利用OWC创建图表的完美解决方案


Business Objects中的Crystal Xcelsius

另外附上C# WinForm开发系列相关文章如下:
作者:peterzb(个人开发历程知识库 - 博客园)
出处:http://peterzb.cnblogs.com/
文章版权归本人所有,欢迎转载,但未经作者同意必须保留此段声明,且在文章页面明显位置给出原文连接,否则保留追究法律责任的权利。


 2827
2827


 被折叠的 条评论
为什么被折叠?


