


[root@server1 ~]# yum install elasticsearch-2.3.3.rpm -y
[root@server1 ~]# rpm -ivh jdk-8u121-linux-x64.rpm
[root@server1 ~]# cd /etc/elasticsearch/
[root@server1 elasticsearch]# vim elasticsearch.yml
17 cluster.name: my-es
23 node.name: server1
33 path.data: /var/lib/elasticsearch
37 path.logs: /var/log/elasticsearch
43 bootstrap.mlockall: true
54 network.host: 172.25.40.1
58 http.port: 9200
[root@server1 elasticsearch]# /etc/init.d/elasticsearch start查看端口
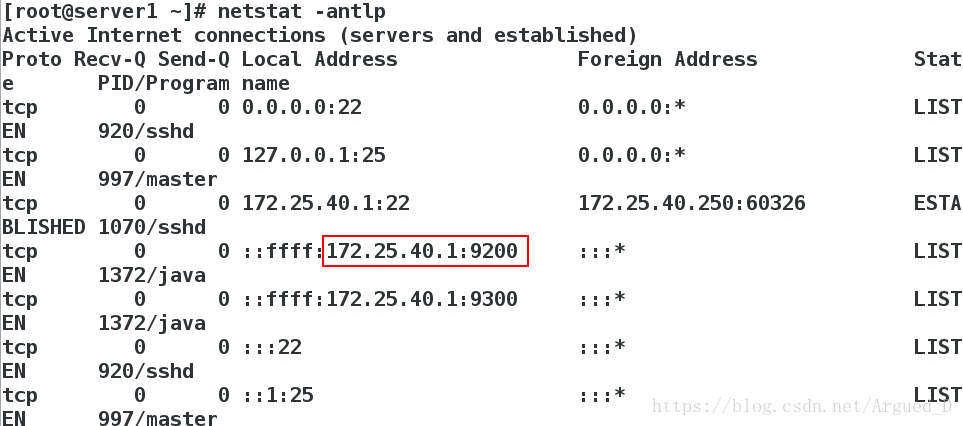
安装head插件
这里必须使用 url 的方式进行安装,如果文件在本地,我们也需要使用 file:// 的方式指定路径
[root@server1 ~]# /usr/share/elasticsearch/bin/plugin  install file:/root/elasticsearch-head-master.zip
[root@server1 ~]# /usr/share/elasticsearch/bin/plugin  list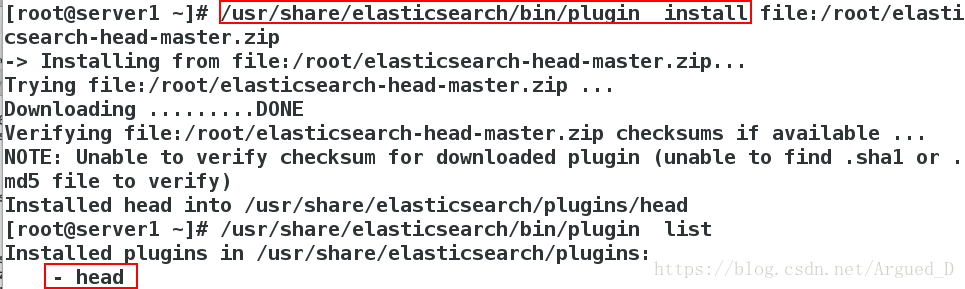
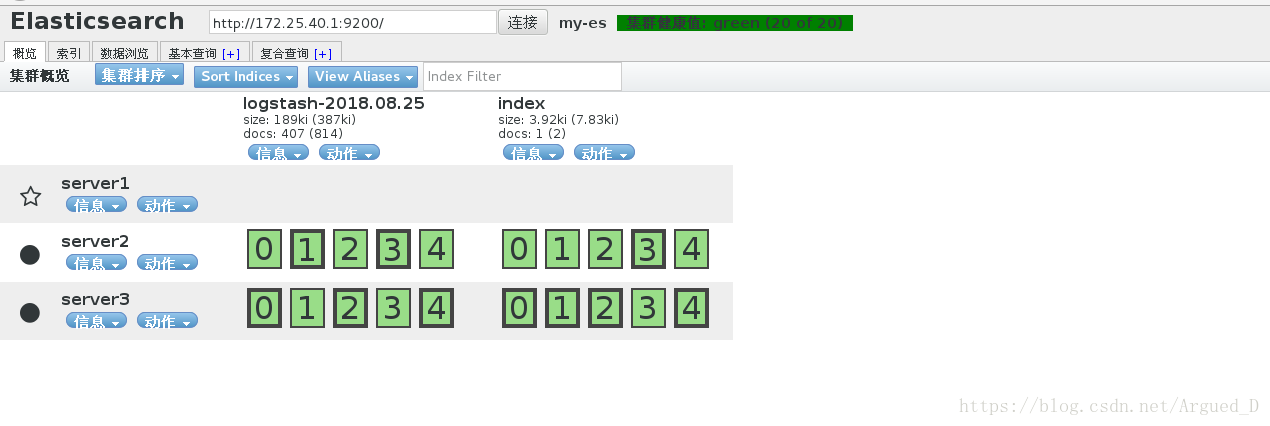
网页访问http://172.25.40.1:9200/_plugin/head/
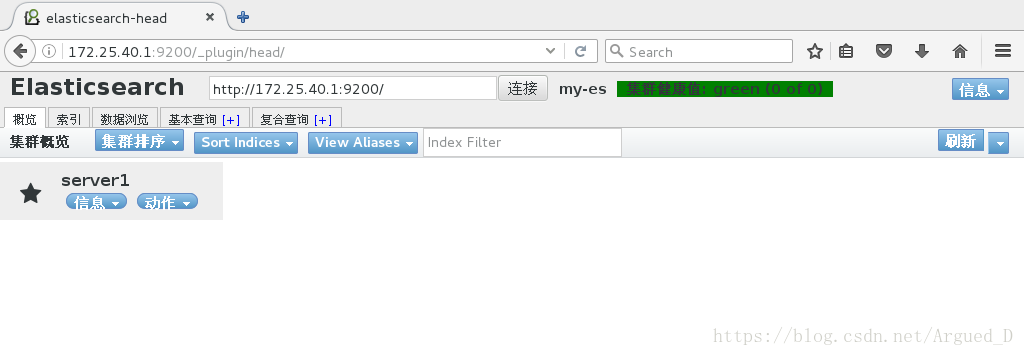
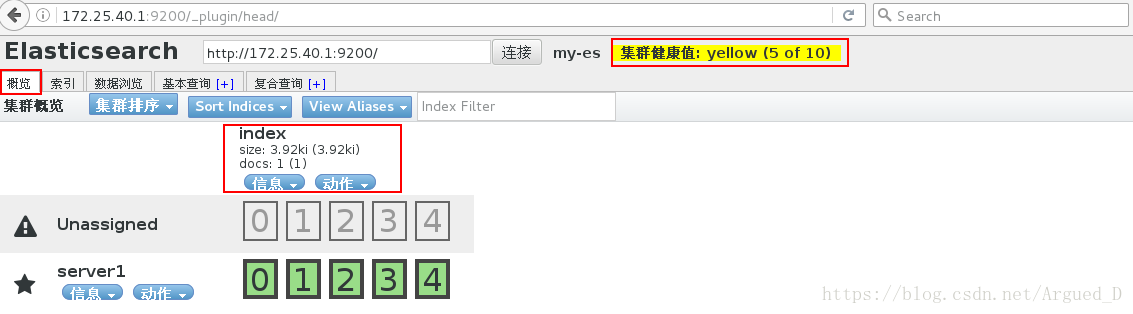
创建节点
[root@server1 ~]# scp elasticsearch-2.3.3.rpm jdk-8u121-linux-x64.rpm server2:
[root@server1 ~]# scp elasticsearch-2.3.3.rpm jdk-8u121-linux-x64.rpm server3:
[root@server1 ~]# cd /etc/elasticsearch/
[root@server1 elasticsearch]# vim elasticsearch.yml
 68 discovery.zen.ping.unicast.hosts: ["server1", "server2","server3"]
[root@server1 elasticsearch]# /etc/init.d/elasticsearch reload
[root@server1 elasticsearch]# scp elasticsearch.yml server2:/etc/elasticsearch
[root@server1 elasticsearch]# scp elasticsearch.yml server3:/etc/elasticsearch
【server2】
[root@server2 ~]# yum install -y elasticsearch-2.3.3.rpm
[root@server2 ~]# rpm -ivh jdk-8u121-linux-x64.rpm
[root@server2 ~]# cd /etc/elasticsearch/
[root@server2 elasticsearch]# vim elasticsearch.yml
 23 node.name: server2
 54 network.host: 172.25.40.2
[root@server2 elasticsearch]# /etc/init.d/elasticsearch start
【server3】
[root@server3 ~]# yum install -y elasticsearch-2.3.3.rpm
[root@server3 ~]# rpm -ivh jdk-8u121-linux-x64.rpm
[root@server3 ~]# cd /etc/elasticsearch/
[root@server3 elasticsearch]# vim elasticsearch.yml
23 node.name: server3
54 network.host: 172.25.40.3
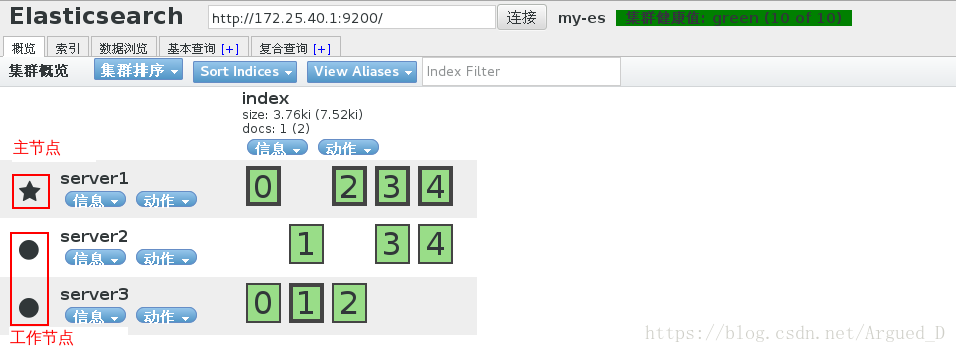
[root@server3 elasticsearch]# /etc/init.d/elasticsearch start刷新网页查看节点
[root@server1 elasticsearch]# vim elasticsearch.yml
 25 node.master: true
 26 node.data: false
 27 http.enabled: true
[root@server1 elasticsearch]# /etc/init.d/elasticsearch reload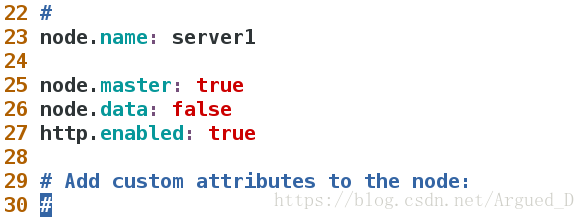
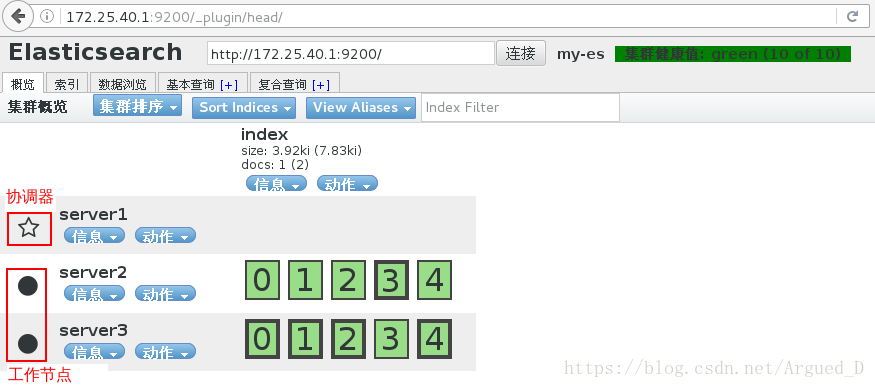
在【server2】和【server3】上添加信息
[root@server2 elasticsearch]# vim elasticsearch.yml
 25 node.master: false
 26 node.data: true
 27 http.enabled: true
[root@server2 elasticsearch]# /etc/init.d/elasticsearch reload
反复刷新网页查看节点
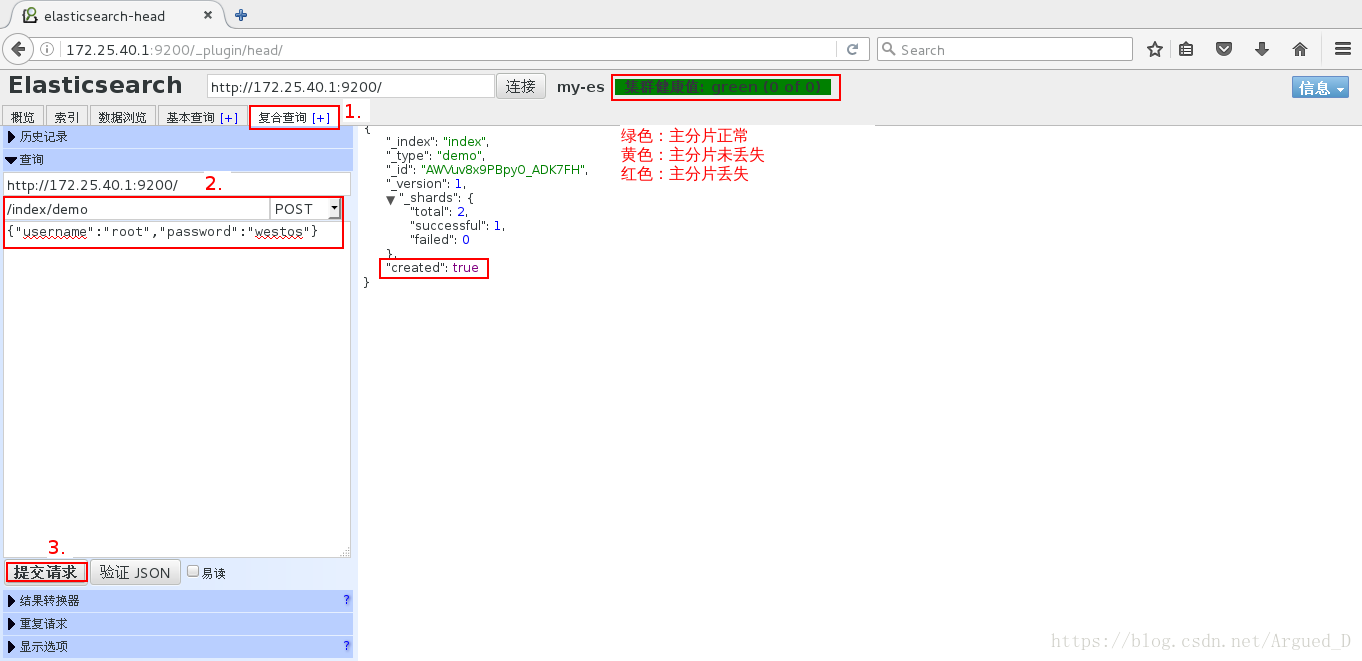
RESTful API 调用
查看健康状态
[root@server1 elasticsearch]# curl -XGET 'http://172.25.40.1:9200/_cluster/health?pretty=true'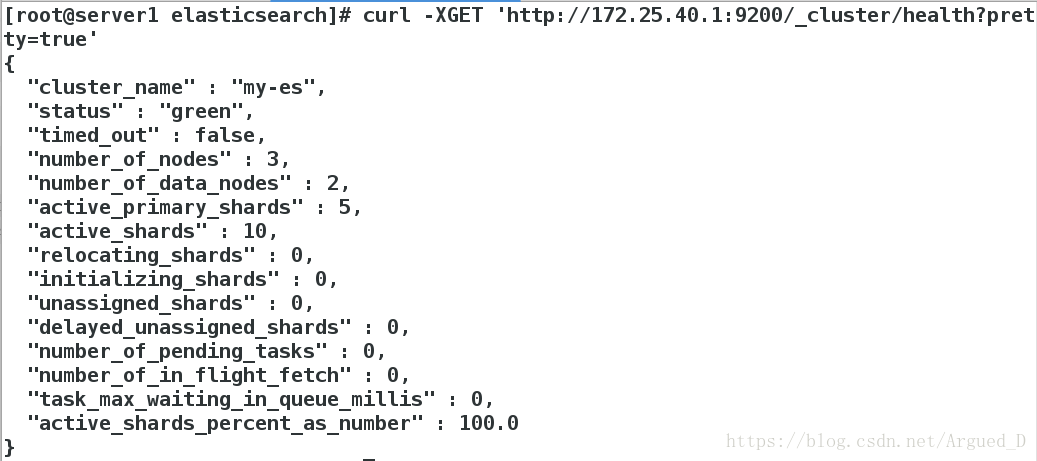
[root@server1 elasticsearch]# curl 172.25.40.1:9200/_nodes/stats/process?pretty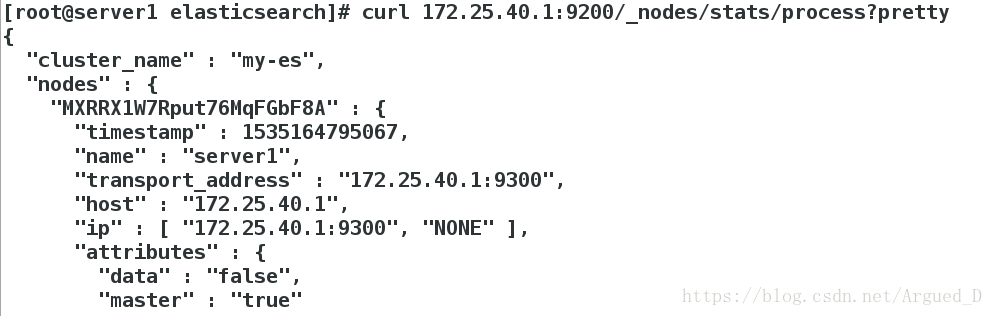
Logstash安装配置
[root@server1 ~]# rpm -ivh logstash-2.3.3-1.noarch.rpm数据测试:
1.基本的输入输出
[root@server1 ~]# /opt/logstash/bin/logstash -e 'input { stdin{ } } output { stdout{} }'
Settings: Default pipeline workers: 1
Pipeline main started
westos
2018-08-25T02:46:37.125Z server1 westos
hello westos
2018-08-25T02:46:43.372Z server1 hello westos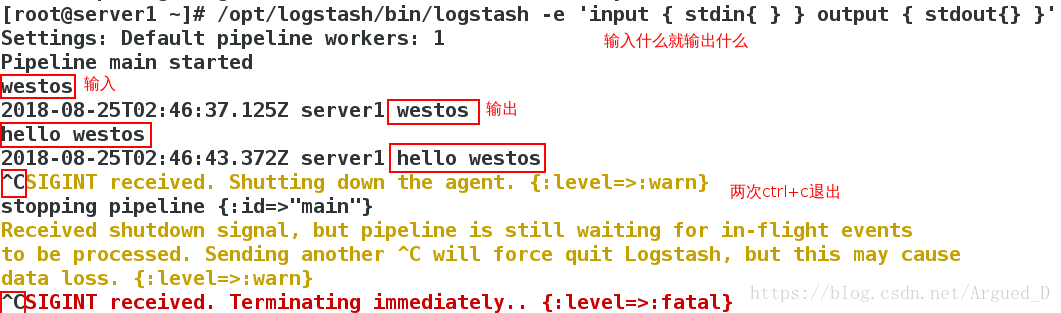
2 使用rubydebug详细输出
[root@server1 ~]# /opt/logstash/bin/logstash -e 'input { stdin{} } output { stdout{ codec => rubydebug} }'
Settings: Default pipeline workers: 1
Pipeline main started
hello
{
       "message" => "hello",
      "@version" => "1",
    "@timestamp" => "2018-08-25T02:50:45.647Z",
          "host" => "server1"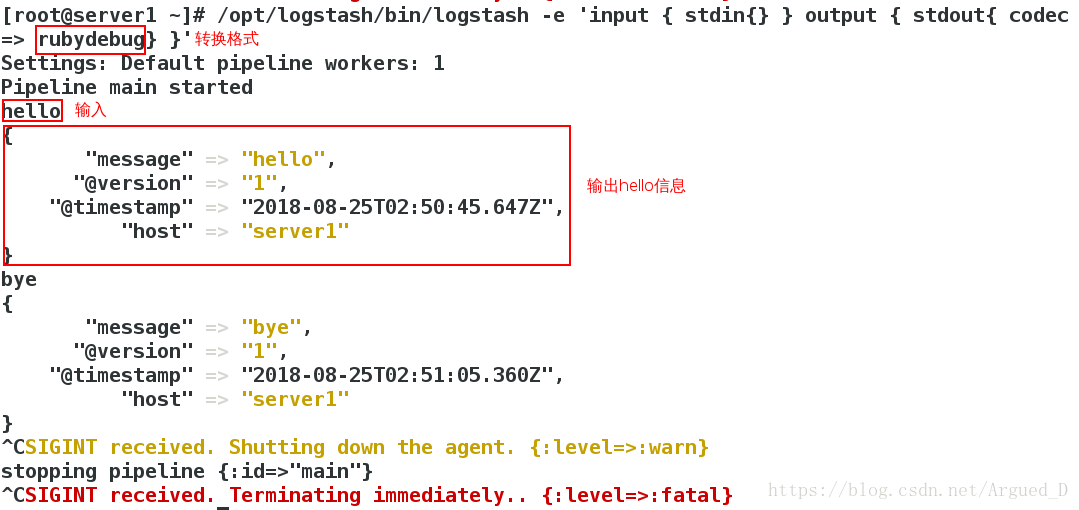
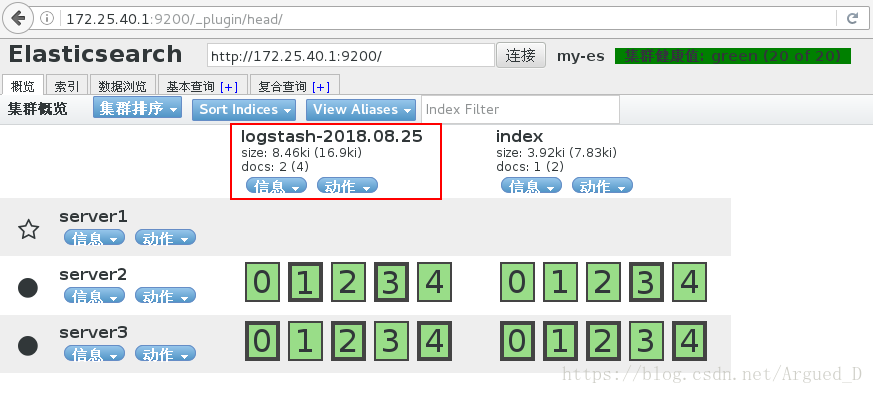
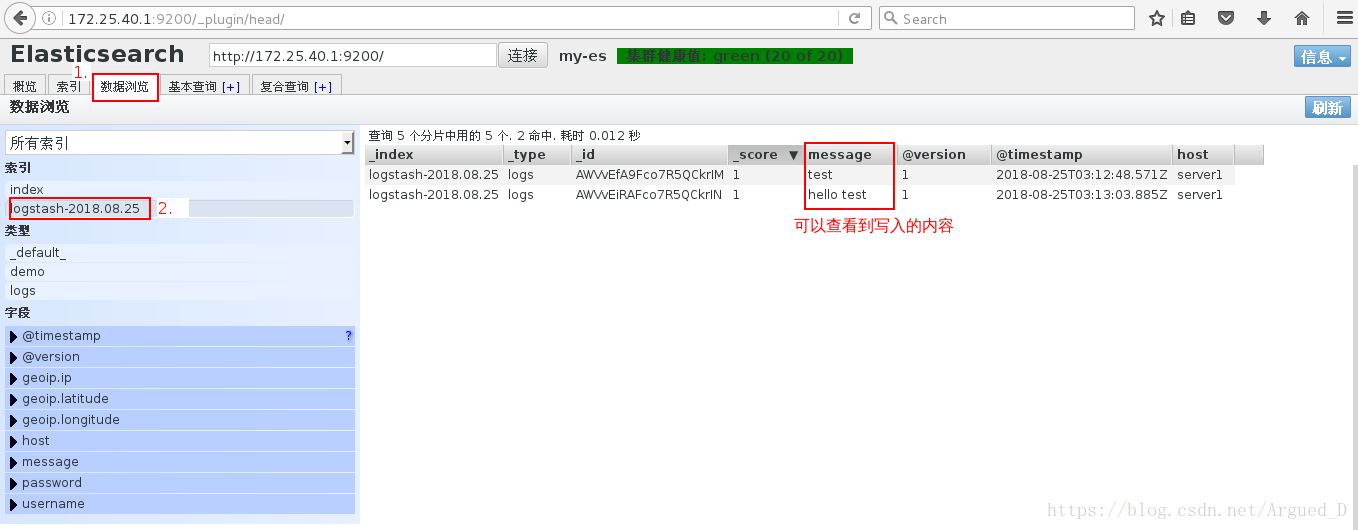
3 把内容写到elasticsearch中
[root@server1 ~]# /opt/logstash/bin/logstash -e 'input { stdin{} } output { elasticsearch { hosts => ["172.25.40.1"] index => "logstash-%{+YYYY.MM.dd}" } stdout { codec => rubydebug } }'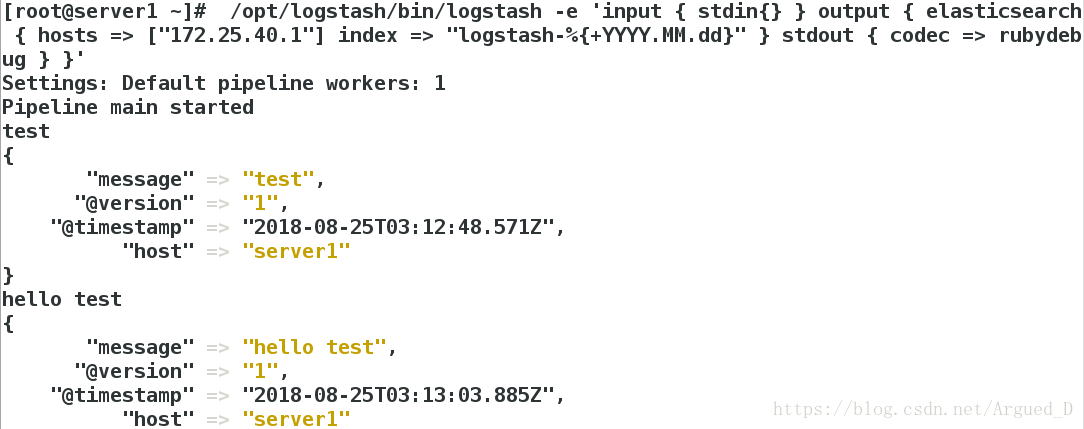
logstash的配置和文件的编写
logstash的配置
[root@server1 ~]# cd /etc/logstash/conf.d/
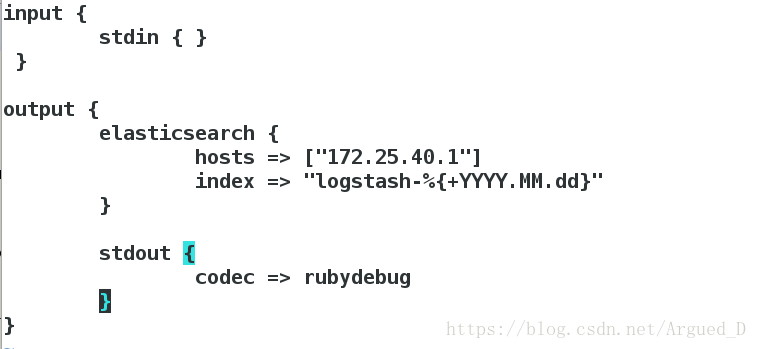
[root@server1 conf.d]# vim es.conf
input {
stdin { }
}
output {
elasticsearch {
hosts => ["172.25.40.1"]
index => "logstash-%{+YYYY.MM.dd}"
}
stdout {
codec => rubydebug
}
}
执行文件
[root@server1 conf.d]# /opt/logstash/bin/logstash -f /etc/logstash/conf.d/es.conf 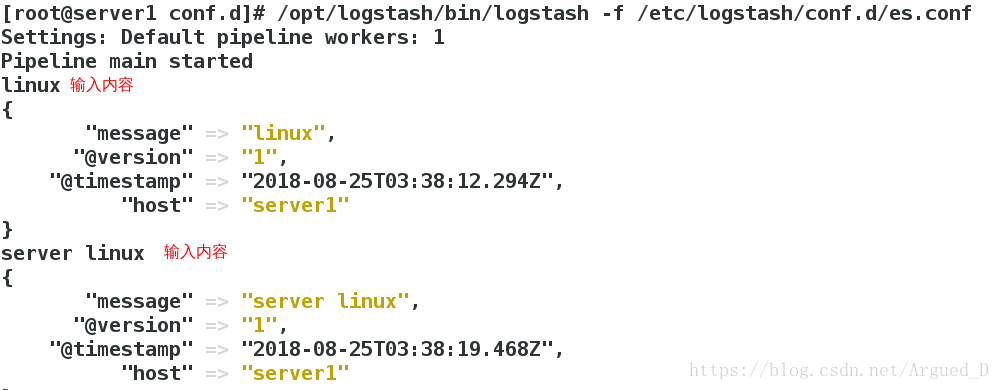
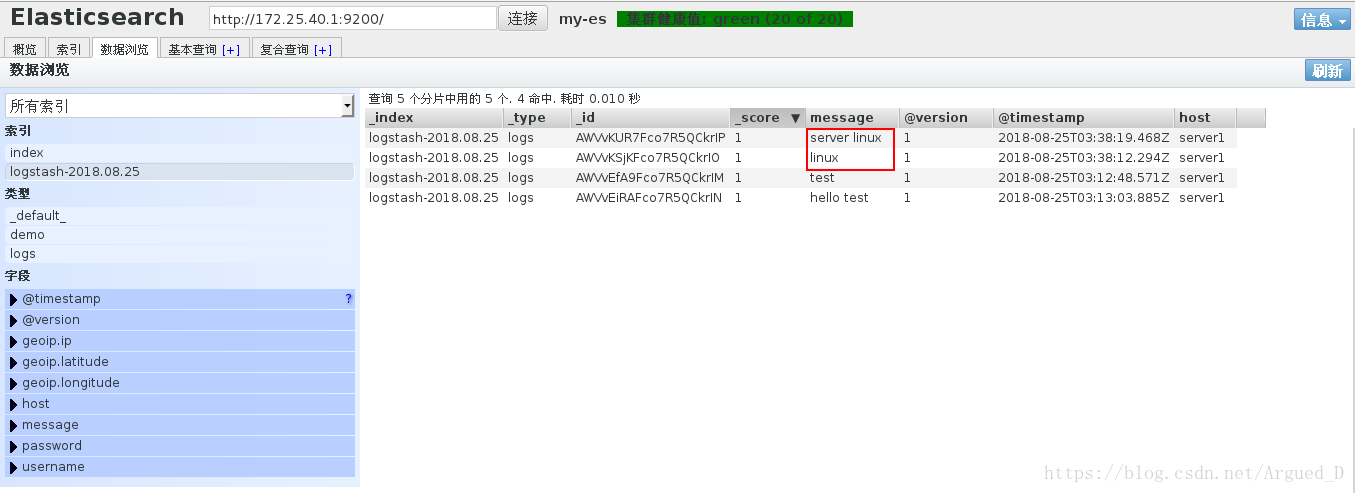
写入内容写入elasticsearch中并且在文件里也有内容
[root@server1 conf.d]# vim es.conf
input {
        stdin { }
 }

output {
        elasticsearch {
                hosts => ["172.25.40.1"]
                index => "logstash-%{+YYYY.MM.dd}"
        }

        stdout {
                codec => rubydebug
        }
        file {
                path => "/tmp/testfile"
                codec => line {format => "custom format: %{message}"}
}[root@server1 conf.d]# /opt/logstash/bin/logstash -f /etc/logstash/conf.d/es.conf 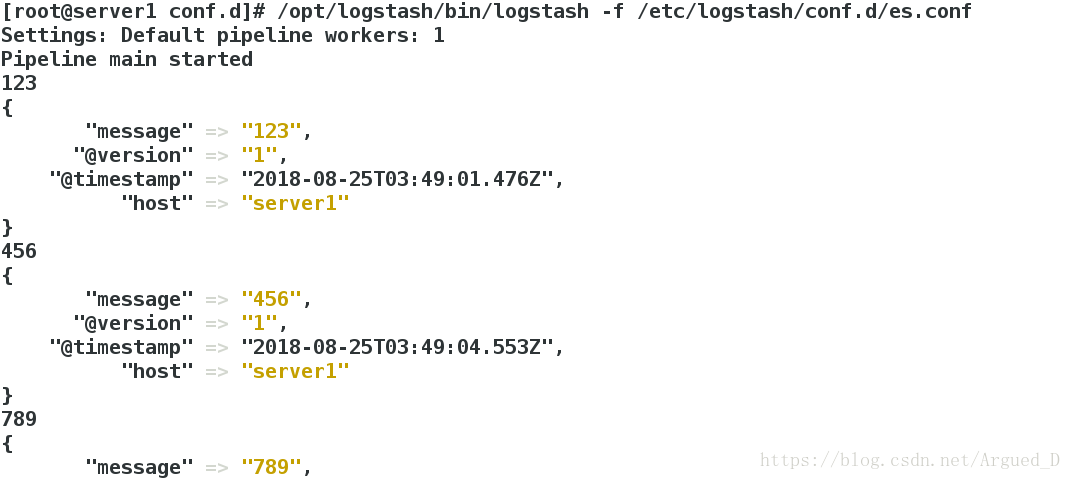
查看文件写入内容
[root@server1 conf.d]# cd /tmp
[root@server1 tmp]# ls
[root@server1 tmp]# cat testfile 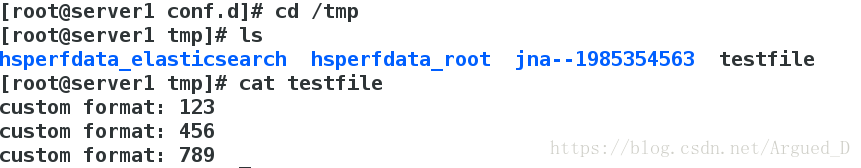
2 收集系统日志
[root@server1 conf.d]# vim es.conf
input {
        file{
                path => "/var/log/messages"
        }
 }

output {
        elasticsearch {
                hosts => ["172.25.40.1"]
                index => "logstash-%{+YYYY.MM.dd}"
        }
}[root@server1 ~]# cd /etc/logstash/conf.d/
[root@server1 conf.d]# cp es.conf message.conf
[root@server1 conf.d]# vim message.conf
input {
file{
path => "/var/log/messages"
start_position => "beginning"
}
}
output {
elasticsearch {
hosts => ["172.25.40.1"]
index => "logstash-%{+YYYY.MM.dd}"
}
stdout {
codec => rubydebug
}
}执行文件
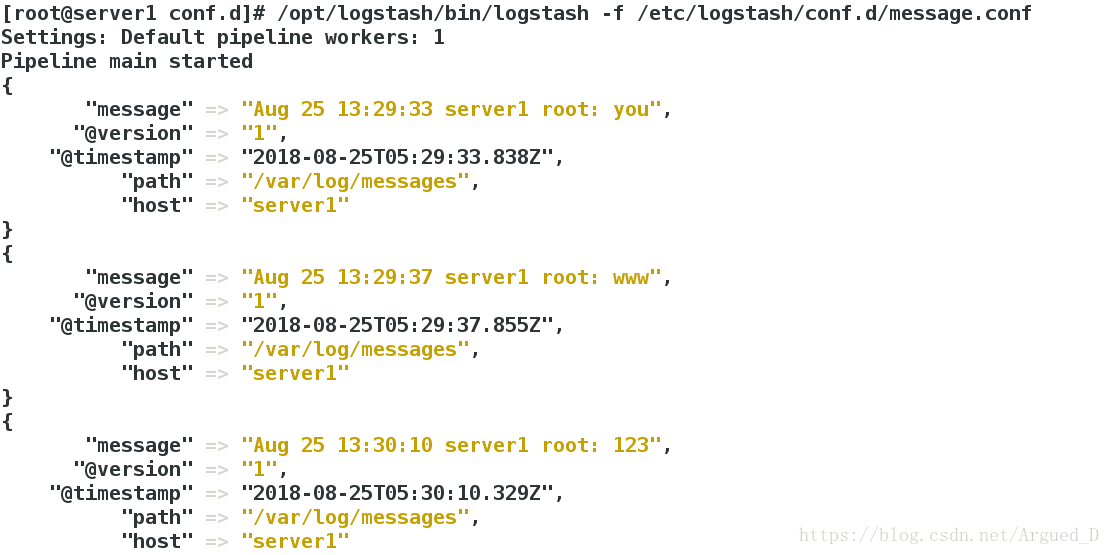
[root@server1 conf.d]# /opt/logstash/bin/logstash -f /etc/logstash/conf.d/message.conf
Settings: Default pipeline workers: 1
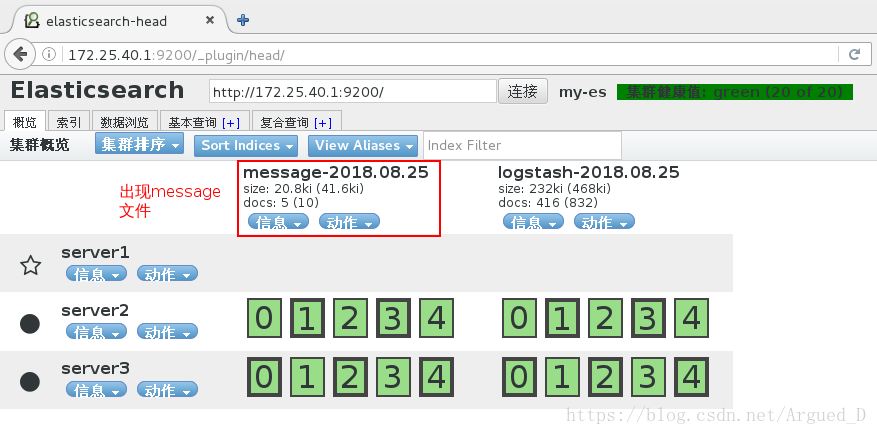
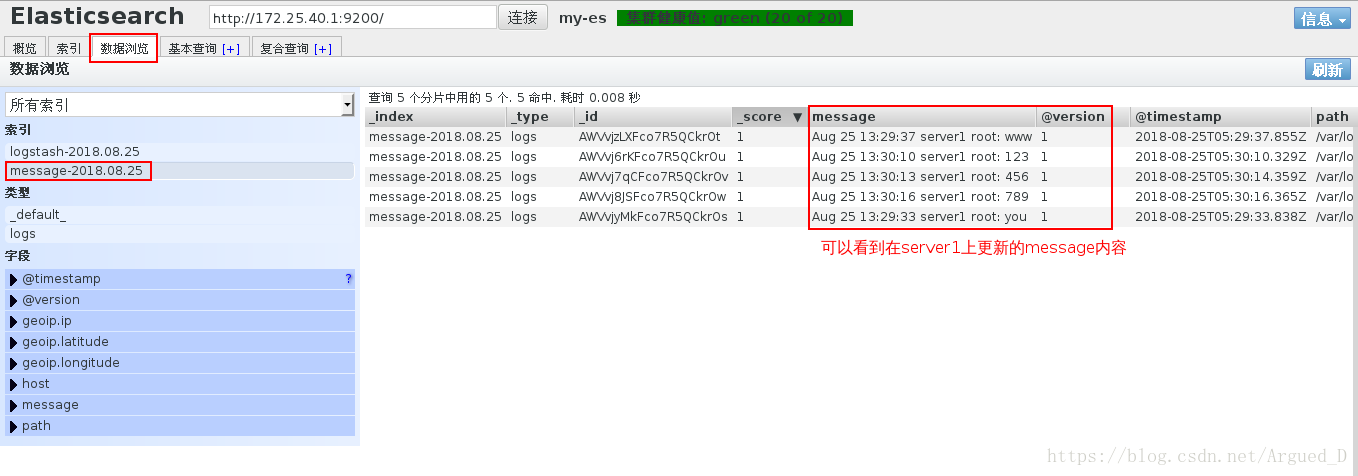
Pipeline main started网页没有生成message文件,是因为没有更新message的内容
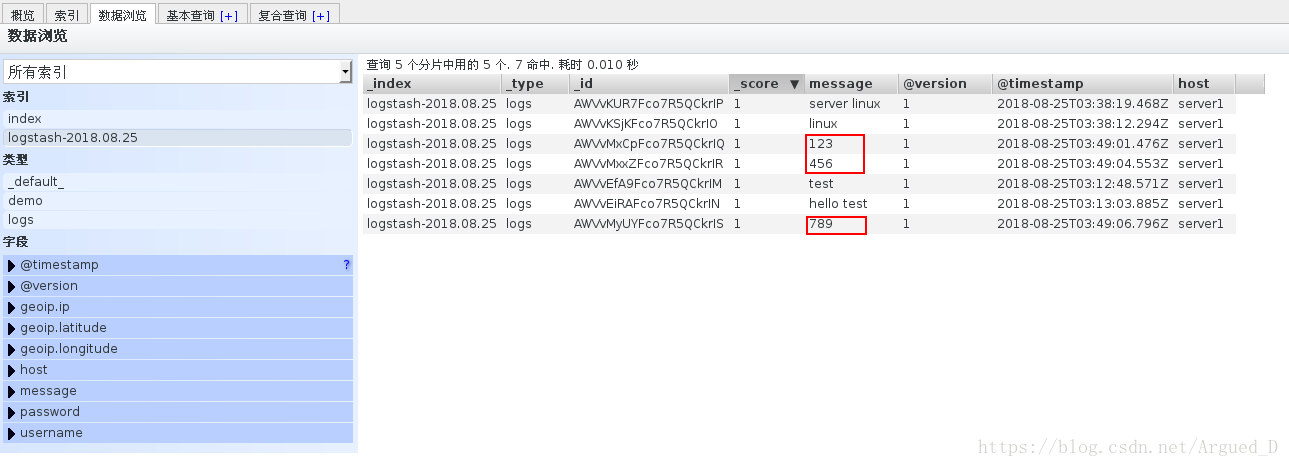
更新message
另开一个shell写入内容
[root@server1 ~]# logger you
[root@server1 ~]# logger www
[root@server1 ~]# logger 123
[root@server1 ~]# logger 456
[root@server1 ~]# logger 789
此时另一边的文件已经开始更新message内容
日志的远程传输
[root@server1 conf.d]# vim message.conf
input {
        syslog {
                port => 514
        }
}

output {
#        elasticsearch {
#               hosts => ["172.25.40.1"]
#               index => "message-%{+YYYY.MM.dd}"
#       }

        stdout {
                codec => rubydebug
        }
}[root@server1 conf.d]# /opt/logstash/bin/logstash -f /etc/logstash/conf.d/message.conf[root@server2 conf.d]# vim /etc/rsyslog.conf
81 *.* @@172.25.40.1:514
[root@server2 elasticsearch]# /etc/init.d/rsyslog restart在server1上可以看到server2的日志
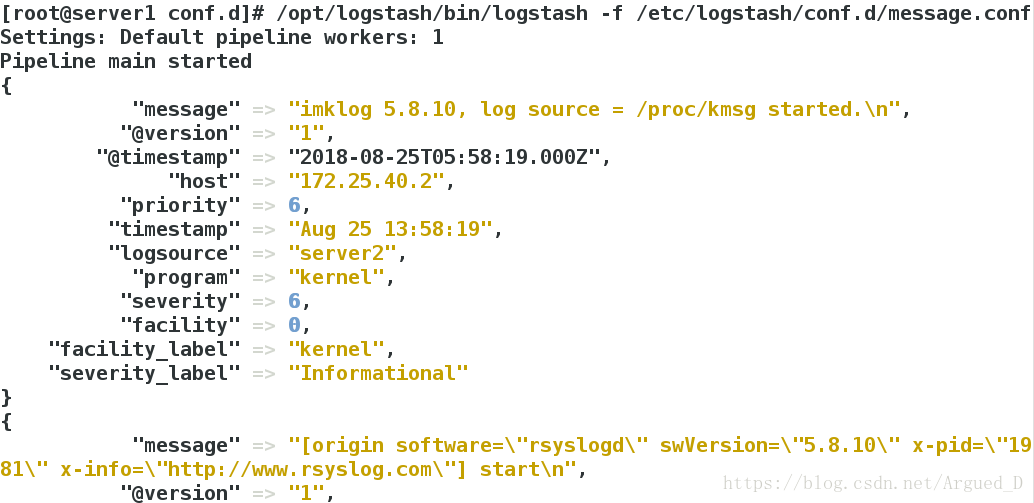
在server2上面更新message内容则在server1上也是可以看到
日志合并
[root@server1 conf.d]# cd /var/log/
[root@server1 log]# cd elasticsearch/
[root@server1 elasticsearch]# ls
my-es_deprecation.log             my-es_index_search_slowlog.log
my-es_index_indexing_slowlog.log  my-es.log
[root@server1 elasticsearch]# cat my-es.log 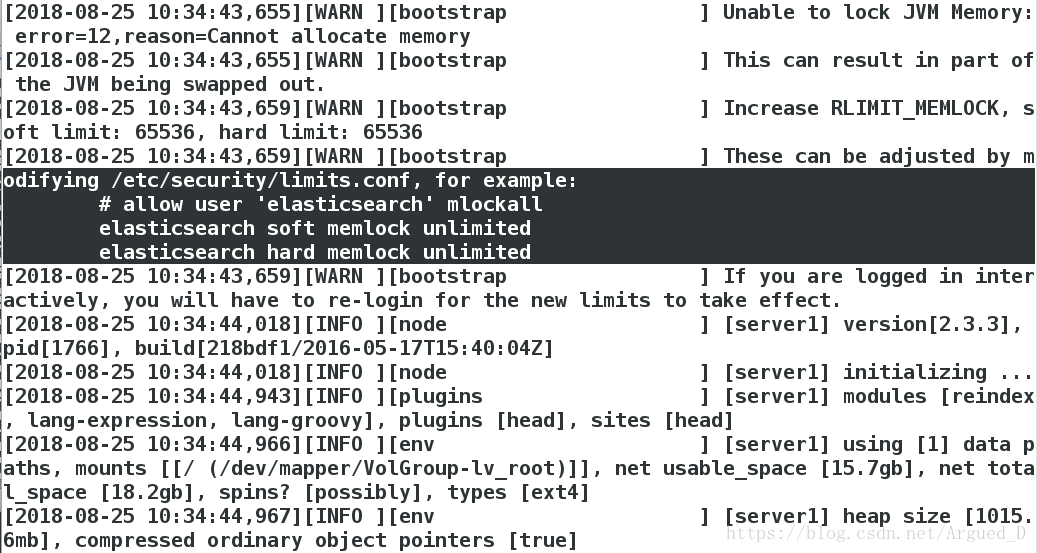
[root@server1 conf.d]# vim message.conf
input {
        file {
                path => "/var/log/elasticsearch/my-es.log"
                start_position => "beginning"
        }
}

filter{
  multiline{
#       type => "type"
        pattern => "^\["
        negate => true
        what => "previous"
        }
  }
output {
        elasticsearch {
                hosts => ["172.25.40.1"]
                index => "es-%{+YYYY.MM.dd}"
        }

        stdout {
                codec => rubydebug
        }
}
[root@server1 conf.d]# /opt/logstash/bin/logstash -f /etc/logstash/conf.d/message.conf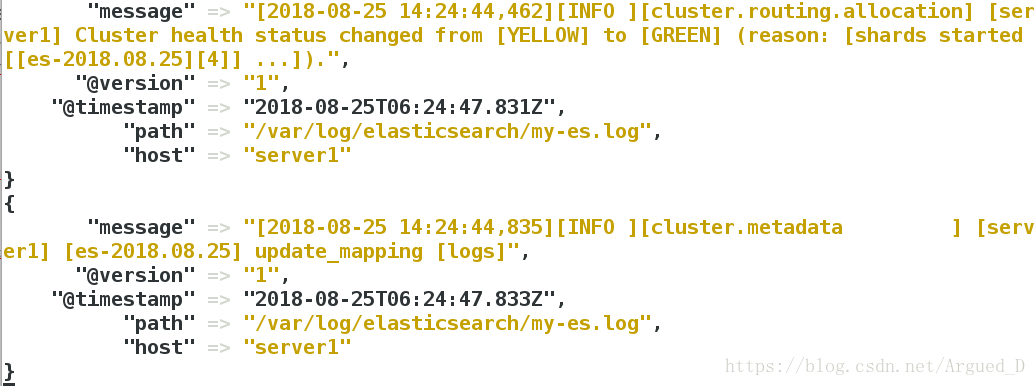
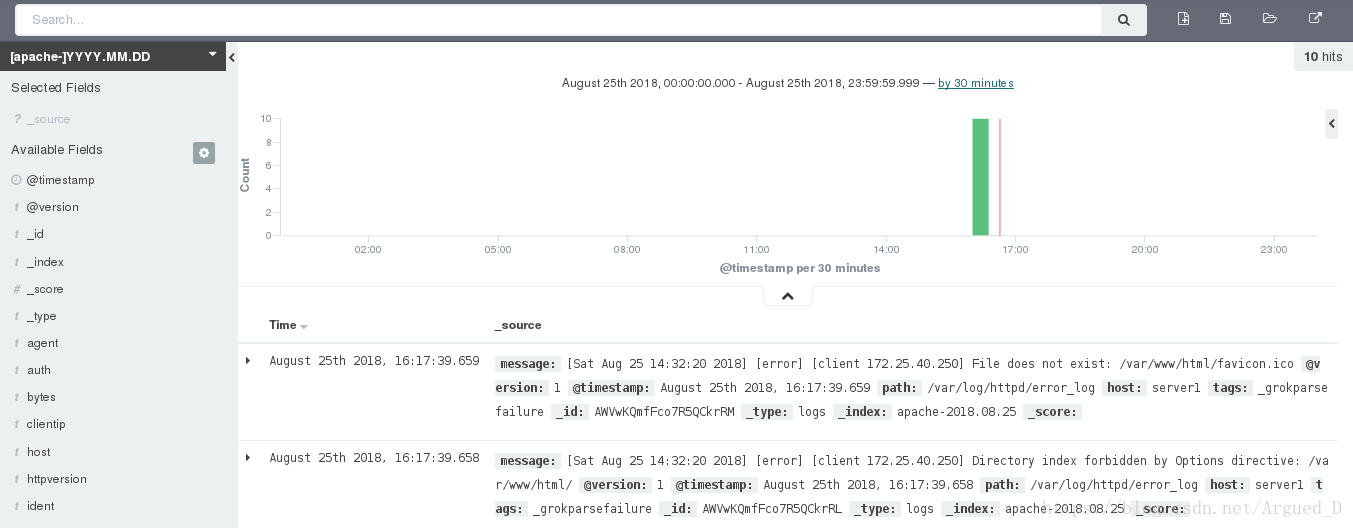
httpd的数据采集
[root@server1 ~]# yum install -y httpd
[root@server1 ~]# /etc/init.d/httpd start
[root@server1 ~]# cd /var/www/html
[root@server1 html]# vim index.html
www.westos.org
[root@server1 html]# curl 172.25.40.1
www.westos.org[root@server1 html]# cd /etc/logstash/
[root@server1 logstash]# cd conf.d/
[root@server1 conf.d]# vim message.conf
input {
file {
path => ["/var/log/httpd/access_log","/var/log/httpd/error_log"]
start_position => "beginning"
}
}
#filter{
# multiline{
## type => "type"
# pattern => "^\["
# negate => true
# what => "previous"
# }
output {
elasticsearch {
hosts => ["172.25.40.1"]
index => "apache-%{+YYYY.MM.dd}"
}
stdout {
codec => rubydebug
}
}
[root@server1 conf.d]# /opt/logstash/bin/logstash -f /etc/logstash/conf.d/message.conf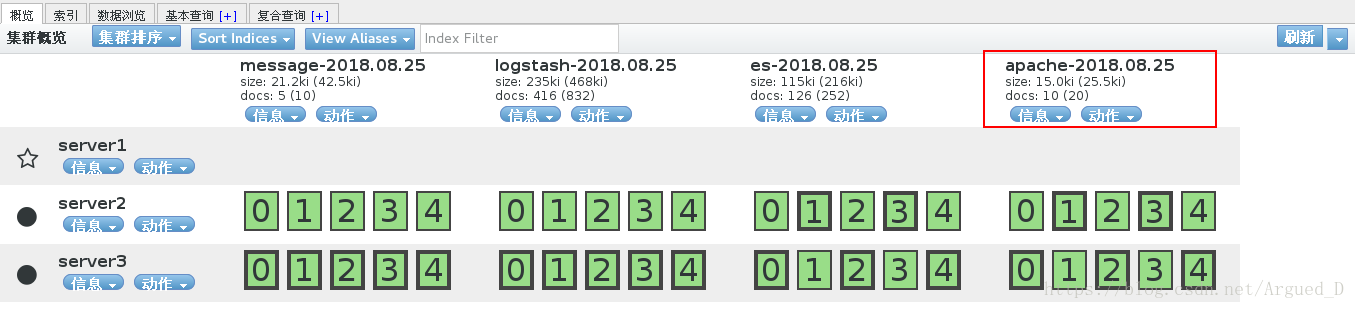
[root@server1 conf.d]# vim test.conf
input {
        stdin{}
}

filter {
  grok {
    match => { "message" => "%{IP:client} %{WORD:method} %{URIPATHPARAM:request} %{NUMBER:bytes} %{NUMBER:duration}" }
  }
}

output {
        stdout {
                codec => rubydebug
        }
}
[root@server1 conf.d]# /opt/logstash/bin/logstash -f /etc/logstash/conf.d/test.conf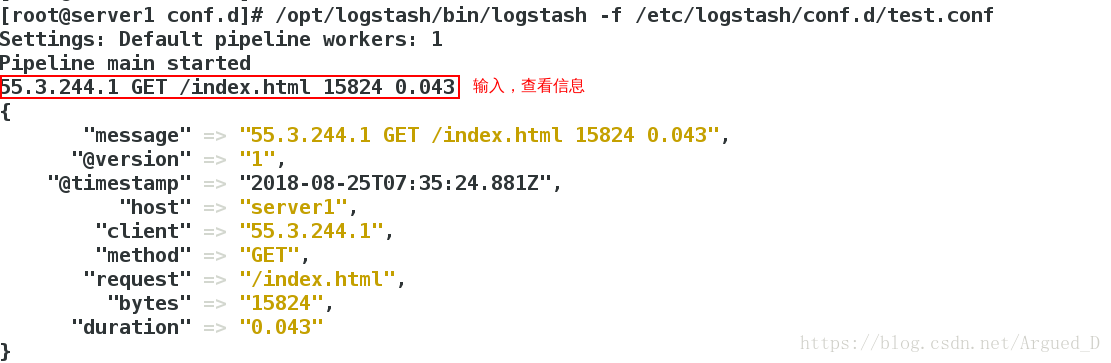
[root@server1 conf.d]# ls -i /var/log/elasticsearch/my-es.log
523028 /var/log/elasticsearch/my-es.log
[root@server1 conf.d]# cd
[root@server1 ~]# l.
[root@server1 ~]# cat .sincedb_d5a86a03368aaadc80f9eeaddba3a9f5
523028 0 64768 19414
[root@server1 ~]# rm -f .sincedb_d5a86a03368aaadc80f9eeaddba3a9f5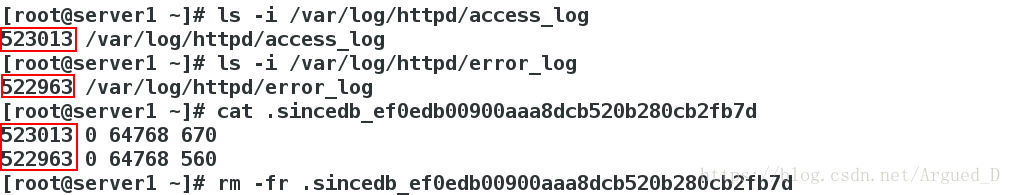
input {
        file {
                path => ["/var/log/httpd/access_log","/var/log/httpd/error_log"]
                start_position => "beginning"
        }

}

filter {
        grok {
                match => { "message" => "%{COMBINEDAPACHELOG}" }
        }
}
output {
        elasticsearch {
                hosts => ["172.25.40.1"]
                index => "apache-%{+YYYY.MM.dd}"
        }

        stdout {
                codec => rubydebug
        }
}
[root@server1 conf.d]# /opt/logstash/bin/logstash -f /etc/logstash/conf.d/message.conf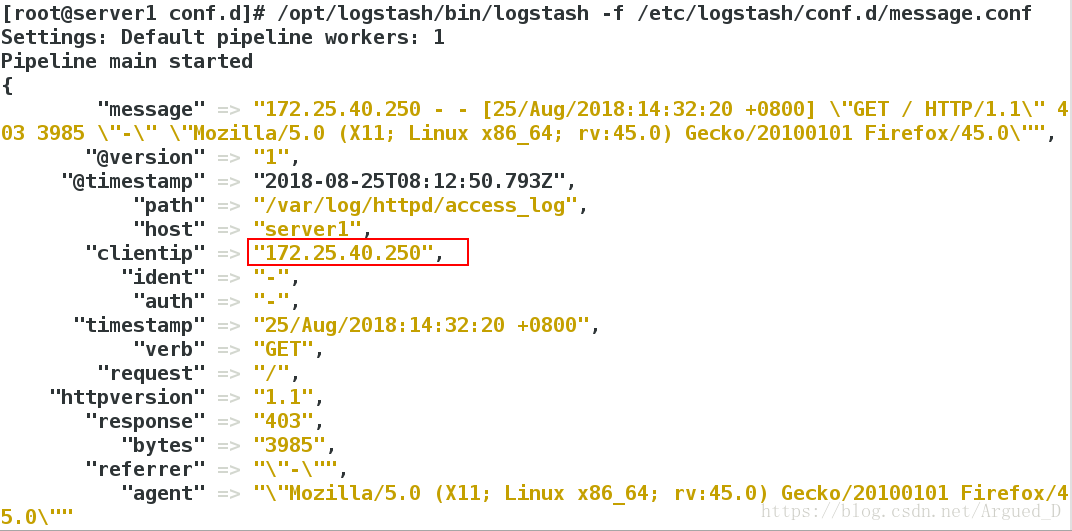
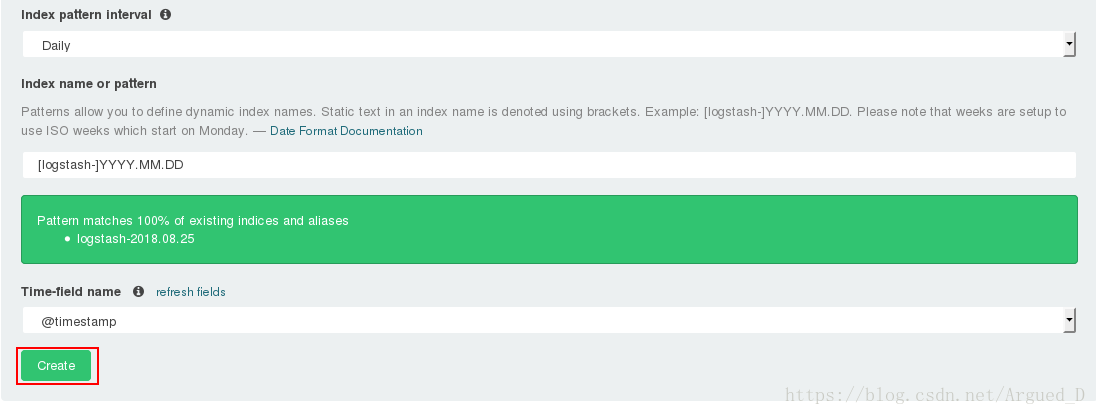
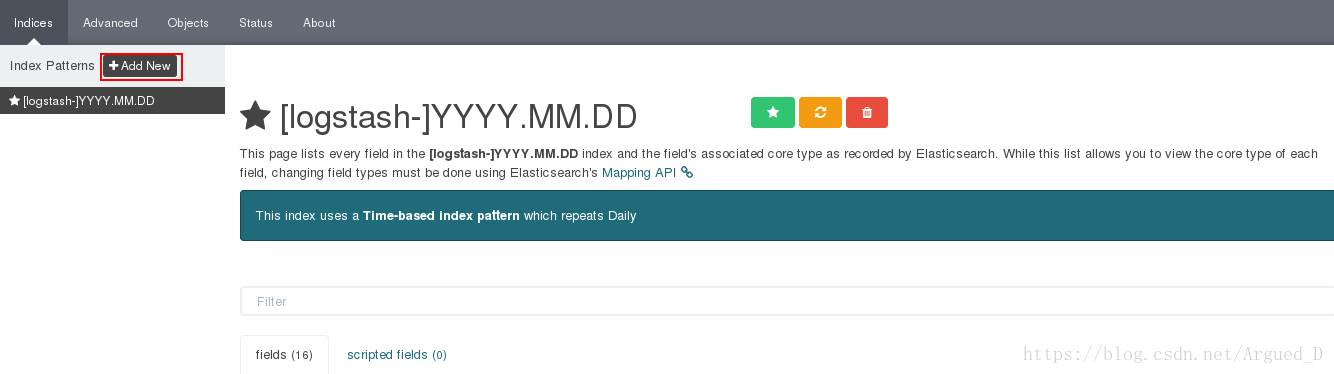
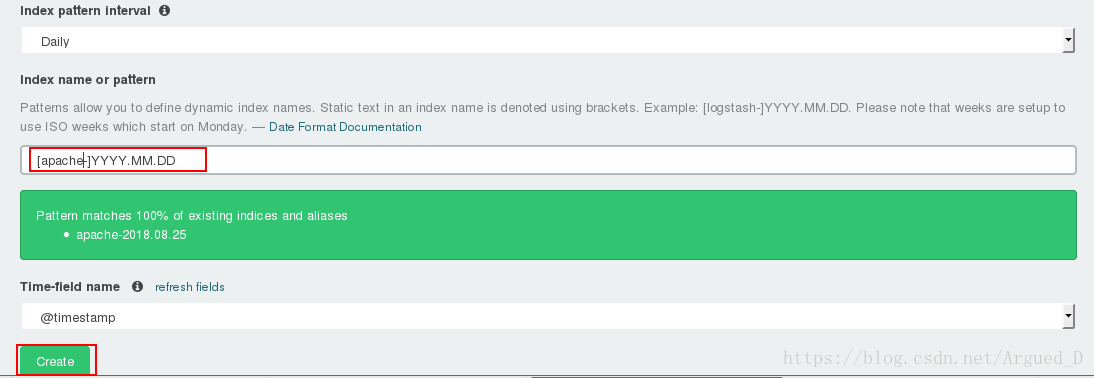
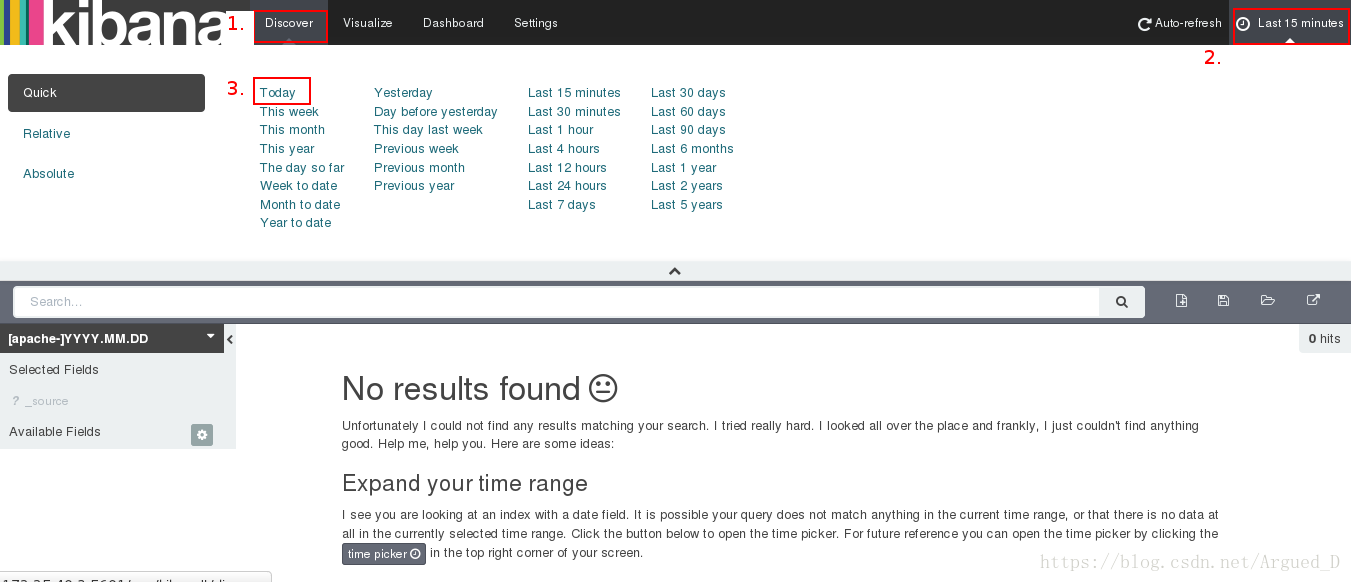
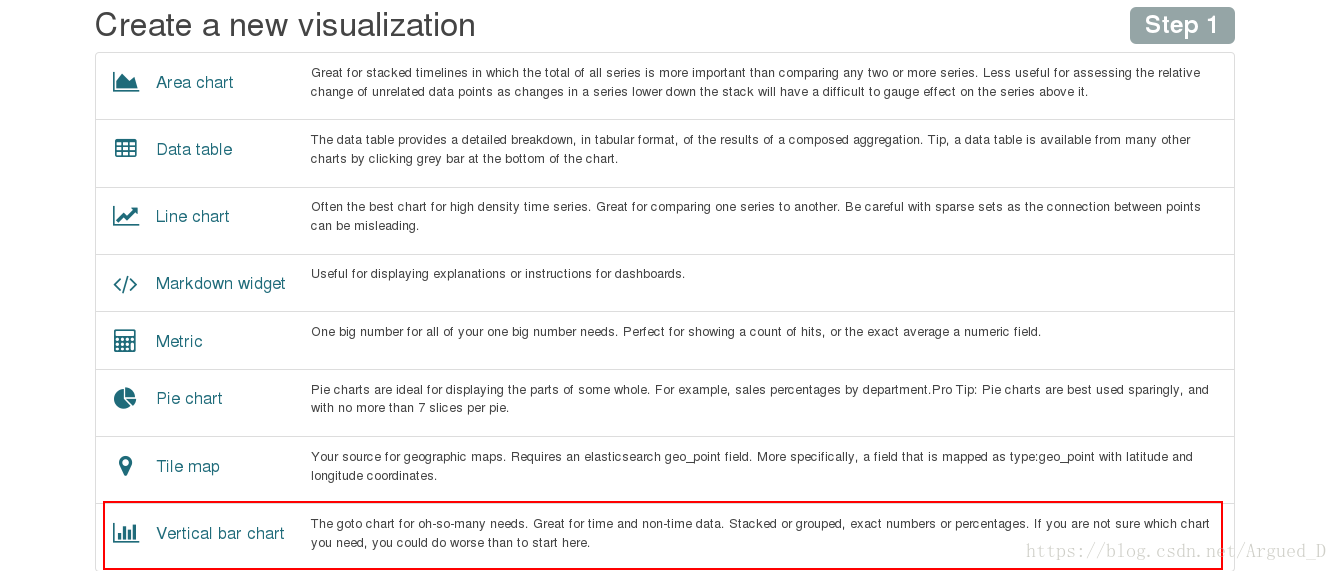
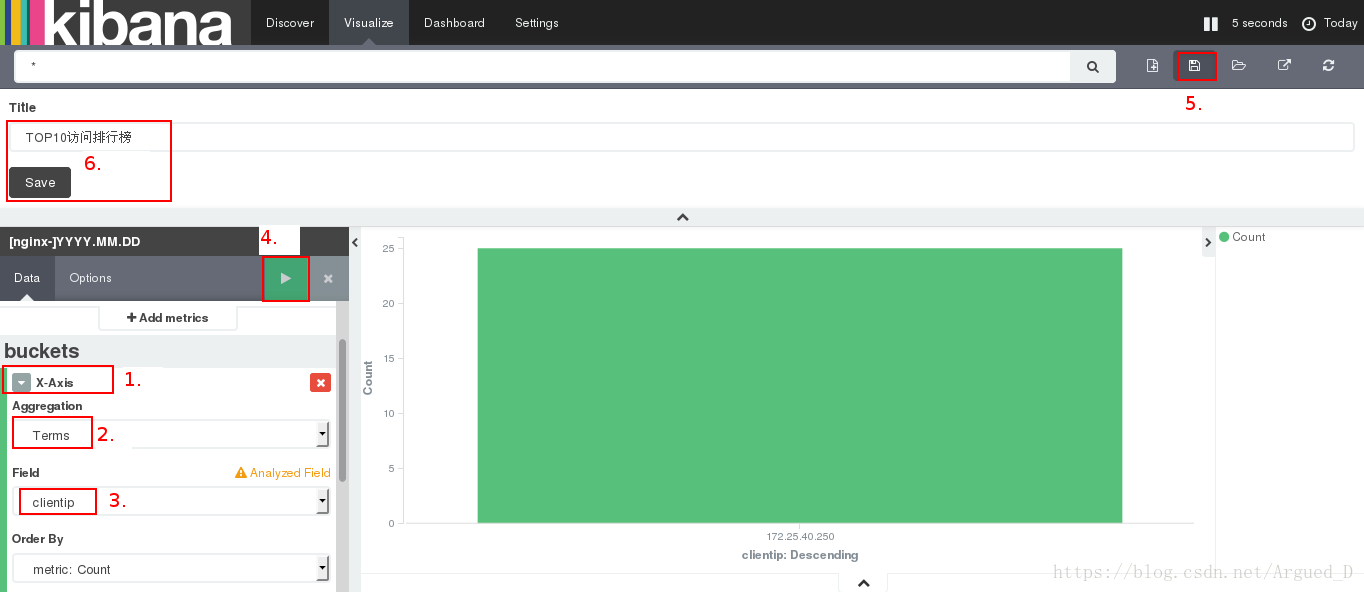
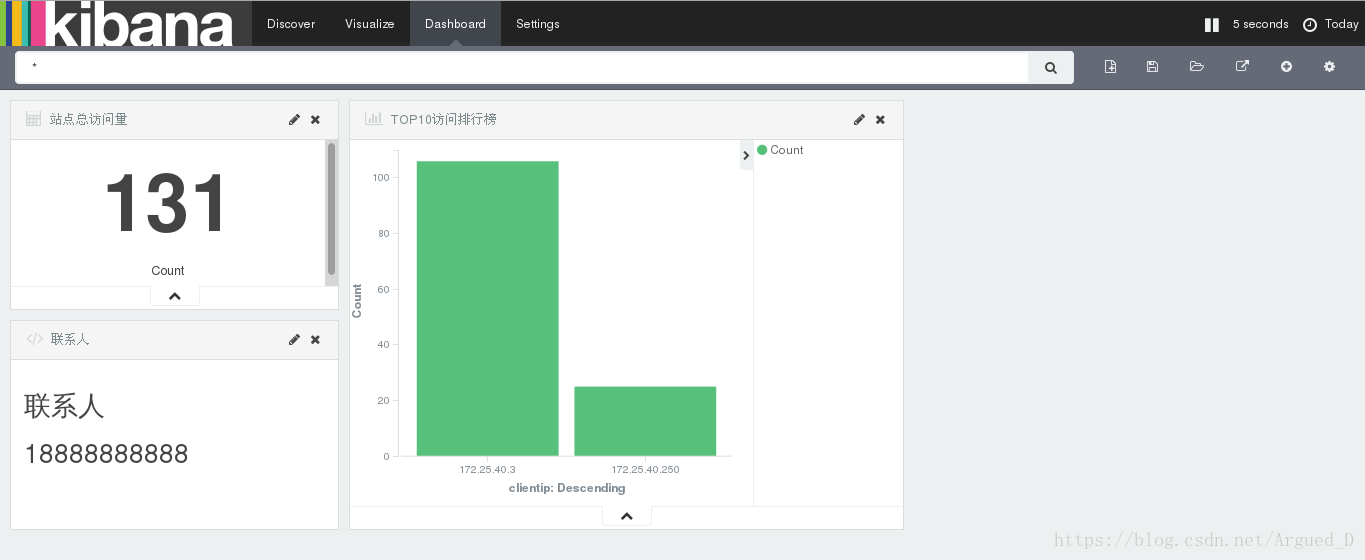
[root@server3 ~]# rpm -ivh kibana-4.5.1-1.x86_64.rpm
[root@server3 ~]# cd /opt/kibana/config/
[root@server3 config]# vim kibana.yml
15 elasticsearch.url: "http://172.25.40.1:9200"
23 kibana.index: ".kibana"
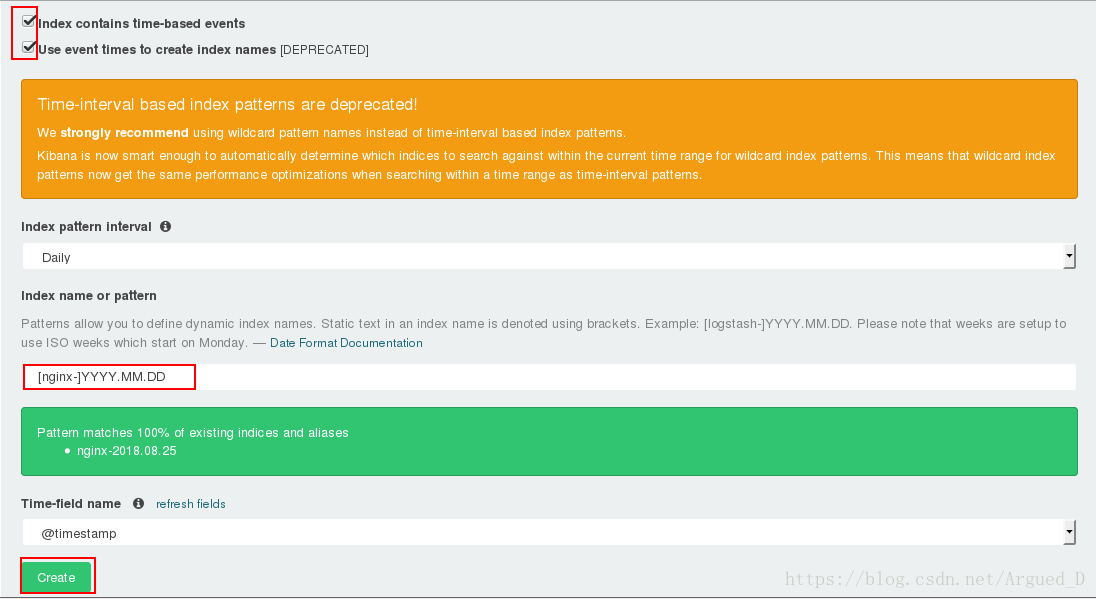
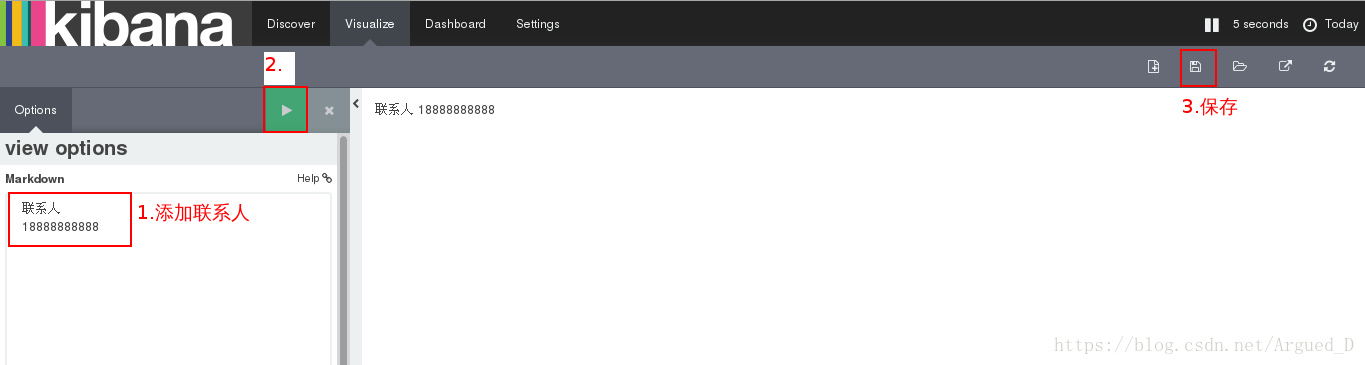
[root@server3 config]# /etc/init.d/kibana start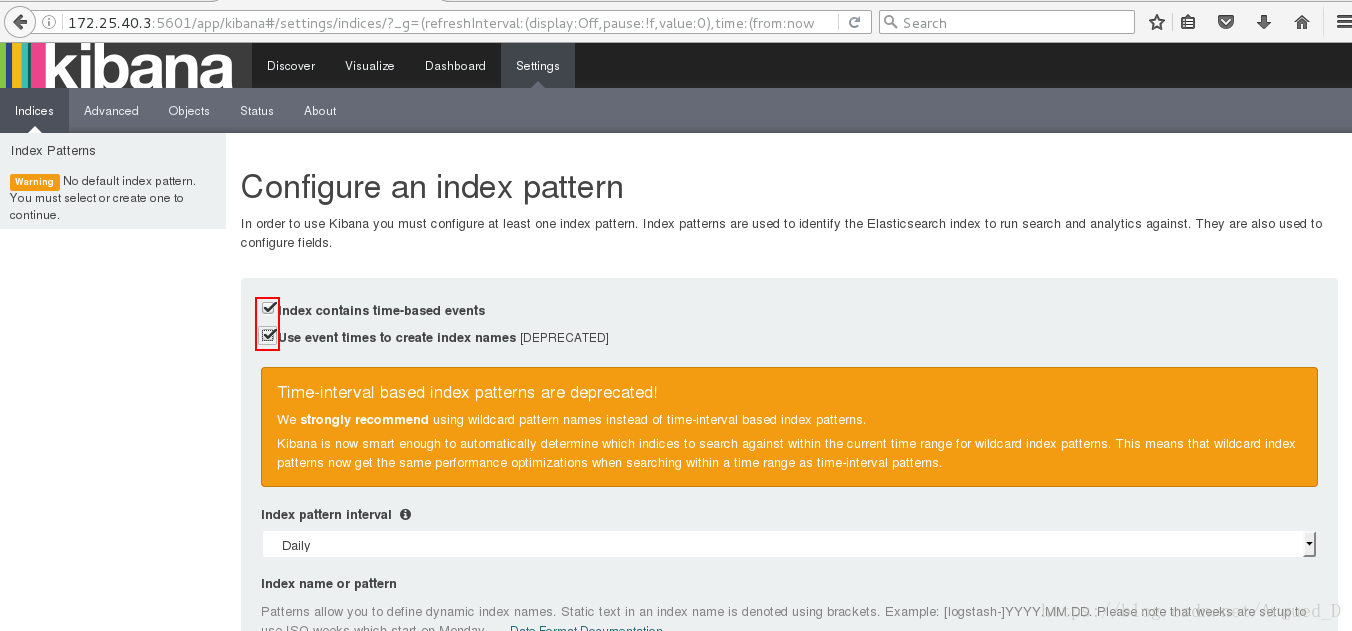
在【server2】上安装redis并编译
[root@server2 ~]# tar zxf redis-3.0.6.tar.gz
[root@server2 ~]# cd redis-3.0.6
[root@server2 redis-3.0.6]# yum install -y gcc
[root@server2 redis-3.0.6]# make && make install
[root@server2 redis-3.0.6]# cd utils/
[root@server2 utils]# ./install_server.sh    #一直回车
【server1】
[root@server1 ~]# /etc/init.d/httpd stop
[root@server1 ~]# rpm -ivh nginx-1.8.0-1.el6.ngx.x86_64.rpm
[root@server1 ~]# /etc/init.d/nginx start[root@server1 ~]# cd /etc/logstash/conf.d/
[root@server1 conf.d]# cp message.conf nginx.conf
[root@server1 conf.d]# ll /var/log/nginx/access.log
-rw-r----- 1 nginx adm 0 Aug 25 16:33 /var/log/nginx/access.log
[root@server1 conf.d]# ll -d /var/log/nginx/
drwxr-xr-x 2 root root 4096 Aug 25 16:33 /var/log/nginx/
[root@server1 conf.d]# chmod 644 /var/log/nginx/access.log[root@server1 ~]# l.
[root@server1 ~]# rm -fr .sincedb_*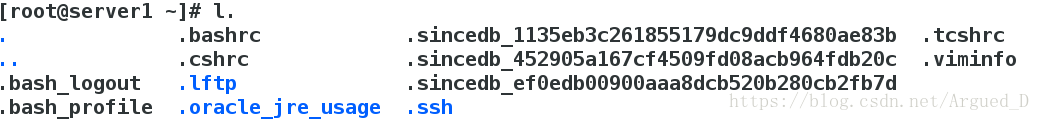
[root@server1 conf.d]# vim nginx.conf
input {
file {
path => "/var/log/nginx/access.log"
start_position => "beginning"
}
}
filter {
grok {
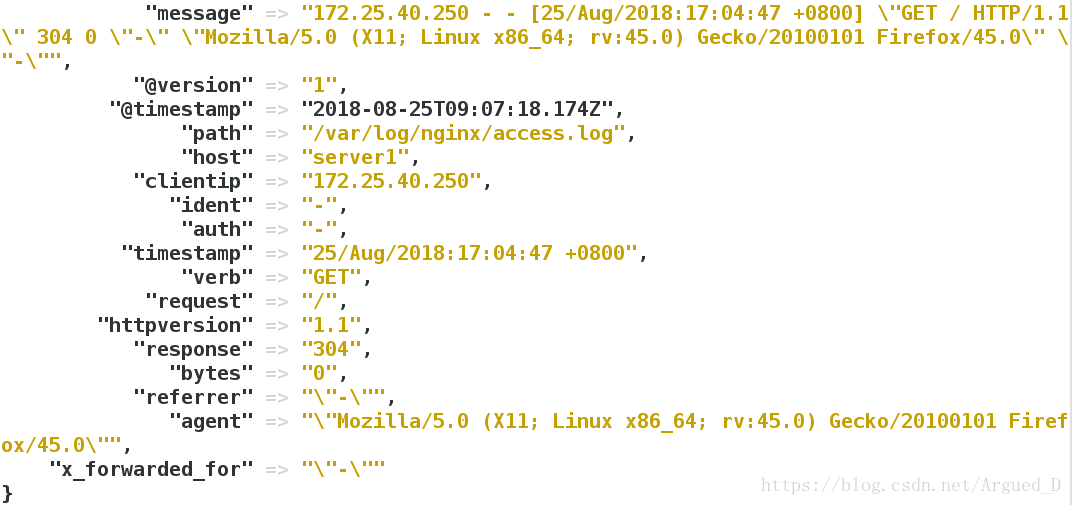
match => { "message" => "%{COMBINEDAPACHELOG} %{QS:x_forwarded_for}" }
}
}
output {
redis {
host => ["172.25.40.2"]
port => 6379
data_type => "list"
key => "logstash:redis"
}
stdout {
codec => rubydebug
}
}
[root@server1 conf.d]# /opt/logstash/bin/logstash -f /etc/logstash/conf.d/nginx.conf 在真机上做压测
[root@foundation40 ~]# ab -c 1 -n 10 http://172.25.40.1/index.html在【server1】上可以看到
[root@server1 conf.d]# scp es.conf server2:/etc/logstash/conf.d【server2】
[root@server2 ~]# rpm -ivh logstash-2.3.3-1.noarch.rpm[root@server2 ~]# cd /etc/logstash/
[root@server2 logstash]# cd conf.d/
[root@server2 conf.d]# vim es.conf
input {
redis {
host => "172.25.40.2"
port => 6379
data_type => "list"
key => "logstash:redis"
}
}
output {
elasticsearch {
hosts => ["172.25.40.1"]
index => "nginx-%{+YYYY.MM.dd}"
}
}[root@server2 conf.d]# /opt/logstash/bin/logstash -f /etc/logstash/conf.d/es.conf 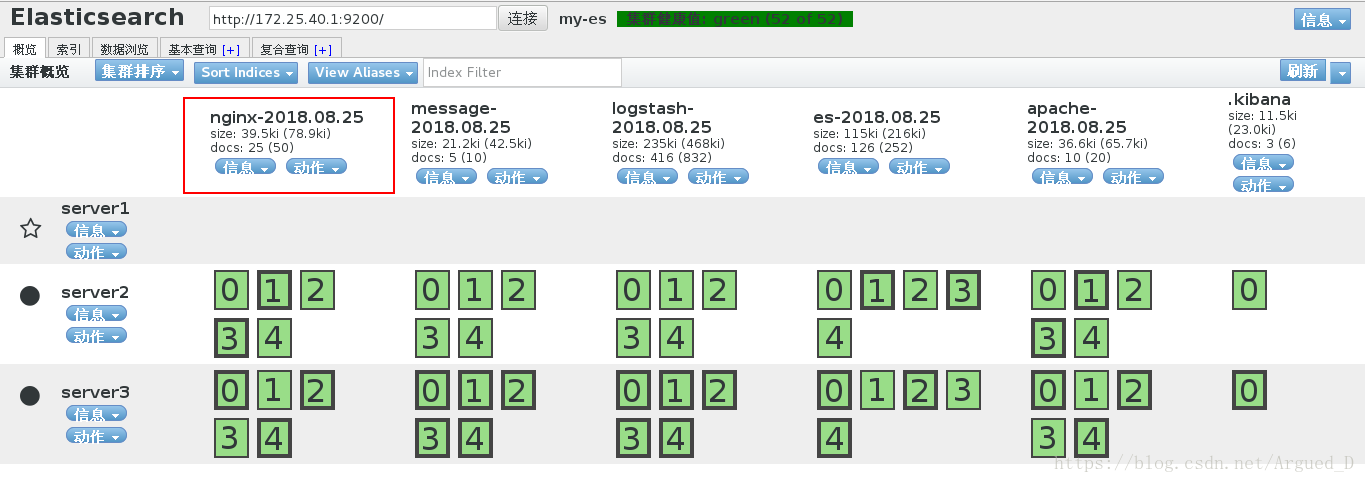


 2042
2042


 被折叠的 条评论
为什么被折叠?
被折叠的 条评论
为什么被折叠?
 到【灌水乐园】发言


