


Golang 使用pprof
Golang 中监控代码性能的有两个包
- net/http/pprof
- runtime/pprof
pprof 的作用
pprof 是 Golang 语言中分析程序运行性能的工具,它能提供各种性能数据
| 类型 | 描述 |
|---|---|
| allocs | 内存分配情况的采样信息 |
| blocks | 阻塞操作情况的采样信息 |
| cmdline | 显示程序启动命令及参数 |
| goroutine | 当前所有协程的堆栈信 |
| heap | 堆上内存使用情况的采样信息 |
| mutex | 锁争用情况的采样信息 |
| profile | CPU 占用情况的采样信息 |
| threadcreate | 系统线程创建情况的采样信息 |
| trace | 程序运行跟踪信息 |
runtime/pprof 的用法示例
package main

import (
    "flag"
    "fmt"
    "log"
    "os"
    "runtime/pprof"
)

var (
    cpuprofile = flag.String("cpuprofile", "", "write cpu profile to file.")
)

func main() {
    log.Println("begin")
    flag.Parse()

    if *cpuprofile != "" {
        f, err := os.Create(*cpuprofile)
        if err != nil {
            log.Fatal(err)
        }

        pprof.StartCPUProfile(f)
        defer pprof.StopCPUProfile()
    }

    for i := 0; i < 30; i++ {
        nums := fibonacci(i)
        fmt.Println(nums)
    }
}

func fibonacci(num int) int {
    if num < 2 {
        return 1
    }
    return fibonacci(num-1) + fibonacci(num-2)
}
- go build -o fabonacci
- ./fabonacci --cpuprofile=fabonacci.prof
net/http/pprof
package main

import (
	"fmt"
	"net/http"
	_ "net/http/pprof"
	"os"
	"time"
)

// 运行一段时间:fatal error: runtime: out of memory
func main() {
	// 开启pprof
	go func() {
		ip := "0.0.0.0:6060"
		if err := http.ListenAndServe(ip, nil); err != nil {
			fmt.Printf("start pprof failed on %s\n", ip)
			os.Exit(1)
		}
	}()

	tick := time.Tick(time.Second / 100)
	var buf []byte
	for range tick {
		buf = append(buf, make([]byte, 1024*1024)...)
	}
}
pprof 包会自动注册 handler, 处理相关的请求:
func init() {
  http.Handle("/debug/pprof/", http.HandlerFunc(Index))
  http.Handle("/debug/pprof/cmdline", http.HandlerFunc(Cmdline))
  http.Handle("/debug/pprof/profile", http.HandlerFunc(Profile))
  http.Handle("/debug/pprof/symbol", http.HandlerFunc(Symbol))
  http.Handle("/debug/pprof/trace", http.HandlerFunc(Trace))
}
启动服务后,直接在浏览器访问:
http://$HOST/debug/pprof/
单独查看:
- cpu(CPU Profiling):
$HOST/debug/pprof/profile,默认进行 30s 的 CPU Profiling,得到一个分析用的 profile 文件 - block(Block Profiling):
$HOST/debug/pprof/block,查看导致阻塞同步的堆栈跟踪 - goroutine:
$HOST/debug/pprof/goroutine,查看当前所有运行的 goroutines 堆栈跟踪 - heap(Memory Profiling):
$HOST/debug/pprof/heap,查看活动对象的内存分配情况 - mutex(Mutex Profiling):
$HOST/debug/pprof/mutex,查看导致互斥锁的竞争持有者的堆栈跟踪 - threadcreate:
$HOST/debug/pprof/threadcreate,查看创建新OS线程的堆栈跟踪
进入交互式模式之后,比较常用的有 top、 list、 web ,traces等命令
- top
(pprof) top
Showing nodes accounting for 1.55GB, 100% of 1.55GB total
Dropped 2 nodes (cum <= 0.01GB)
      flat  flat%   sum%        cum   cum%
    1.55GB   100%   100%     1.55GB   100%  main.main
         0     0%   100%     1.55GB   100%  runtime.main
top会列出5个统计数据:
- flat: 本函数占用的内存量。
- flat%: 本函数内存占使用中内存总量的百分比
- sum%: 前面每一行flat百分比的和,比如第2行虽然的100% 是 100% + 0%
- cum: 是累计量,加入main函数调用了函数f,函数f占用的内存量,也会记进来
- cum%: 是累计量占总量的百分比
list
查看某个函数的代码,以及该函数每行代码的指标信息,如果函数名不明确,会进行模糊匹配,比如list main会列出main.main和runtime.main。
(pprof) list main.main
Total: 1.55GB
ROUTINE ======================== main.main in /home/dyc/data/projects/go/src/go-cn/main.go
    1.55GB     1.55GB (flat, cum)   100% of Total
         .          .     20:	}()
         .          .     21:
         .          .     22:	tick := time.Tick(time.Second / 100)
         .          .     23:	var buf []byte
         .          .     24:	for range tick {
    1.55GB     1.55GB     25:		buf = append(buf, make([]byte, 1024*1024)...)
         .          .     26:	}
         .          .     27:}
(pprof)
traces
打印所有调用栈,以及调用栈的指标信息
(pprof) traces
File: testp
Type: inuse_space
Time: Jan 6, 2020 at 12:49am (CST)
-----------+-------------------------------------------------------
     bytes:  1.55GB
    1.55GB   main.main
             runtime.main
-----------+-------------------------------------------------------
     bytes:  1.24GB
         0   main.main
             runtime.main
-----------+-------------------------------------------------------
     bytes:  1016.83MB
         0   main.main
每个- - - - - 隔开的是一个调用栈,能看到runtime.main调用了main.main,并且main.main中占用了1.55GB内存
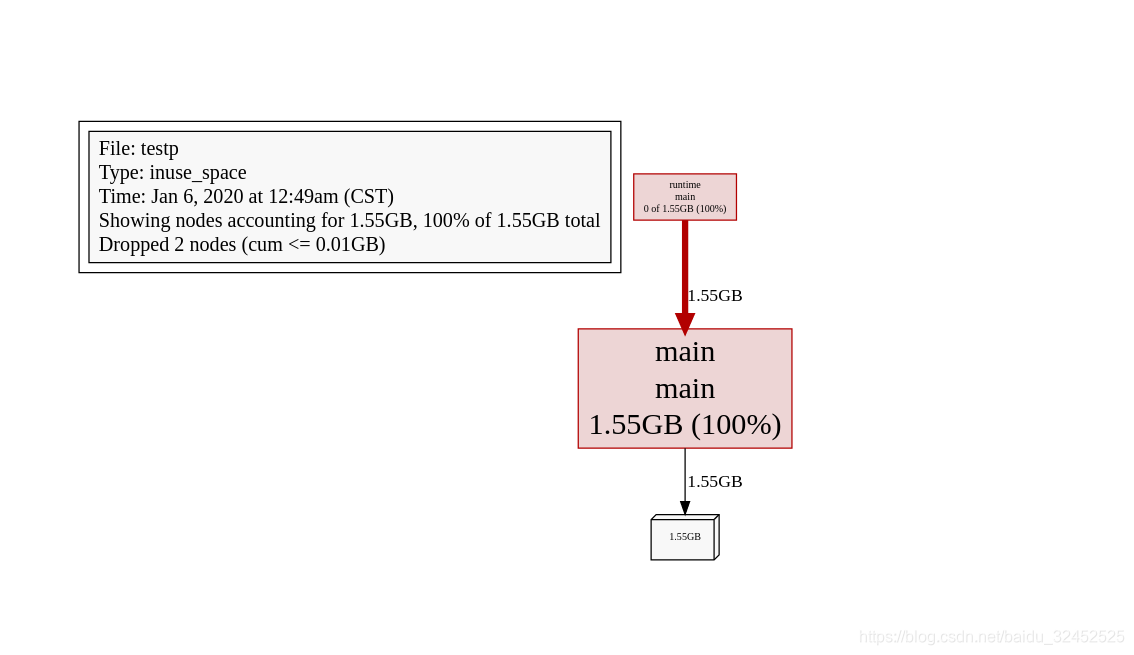
web
web命令就会在/tmp下生成svg文件,svg文件是可以在浏览器下看的
(pprof) web
在/tmp下生成 pprof001.svg,浏览器打开
golang pprof 能帮我们做什么
- 排查 CPU 占用过高: 使用CPU profile
- 排查内存占用过高:使用 Heap profiles
- 排查频繁内存回收:使用 Allocs profiles. GODEBUG=gctrace=1 ./binary | grep gc
- 排查协程泄露: 使用Goroutine profiles
- 排查锁的争用: 使用Mutex profiles
- 排查阻塞操作: 使用Block profiles


 1564
1564


 被折叠的 条评论
为什么被折叠?
被折叠的 条评论
为什么被折叠?
 到【灌水乐园】发言


