Amcharts 入门教程

最近需要学习 Amcharts ,他的图表功能确实很强大,比原来用的jfreechart强大多了。但是网上搜索到的教程很少,

从开始学起的确有点不方便。于是我决定把我学习的觉得好的途径,以教程的方式写下来。

我写这个教程的目的只是为了让大家去学习怎么编写第一个简单的 Amcharts 小 demo,至于一些较深的,因为我也是刚接触,

也不好多说,万一误导大家就不好了,而且那些较深的网上也很好搜。好了废话不多说,开始吧。

首先需要下载资源包:

官网地址:www.amcharts.com写本教程时,本来想直接把给出下载的地址的,但是官网始终打不开。

或者可以去我的资源下载:http://download.csdn.net/detail/cdmamata/4886019

官方上有四个组件,其他的我们不管,我们只管 amcharts_x.x.x ,里面的 index.html 就是教程跟api,我也是根据这个学习的,虽然是 en 文的,但是看看还是不错的。

导入 amcharts js库

因为这是 java web project,所以我们把 amcharts 文件夹放到 webroot 下。在 jsp 页面中,导入 amcharts.js。

代码如下:

<html>
  <head>
	<title>My JSP 'index.jsp' starting page</title>
	
	<!-- 导入Amcharts js 库 -->
	<script src="amcharts/amcharts.js" type="text/javascript"></script>
	<script type="text/javascript">
		
		var fun1 = function(){
			var chartData = [{ country: "USA", visits: 4252 },
	                { country: "China", visits: 1882 },
	                { country: "Japan", visits: 1809 },
	                { country: "Germany", visits: 1322 },
	                { country: "UK", visits: 1122 },
	                { country: "France", visits: 1114 },
	                { country: "India", visits: 984 },
	                { country: "Spain", visits: 711 },
	                { country: "Netherlands", visits: 665 },
	                { country: "Russia", visits: 580 },
	                { country: "South Korea", visits: 443 },
	                { country: "Canada", visits: 441 },
	                { country: "Brazil", visits: 395 },
	                { country: "Italy", visits: 386 },
	                { country: "Australia", visits: 384 },
	                { country: "Taiwan", visits: 338 },
	                { country: "Poland", visits: 328}];
			
			//AmSerialChart 类
			var chart = new AmCharts.AmSerialChart();
			chart.dataProvider = chartData;		//指定数据源
			chart.categoryField = "country";	//数据的分类
			
			//创建
			var graph = new AmCharts.AmGraph();
			graph.valueField = "visits";	//数值字段名称
			graph.type = "column";			//列名称
			chart.addGraph(graph);
			
			chart.write(document.getElementById("chartContainer"));	//write 到 div 中
		}
	</script>
  </head>
  
  <body οnlοad="fun1()">
	<div id="chartContainer" style="width: 640px; height: 400px;"></div>
  </body>
</html>

效果如下:

图像


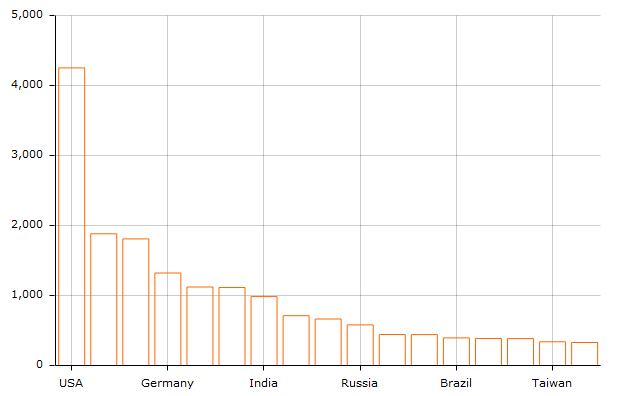
不太好看,接下来就美化一下,这是最后的代码

<html>
  <head>
	<title>My JSP 'index.jsp' starting page</title>
	
	<!-- 导入Amcharts js 库 -->
	<script src="amcharts/amcharts.js" type="text/javascript"></script>
	<script type="text/javascript">
		
		AmCharts.ready(function(){
			var chartData = [{ country: "USA", visits: 4252 },
	                { country: "China", visits: 1882 },
	                { country: "Japan", visits: 1809 },
	                { country: "Germany", visits: 1322 },
	                { country: "UK", visits: 1122 },
	                { country: "France", visits: 1114 },
	                { country: "India", visits: 984 },
	                { country: "Spain", visits: 711 },
	                { country: "Netherlands", visits: 665 },
	                { country: "Russia", visits: 580 },
	                { country: "South Korea", visits: 443 },
	                { country: "Canada", visits: 441 },
	                { country: "Brazil", visits: 395 },
	                { country: "Italy", visits: 386 },
	                { country: "Australia", visits: 384 },
	                { country: "Taiwan", visits: 338 },
	                { country: "Poland", visits: 328}];
			
			//AmSerialChart 类
			var chart = new AmCharts.AmSerialChart();
			chart.dataProvider = chartData;		//指定数据源
			chart.categoryField = "country";	//数据的分类
			
			
			//设置类别轴标签显示总数
			var catAxis = chart.categoryAxis;
			catAxis.gridCount = 18;
			catAxis.labelRotation = 90;
			//创建
			var graph = new AmCharts.AmGraph();
			graph.valueField = "visits";	//数值字段名称
			graph.type = "column";			//列名称
			chart.addGraph(graph);
			//填充3D
			graph.lineAlpha = 1;		//边框透明度
			graph.fillAlphas = 0.8;		//内部透明度
			graph.balloonText = "[[category]]: [[value]]";	//设置悬停显示内容
			
			chart.angle = 30;			//三维角度
			chart.depth3D = 15;			//三维深度
			
			chart.write(document.getElementById("chartContainer"));	//write 到 div 中
			
		});
	</script>
  </head>
  
  <body>
	<div id="chartContainer" style="width: 640px; height: 400px;"></div>
  </body>
</html>


最后的效果图


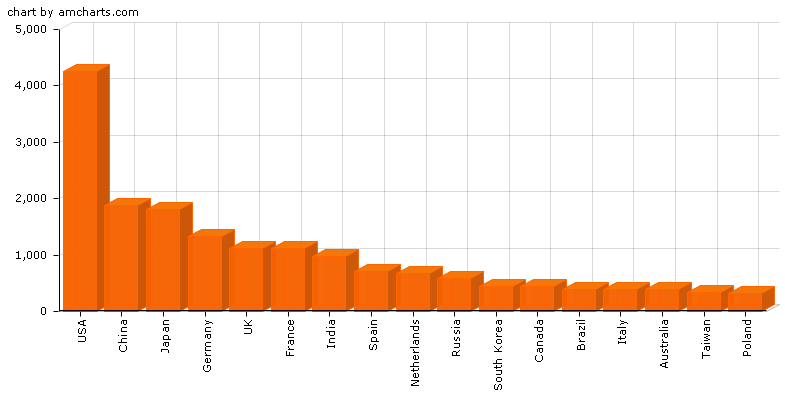
这里有一个问题,当div的宽度不够时,类别标签也会显示不全,正在查找解决方法


转载于:https://www.cnblogs.com/moonciki/archive/2012/12/14/8145865.html

  • 0
    点赞
  • 0
    收藏
    觉得还不错? 一键收藏
  • 0
    评论
xml <!-- [xml] (xml / csv) 数据类型xml/csv--> ; <!-- 如果使用csv作为数据的话,需要使用这个属性;表示文件数据分隔符,(平常以";"和","为主) [;] (string) csv file data separator (you need it only if you are using csv file for your data) --> 1 <!-- 如果使用的是csv数据,可以设置跳过几行再显示数据,默认为0表示csv中的数据全部显示,大于n(n>0);表示前面n行都不显示[0] (Number) if you are using csv data type, you can set the number of rows which should be skipped here --> <!-- 设置系统中的字体[Arial] (font name) use device fonts, such as Arial, Times New Roman, Tahoma, Verdana... --> <!-- 设置所有文本的大小,默认为11,具体的文本的字体大小也可以在下面的设置中设置[11] (Number) text size of all texts. Every text size can be set individually in the settings below --> <!-- 同上[#000000] (hex color code) main text color. Every text color can be set individually in the settings below--> . <!-- 小数分隔符,默认为[,]注:该属性只是用来显示,而在csv数据文件中,必须使用[.] (string) decimal separator. Note, that this is for displaying data only. Decimals in data xml file must be separated with a dot --> <!-- 千位分隔符,默认为空[ ] (string) thousand separator. use "none" if you don't want to separate --> 3 <!-- 如果百分数格式的数字,后面的小数位小于该属性的值,则在小数后面加0补充。如54.2%,该属性设置为3,那么显示的效果为54.200%。[] (Number) if your value has less digits after decimal then is set here, zeroes will be added --> <!--设置科学记数法的最小值 [0.000001] If absolute value of your number is equal or less then scientific_min, this number will be form
AmChart的实例帮助文档 amcharts 要一个“配置文件”(setting.xml),一个数据文件(amile_data.xml), 一个 SWFObject.js,一个对应的 SWF 就可以生成漂亮的统计报表了 1 SWFObject v1.5的对象结构 view plaincopy to clipboardprint? deconcept util getRequestParameter(_2b) // 取得url参数value。_2b是URL的key。 SWFObjectUtil getPlayerVersion() // 取得版本号对象。major.minor.rev。 cleanupSWFs() // 清除页面上所有元素。 SWFObject(_1, id, w, h, _5, c, _7, _8, _9, _a) // _1: swf,指定SWF文件路径。 // _id: id,或者标签的id。 // w: width,属性width。 // h: height,属性height。 // _5: version,flash版本,默认自动会去读取本地的flash插件版本的。 // c: bgcolor,背景色。 // _7: quality,品质(low, high, autolow, autohigh, best ) 。 // _8: xiRedirectUrl // _9: redirectUrl // _a: url参数key useExpressInstall(_d) // 设置xiSWFPath, useExpressInstall属性 setAttribute(_e, _f) // 设置属性attributes。_e是key,_f是value。 getAttribute(_10)http://www.wendangxiazai.com/b-6b9b1bbcf121dd36a32d82c6.html // 取得属性attributes中的值。_10是key。 addParam(_l1, _l2) // 设置参数params。_l1是key,_l2是value。 getParams() // 取得params。 addVariable(_l3, _l4) // 设置变量variables。_13是key,_14是value。 getVariable(_l5) // 取得变量variables中的值。 getVariables() // 取得变量variables。 getVariablePairs() // 取得变量variables的key=value对数组。 getSWFHTML() // 返回flash嵌入的HTML // 例如: // // src="/amchart/amchart/amcolumn/amcolumn.swf" mce_src="amchart/amchart/amcolumn/amcolumn.swf" // width="520" height="380" // style="undefined" mce_style="undefined" // id="amcolumn" name="amcolumn" // bgcolor="#FFFFFF" // quality="high" // flashvars="path=/amchar/amchar/amcolumn/&settings_file=amcolumn_settings.xml&data_file=amcolumn_data.txt&preloader_color=#000000"/> write(_20) // 写入flash插入的位置。_20可以是id的名称或者是一个dom结点。 PlayerVersion(_29) //http://www.wendangxiazai.com/b-6b9b1bbcf121dd36a32d82c6.html 创建版本号对象。 versionIsValid(fv) // 验证flash插件的当前版本号是否兼容fv的版本号(大于等于)。 getQueryParamValue = deconcept.util.getRequestParameter; FlashObject = deconcept.SWFObject; SWFObject = deconcept.SWFObject;

“相关推荐”对你有帮助么?

  • 非常没帮助
  • 没帮助
  • 一般
  • 有帮助
  • 非常有帮助
提交
评论
添加红包

请填写红包祝福语或标题

红包个数最小为10个

红包金额最低5元

当前余额3.43前往充值 >
需支付:10.00
成就一亿技术人!
领取后你会自动成为博主和红包主的粉丝 规则
hope_wisdom
发出的红包
实付
使用余额支付
点击重新获取
扫码支付
钱包余额 0

抵扣说明:

1.余额是钱包充值的虚拟货币,按照1:1的比例进行支付金额的抵扣。
2.余额无法直接购买下载,可以购买VIP、付费专栏及课程。

余额充值