


前言
调试寻路模块的时候,发现需要一个简单输出可视化路径信息的脚本,这样调试起来更方便。做工具脚本 python 是首选,因为它的库很多。经过筛选,发现 matplotlib.pyplot 库可以满足需求。引入这个库,简单实现了,输入一组坐标,输出一个图形文件,带有横纵坐标轴和路点以及路点间的连线。形如:

环境准备
- 基础设施:python3;pip3
- pip install matplotlib 安装库
API
- pyplot.plot(list1_x, list1_y) 画线; list1_x 为 x 坐标数组,list1_y 为 y 坐标数组
- pyplot.savefig(filename) 重定向输出到文件;filename 为文件名
- pyplot.show() 执行画线并输出到文件
python 脚本
#!/usr/bin/python3

import matplotlib.pyplot as plt
import sys

# @coords [x1, y1, x2, y2, ...]
def drawRoad(coords, filename):
    x_list = []
    y_list = []
    idx = 0
    i = 0
    lenth = len(coords)
    while i < lenth - 1:
        x_list.append(coords[i])
        y_list.append(coords[i + 1])
        idx = idx + 1
        i = i + 2
        pass

    #  print(x_list)
    #  print(y_list)
    plt.plot(x_list, y_list)
    plt.savefig(filename)
    plt.show()
    pass


#  print(sys.argv[0])
#  print(len(sys.argv))

coord_list = sys.argv[2:]
coord_list = [ float(x) for x in coord_list ]
filename = sys.argv[1]
drawRoad(coord_list, filename)

#  plt.plot(["1536", "1536", "1604"], ["1593", "2002", "1590"])
#  plt.savefig("draw.png")
#  plt.show()
执行命令:
python3 draw.py filename x1 y1 x2 y2 ...
lua 脚本
想在 lua 脚本中调用画图怎么做呢,利用 lua 的 io 库 来调用 python 脚本即可。
-- @opt 系统命令
function os_excute(opt)
    local t = io.popen(opt)
    local a = t:read("*all")
    return a
end

-- @画图接口
-- @pic_name 图片名字
-- @road 路径数据 {x1, y1, x2, y2, ...}
function draw_picture(pic_name, road)
    local coords = table.concat(road, " ", 1, #road)
    os_excute(string.format("python3 draw.py %s %s", pic_name, coords))
end
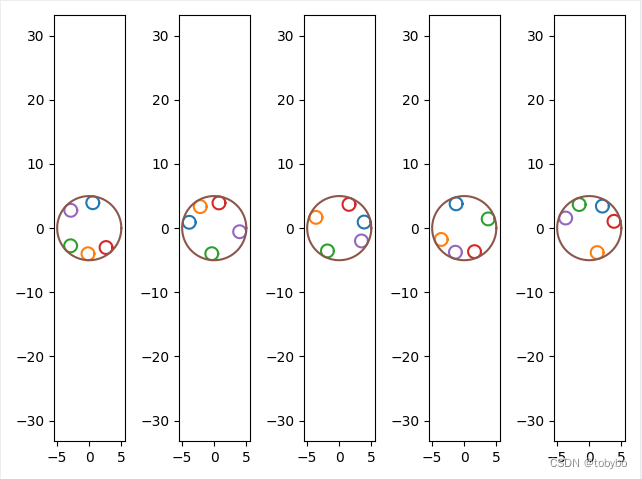
画圆和画子图
(add at 2023.02.28)
#!/usr/bin/python3

import matplotlib.pyplot as plt
import numpy as np
import sys

def drawCircle(count, filename, coords):
    an = np.linspace(0, 2 * np.pi, 100) #0到2π,取100个向量
    fig, ax = plt.subplots(1, count) #绘制1行count列子图
    for k in range(count):
        sub_ax = ax[k]; #取到第(k + 1)个子图 k从0开始
        lenth = len(coords[k]) #当前子图需要绘制的圆的个数
        i = 0
        while i < lenth - 2:
            x = float(coords[k][i])
            y = float(coords[k][i + 1])
            r = float(coords[k][i + 2])
            print(k, " ", count, " ", lenth, " ", i, "(",x,",",y,",",r,")")
            sub_ax.plot(x + r * np.cos(an), y + r * np.sin(an)) #绘制一个坐标为 x,y 半径为 r 的圆
            sub_ax.axis('equal') #设置横纵坐标轴单位显示长度一致
            i = i + 3

    fig.tight_layout()
    plt.savefig(filename)
    plt.show()
    pass


filename = sys.argv[1]
count = int(sys.argv[2])
old_count = count
loop_idx = 0
coord_list = []
while count > 0:
    num = int(sys.argv[3 + loop_idx])
    coords = sys.argv[3+loop_idx + 1:3+num+loop_idx+1]
    loop_idx = loop_idx + 1 + num
    coord_list.append(coords)
    count = count - 1

drawCircle(old_count, filename, coord_list)
结语
pyplot.plot 还支持输出多条曲线,添加颜色设置等,需要的话可以查询 api 文档 进行扩展。


 2191
2191


 被折叠的 条评论
为什么被折叠?
被折叠的 条评论
为什么被折叠?
 到【灌水乐园】发言


