


一、安装
1.通过 npm 引入
// 安装L7 依赖
npm install --save @antv/l7
// 安装第三方底图依赖
npm install --save @antv/l7-maps
2.通过 CDN 引入
<head>
<! --引入最新版的L7-->
<script src = 'https://unpkg.com/@antv/l7'></script>
<! --指定版本号引入L7-->
<script src = 'https://unpkg.com/@antv/l7@2.0.11'></script>
</head>
CDN 引用 在使用时通过 L7 命名空间获取所有对象并初始化,如 L7.scene、L7.GaodeMap
mport { Scene } from '@antv/l7';
import { GaodeMap } from '@antv/l7-maps';

const scene = new L7.Scene({
  id: 'map',
  map: new L7.GaodeMap({
    style: 'dark',
    center: [110.770672, 34.159869],
    pitch: 45,
  }),
});
二、地图组件使用
1.初始化地图首先需要在页面中新增一个Dom 用于地图初始化。
<div
    style="min-height: 500px;
    justify-content: center;
    position: relative"
    id="map"
/>
2.初始化高德地图
import { GaodeMap } from '@antv/l7-maps';
// 同样你也可以初始化一个 Mapbox 地图
const scene = new Scene({
id: 'map',
map: new GaodeMap({
pitch: 35.210526315789465,//地图倾角
style: 'dark',
center: [ 104.288144, 31.239692 ],//地图初始中心经纬度 地图中心
zoom: 4.4//初始化缩放等级。地图初始显示级别 高德 (2-19)
})
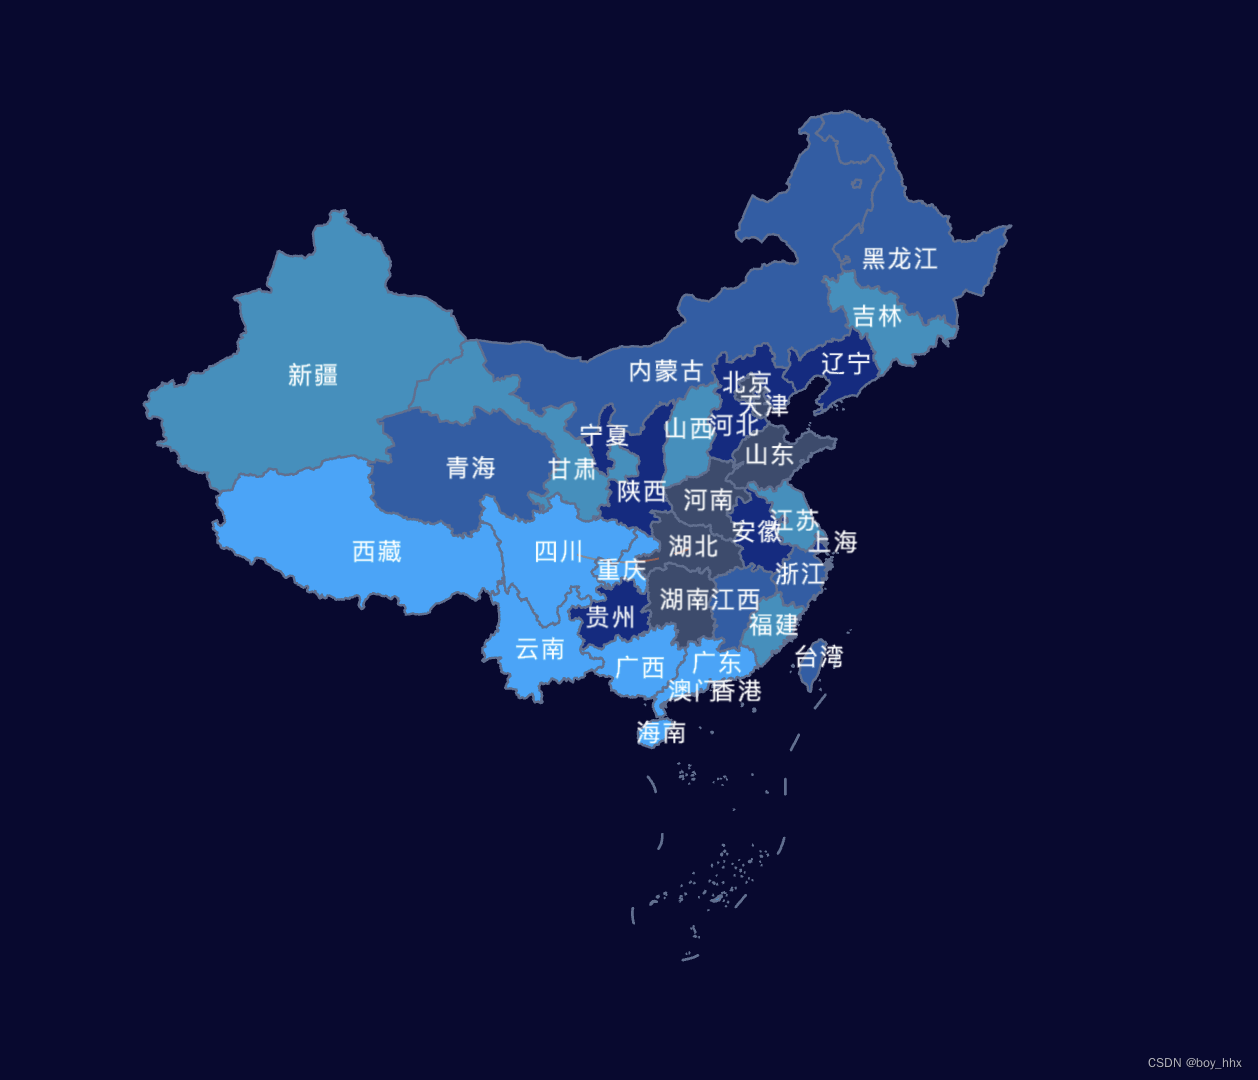
})四、绘制填充图
1.使用面图层来绘制行政区划数据,得到覆盖在地图表面的几何平面。
import {  PolygonLayer } from '@antv/l7';
 const chinaPolygonLayer = new PolygonLayer({})
  .source(data)
  .color('name', [
    'rgb(239,243,255)',
    'rgb(189,215,231)',
    'rgb(107,174,214)',
    'rgb(49,130,189)',
    'rgb(8,81,156)'
 ]);
//开启高亮
chinaPolygonLayer.active(true) //  开启默认高亮效果

chinaPolygonLayer.active({color: red}) // 开启并设置高亮颜色为红色


<<<<<<<<<<<<<<<<<<<<<<<<<<<<<也可以用scene.on去填充里面可以用fetch跨网络异步获取资源>>>>>>>>>>>>>>>>>>>>>>>>>>>>>>>>>>>
scene.on('loaded', () => {
     fetch(
        'https://gw.alipayobjects.com/os/bmw-prod/d6da7ac1-8b4f-4a55-93ea-e81aa08f0cf3.json',
      )
        .then((res) => res.json())
        .then((data) => {
          const chinaPolygonLayer = new PolygonLayer({
            autoFit: true,
          }).source(data);

          chinaPolygonLayer.color('name', [  'rgb(29,145,192)', 'rgb(34,94,168)', 'rgb(12,44,132)' ]).shape('fill').style({
            opacity: 1,
          });
          //  图层边界
          const layer2 = new LineLayer({
            zIndex: 2,
          })
            .source(data)
            .color('rgb(93,112,146)')
            .size(0.6)
            .style({
              opacity: 1,
            });

          scene.addLayer(chinaPolygonLayer);
          scene.addLayer(layer2);
        });
})
2.使用LineLayer可以画出每个所定区域的边界线,最后使用addLayer将定义的填充和边界线添加到scene里面。
五、添加地图标注
1.使用PointLayer添加标注。
         const layer = new PointLayer()
            .source(data, {
              parser: {
                type: 'json',
                x: 'lng',
                y: 'lat',
              },
            })
            .shape('square')//circle尝试过有两种形状
            .size(30)
            .style({});
          scene.addLayer(layer);
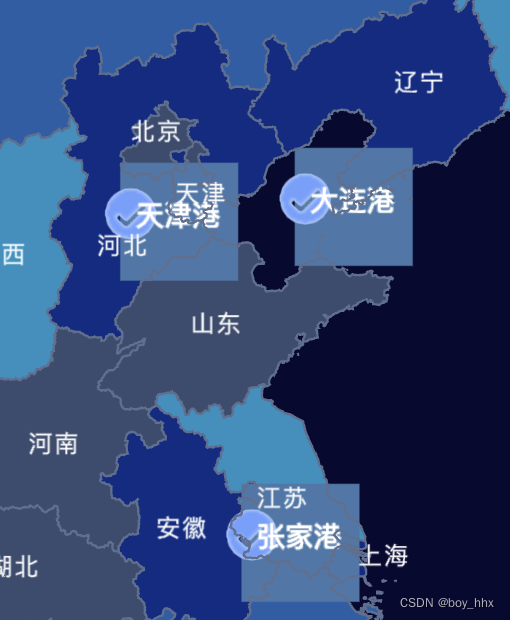
2. 但是这种方法有限制性,如果想改变其他的形状就不行了, L7还添加了Marker 组件,可以基于 DOM 实现各种复杂的标注。
import { Marker } from '@antv/l7';
 const el = document.createElement('label');
 el.className = 'labelclass';
el.textContent = nodes[i].v + '℃';
el.style.background = 'red';
el.style.borderColor = '#fff;
const marker = new Marker({ element: el})
  .setLnglat({ lng: 112, lat: 30});
scene.addMarker(marker);


 1336
1336


 被折叠的 条评论
为什么被折叠?
被折叠的 条评论
为什么被折叠?
 到【灌水乐园】发言


