


PRPC Performance Analysis
1. Scope
The scope of this document is:
- Show the capacity of a real server
- Show the timing distribution for each stage of one client request
- A way to estimate the performance requirement
- Some factors which are overlooked easily
2. Testing Environment
Web Server:
Sun Fire V440 SunOS 5.8 (sparc)
4x1593MHz (sparcv9)
16GB memory
12.3GB swap
579.4GB disc
421.3GB file system (360.1GB free)
CPU Utilization: <60%
Memory: 7GB Free
IBM HTTP Server + WebSphere 5.1
DB Server:
Sun Fire V440 SunOS 5.8 (sparc)
4x1593MHz (sparcv9)
16GB memory
12.3GB swap
653.4GB disc
427.4GB filesystem (123.9GB free)
CPU Utilization: <30%
Memory: 7GB Free
Oracle 10g
PRPC:
V5.2 SP1
Initial Heap Size: 1024
Maximum Heap Size: 2814
Generic JVM arguments:
-XX:+PrintGCTimeStamps
-XX:+PrintGCApplicationConcurrentTime
-XX:+PrintGCApplicationStoppedTime
-XX:SurvivorRatio=16
-XX:+UseParNewGC
-XX:MaxPermSize=512M
-XX:NewSize=768M
-XX:MaxNewSize=1280M
-XX:+DisableExplicitGC
-Xconcurrentio
-XX:ParallelGCThreads=2
-Dsun.rmi.transport.connectionTimeout=180000
-Djava.awt.headless=true
3. Scenarios and Results
Scenario A (without PRPC Hotfix 1154/1155/1156):
Initialize all Vusers simultaneously before ramp up
Ramp up 3 users every 17 seconds
Run for 5 hours
Ramp down 3 users every 19 seconds
Users randomly trigger application functions (Thinking Time Range: 10~15 seconds)
Total 200 vusers
Scenario B (with PRPC Hotfix 1154/1155/1156):
Initialize all Vusers simultaneously before ramp up
Ramp up 3 users every 17 seconds
Run for 5 hours
Ramp down 3 users every 19 seconds
Users randomly trigger application functions (Thinking Time Range: 10~15 seconds)
Total 50 vusers
Scenario C (with PRPC Hotfix 1154/1155/1156):
Initialize all Vusers simultaneously before ramp up
Ramp up 3 users every 17 seconds
Run for 5 hours
Ramp down 3 users every 19 seconds
Users randomly trigger application functions (Thinking Time Range: 10~15 seconds)
Total 200 vusers
Scenario D:
Initialize all Vusers simultaneously before ramp up
Ramp up 3 users every 17 seconds
Run for 5 hours
Ramp down 3 users every 19 seconds
Users randomly trigger application functions (Thinking Time Range: 10~15 seconds)
Total 230 vusers
Scenario E:
Initialize all Vusers simultaneously before ramp up
Ramp up 3 users every 17 seconds
Run for 5 hours
Ramp down 3 users every 19 seconds
Users randomly trigger application functions (Thinking Time Range: 10~15 seconds)
Total 330 vusers
Scenario F:
Initialize all Vusers simultaneously before ramp up
Ramp up 3 users every 17 seconds
Run for 5 hours
Ramp down 3 users every 19 seconds
Users randomly trigger application functions (Thinking Time Range: 10~15 seconds)
Total 500 vusers
4. Analysis
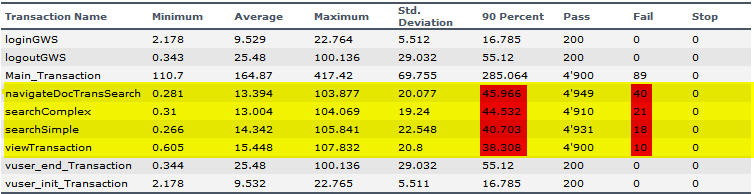
- Scenario A shows the performance is very bed, and some failures happen after a couple of hours. This is caused by PRPC memory leak. PRPC ListView is used for all screens in the application, including search result screen. ListView will cause 11K memory leak for each call, therefore PRPC hits 2 GB memory limitation after a couple of hours performance testing. Pega provides three hot fixes to resolve this issue:
- Hotfix 1154
- Hotfix 1155
- Hotfix 1156
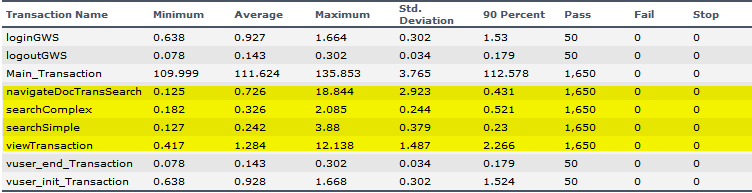
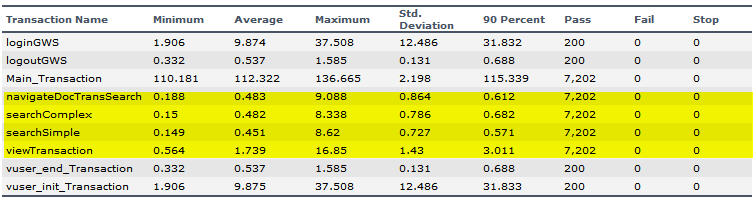
- Scenario B and C shows a very similar result, this means the server is not fully used and CPU runs idle, the result (0.5 ~ 0.6 sec) is the best the application can archive. Based on this timing and the performance requirement, it is able to estimate the max number of concurrent the server can support.
In this case, the performance requirement is within 5 seconds, so the server can support 4 (CPU)*5 *1/0.5 = 40 concurrent users.
Also, there's another way to prove this number that using "Performance" inside of PRPC.
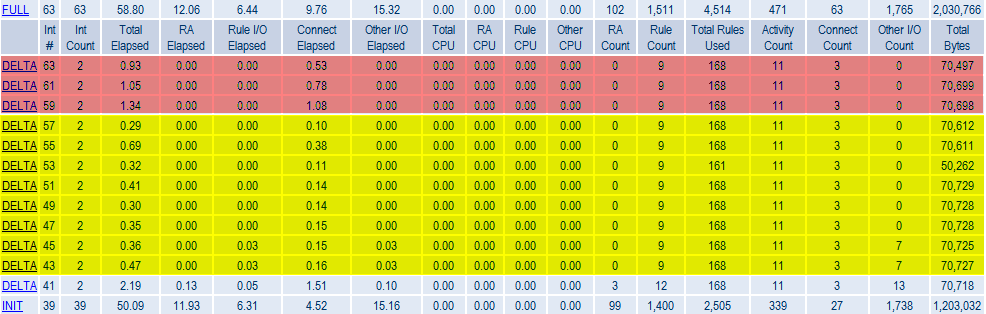 The results highlighted by yellow are search on indexed columns, and red are search on non-indexed columns. As per the testing case, the number of indexed columns search is more than non-indexed columns search, so 0.5 second is a reasonable average number.
PRPC Performance tool is a good component for developer. It would be better try to ensure any action won't hit 2 seconds during development if the performance requirement is within 5 seconds (Give 3 seconds buffer to higher volume, network delay, etc.).
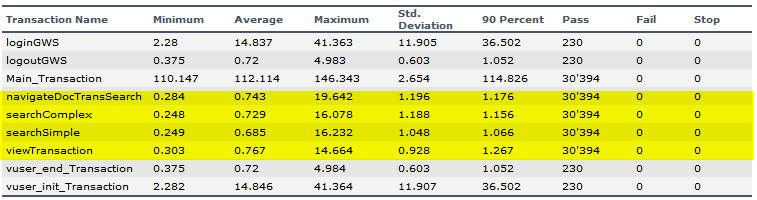
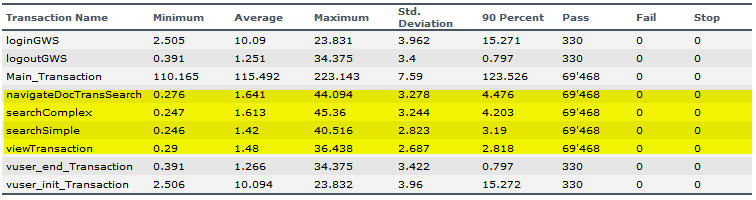
- From Scenario C to E, the performance slows down as per the increase of the user, which is normal.
- Scenario E shows a result almost close to the performance requirement. It proves the server can support around 330 active users, and some buffer is there.
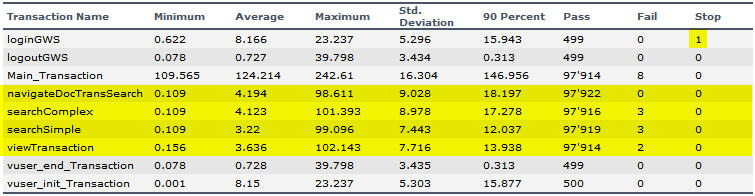
- Failures start to occur in Scenario F, which are all timeout errors, and the performance is not good. This result means 500 active users are more than the capacity of this server.
Also, there's another way to estimate the capacity based on the best result and thinking time. In this case, the best result is 0.5 second, average thinking time is 12.5 seconds (the average between 10~15 as per test scenario), and performance requirement is less than 5 seconds. So the max number of active user will be 4 (CPU)*1 (sec)/0.5*5 *12.5 = 500. This expression also has another meaning that there're max numbers of concurrent users in the system at any point of time within 12.5 seconds. Since CPU needs additional time to maintain the run queue, so the capacity won't be more than 500 active users.
- There're some other diagrams shows the timing distribution for the simple action, which is using a ListView and a SQL query on multiple tables to show a set of records without any other calculation or data change. This is the most popular scenario for any search function.
LoaderRunner:
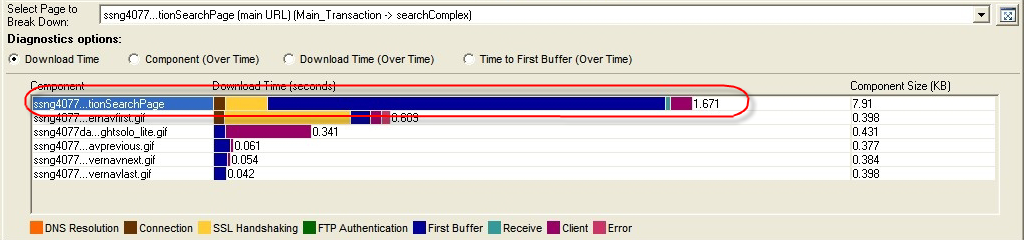
PRPC Performance:
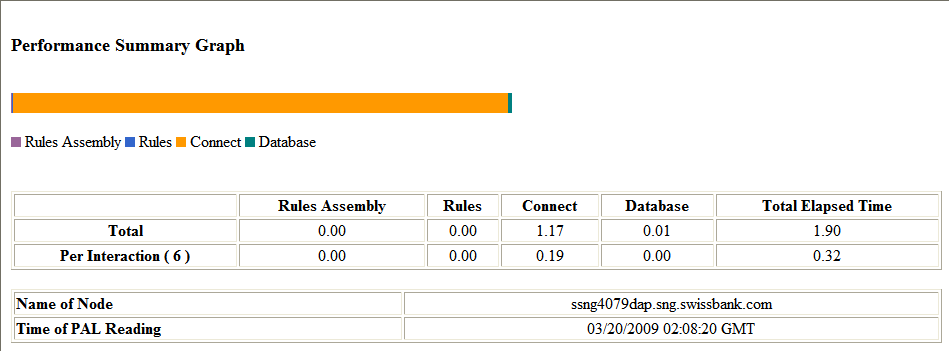
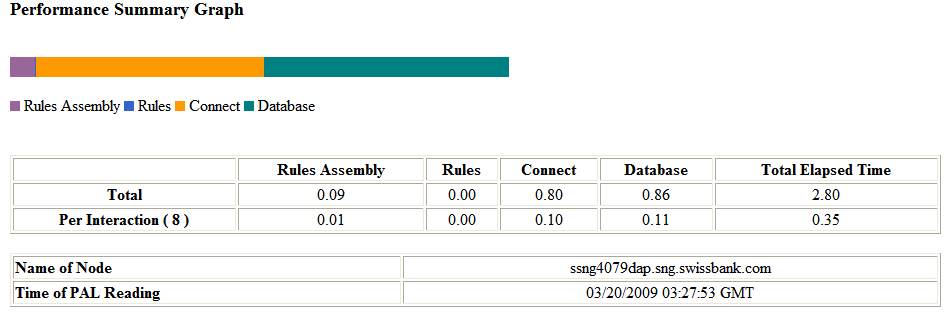
From these two diagrams, we should be able to know:
· 80% of time is spent on PRPC execute the activities
· Although the time distribution in PRPC Performance tool shows different result on Connect and Database, the results show there're around 80~90% of time is spent on DB operation. (Guess the difference is because of data cache)
· Only 20% of time is spent on network transfer between client and server
- From PRPC Performance tool, we are able to know the DB execution timing percentage, but this number includes PRPC internal database execution, like retrieve the rule instances. In order to get the real timing for business, some logs are added into the business activities, which will log the time when the activity gets called and when the activity finishes. This result will help developer to understand the performance of application related activities.
The following statistics shows the logs for Scenario E:
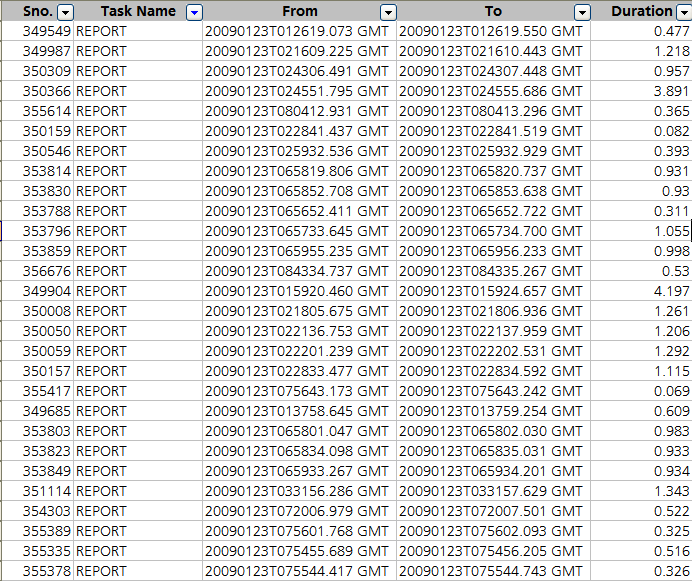
It shows around 1 second out of 3.2 seconds are caused by application business logic, which starts from the activity is called, till the time before PRPC generates the result screen.
As per above timing distribution, we can get the following table:
| Network transfer | PRPC Internal Execution | Application Related Execution |
| 0.64s | 1.56s | 1s |
This means, PRPC will also take quite a lot of time to process the request and generate the UI.
Also, PRPC internal execution timing will be impacted by the data volume and the HTML Property used in the streams.
5. Conclusion
- A simple search function will take at least 5 seconds under normal load volume. So 5 seconds should be the bottom line of the performance requirement. And additionally, for the functions with complicated business logic and will cause multiple times of DB execution, the performance requirement must be more than 8 seconds; for the search function on non-indexed columns, based on the data volume, 10~20 seconds are reasonable for PRPC.
So during the requirement discussion, the performance requirement must be put on the table, and get everybody's agreement. And additionally, function requirement should clearly define the columns which business users will use most frequently.
The non-functional requirement must include the performance requirement and get the signoff by business partner and clients. This will help for avoiding the further noise on the performance.
- In the stage of development, developers should use some tools to check the performance of codes. The tools include but not only PRPC Performance Tool, Toad or SQLPlus Explain Plan. As per my own experience, a function which called by user from the front-end should not run more than 0.5 second in development, otherwise it will be a risk for the performance in real production environment.
Also, developers and code reviewers should always check if deep nesting is there in system, or allocate memory in a huge loop, etc.
Again, in PRPC, use ListView with customized HTML Property to replace Repeat layout which will be very slow if there're more rows. If possible, avoid using DB connection in HTML Properties, if the HTML Property will be used in a list view.
- Estimate properly on server capacity with the timing returned by PRPC Performance tool or base on experience, and the performance requirement. Also please consider about the nature of business users like think time. If the capacity estimation shows in red, please make a decision as early as possible that revise the performance requirement, or use server cluster. Please don't forget the impact on system/software architecture for server cluster, especially for the functions sharing a same resource like hard disk.
The expression can be:
Max Concurrent User = Number of CPU * Performance Requirement / Function Timing
Max Active User = Max Concurrent User * Thinking Time
- It would be better add codes to record the execution timing for major activities. If possible, install a runtime performance monitor to the PRPC server, like Wily.
- Performance is quite critical today, and performance testing becomes more and more important. It will be very helpful to run a performance testing before system goes into production.
- Some factors which will impact performance are easily overlooked:
-
- Log file and PRPC Temp folder
– Store in NAS or SAN?
– Any other application uses disk very heavily?
-
- Usability
– If the default option can save unnecessary clicking?
– Does system give users a friendly presentation on bulk processing?
– Is the buttons on good position?
– Does the TAB move cursor logically?
-
- Auto refresh on regular basis
– Is it really required to use auto refresh? It will increase the number of active user.
– Can system use other approach to avoid auto refresh?


 320
320


 被折叠的 条评论
为什么被折叠?
被折叠的 条评论
为什么被折叠?
 到【灌水乐园】发言


