


 本文介绍如何利用Graphviz的dot语言快速绘制实体关系图(ERD)及网络架构图,通过实例展示了dot文件的编写方法,以及如何自动生成PNG格式的图表。
Using Graphviz dot for ERDs, network diagrams and more
I’ve mentioned Graphviz many a time on this blog. It’s simple to use, yet very powerful. The dot language is something that can be jotted down by hand in the simplest of all text editors, or generated programmatically.
The official website features a gallery, which demonstrates a wide range of graphs. But I still wanted to blog a few examples from my recent use.
First of all, for those of you who are not familiar with the simplicity of dot, here is the shortest possible example. Create a simple.dot file with the following content:
digraph G {
    Hello->World;
}
Now you can generate a PNG image with the graph like so:
$ dot -Tpng < simple.dot > simple.png
And here is how it looks:

Beautiful, isn’t it?
Well, now that you have an idea, let me show you a couple of things that I’ve been doing with it recently.
First, the Entity Relationship Diagrams (ERDs). There are, of course, specialized tools for drawing those, but I find it handy to sketch something quick, to discuss an idea with the team. Both the dot file and an image can be part of the project source, managed with version control software, build scripts, etc.
Here is a simple example. First, the code:
// Generate and preview PNG image with:
// dot -Tpng erd.dot > erd.png && eom erd.png
//
// You'll need Graphviz installed
digraph G {
    //
    // Defaults
    //

    // Box for entities
    node [shape=none, margin=0]

    // One-to-many relation (from one, to many)
    edge [arrowhead=crow, arrowtail=none, dir=both]

    //
    // Entities
    //
    Article [label=<
        <table border="0" cellborder="1" cellspacing="0" cellpadding="4">
            <tr><td bgcolor="lightblue">Article</td></tr>
            <tr><td align="left">id: int(11)</td></tr>
            <tr><td align="left">author: int(11)</td></tr>
            <tr><td align="left">title: varchar(255)</td></tr>
            <tr><td align="left">content: longtext</td></tr>
            <tr><td align="left">created: datetime</td></tr>
            <tr><td align="left">modified: datetime</td></tr>
        </table>
    >]

    Comment [label=<
        <table border="0" cellborder="1" cellspacing="0" cellpadding="4">
            <tr><td bgcolor="lightblue">Comment</td></tr>
            <tr><td align="left">id: int(11)</td></tr>
            <tr><td align="left">author: int(11)</td></tr>
            <tr><td align="left">content: longtext</td></tr>
            <tr><td align="left">created: datetime</td></tr>
            <tr><td align="left">modified: datetime</td></tr>
        </table>
    >]

    //
    // Relationships
    //
    Article->Comment;
}
And now how it comes out in the PNG format:

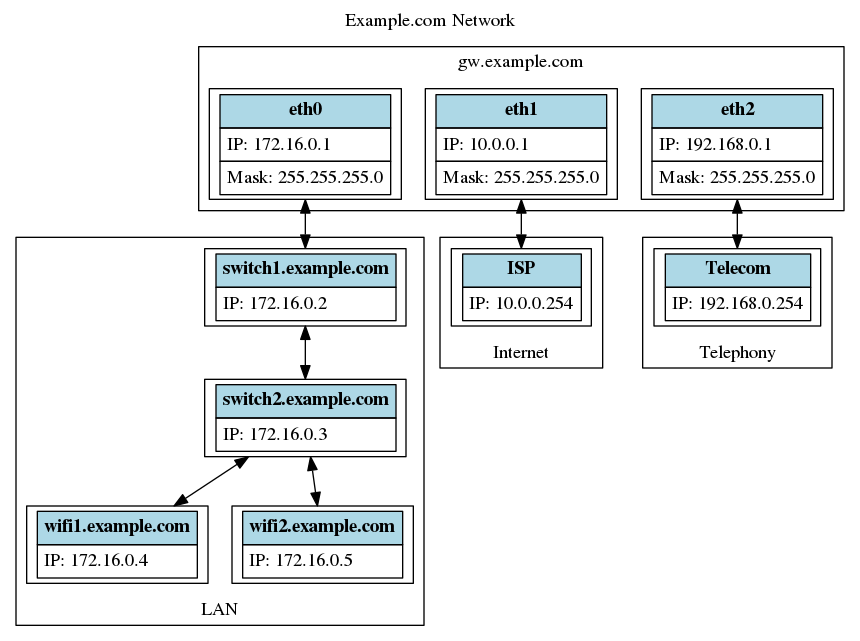
Secondly, infrastructure documentation. Very similar to the above, but now with clusters, that allow grouping of things. Here’s the example.com network setup:
digraph G {
    label = "Example.com Network"
    labelloc = top;

    node [shape=record];
    edge [dir=both];

    subgraph cluster_0 {
        label = "gw.example.com";

        eth0 [label=<
            <table border="0" cellborder="1" cellspacing="0" cellpadding="4">
                <tr><td bgcolor="lightblue"><b>eth0</b></td></tr>
                <tr><td align="left">IP: 172.16.0.1</td></tr>
                <tr><td align="left">Mask: 255.255.255.0</td></tr>
            </table>
        >];
        eth1 [label=<
            <table border="0" cellborder="1" cellspacing="0" cellpadding="4">
                <tr><td bgcolor="lightblue"><b>eth1</b></td></tr>
                <tr><td align="left">IP: 10.0.0.1</td></tr>
                <tr><td align="left">Mask: 255.255.255.0</td></tr>
            </table>
        >];
        eth2 [label=<
            <table border="0" cellborder="1" cellspacing="0" cellpadding="4">
                <tr><td bgcolor="lightblue"><b>eth2</b></td></tr>
                <tr><td align="left">IP: 192.168.0.1</td></tr>
                <tr><td align="left">Mask: 255.255.255.0</td></tr>
            </table>
        >];
    }

    subgraph cluster_1 {
        label = Internet;
        labelloc = bottom;
        InternetGW [label=<
            <table border="0" cellborder="1" cellspacing="0" cellpadding="4">
                <tr><td bgcolor="lightblue"><b>ISP</b></td></tr>
                <tr><td align="left">IP: 10.0.0.254</td></tr>
            </table>
        >];

    }

    subgraph cluster_2 {
        label = Telephony;
        labelloc = bottom;
        TelephonyGW [label=<
            <table border="0" cellborder="1" cellspacing="0" cellpadding="4">
                <tr><td bgcolor="lightblue"><b>Telecom</b></td></tr>
                <tr><td align="left">IP: 192.168.0.254</td></tr>
            </table>
        >];
    }

    subgraph cluster_3 {
        label = LAN;
        labelloc = bottom;

        sw1 [label=<
            <table border="0" cellborder="1" cellspacing="0" cellpadding="4">
                <tr><td bgcolor="lightblue"><b>switch1.example.com</b></td></tr>
                <tr><td align="left">IP: 172.16.0.2</td></tr>
            </table>
        >];

        sw2 [label=<
            <table border="0" cellborder="1" cellspacing="0" cellpadding="4">
                <tr><td bgcolor="lightblue"><b>switch2.example.com</b></td></tr>
                <tr><td align="left">IP: 172.16.0.3</td></tr>
            </table>
        >];

        ap1 [label=<
            <table border="0" cellborder="1" cellspacing="0" cellpadding="4">
                <tr><td bgcolor="lightblue"><b>wifi1.example.com</b></td></tr>
                <tr><td align="left">IP: 172.16.0.4</td></tr>
            </table>
        >];

        ap2 [label=<
            <table border="0" cellborder="1" cellspacing="0" cellpadding="4">
                <tr><td bgcolor="lightblue"><b>wifi2.example.com</b></td></tr>
                <tr><td align="left">IP: 172.16.0.5</td></tr>
            </table>
        >];

        sw1 -> sw2;
        sw2 -> ap1;
        sw2 -> ap2;
    }


    eth0 -> sw1;
    eth1 -> InternetGW;
    eth2 -> TelephonyGW;

}
And here is the result:
And as I said, you can automatically generate the dot files either completely or partially. In fact, I’ve done it a while back, when I was trying to make sense of a large CakePHP project. Have a look at this post (rather outdated now).


 被折叠的 条评论
为什么被折叠?
被折叠的 条评论
为什么被折叠?
 到【灌水乐园】发言


