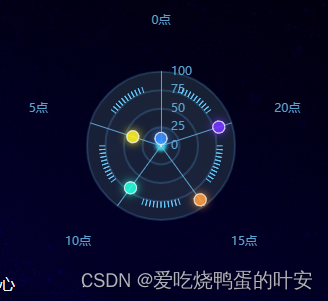
echarts雷达图圆形 组件封装 配置参数详解

效果图:
在这里插入图片描述
雷达图组件封装RadarChart.vue
配置参数代码中有备注

<template>
  <div :class="className" :style="{height:height,width:width}" />
</template>

<script>
import echarts from 'echarts'
require('echarts/theme/macarons') // echarts theme
import resize from './mixins/resize'

const animationDuration = 6000
const color = ['#3c90ff', '#fff225', '#24ffdf', '#ff9c3c', '#7536ff']

export default {
  mixins: [resize],
  props: {
    className: {
      type: String,
      default: 'chart'
    },
    width: {
      type: String,
      default: '100%'
    },
    height: {
      type: String,
      default: '300px'
    },
    chartData: {
      type: Object,
      required: true
    }
    
  },
  data() {
    return {
      chart: null
    }
  },
  mounted() {
    // this.$nextTick(() => {
    //   this.initChart()
    // })
    setTimeout(()=>{
      this.initChart()
    },400)
  },
  beforeDestroy() {
    if (!this.chart) {
      return
    }
    this.chart.dispose()
    this.chart = null
  },
  methods: {
    initChart() {
      this.chart = echarts.init(this.$el, 'macarons')
      this.setOptions(this.chartData)
    },
    setOptions({ indicatorData } = {}) {
      this.chart.setOption({
        backgroundColor: 'transparent',//整体背景颜色
        polar: {
            center: ['50%', '55%'],
            radius: '60%'
        },
        radar: {
            shape: 'circle',
            center: ['50%', '55%'],
            radius: '60%',
            indicator: indicatorData || [
                {
                    text: '0点',
                    min: 0,
                    max: 100
                },
                {
                    text: '5点',
                    min: 0,
                    max: 100
                },
                {
                    text: '10点',
                    min: 0,
                    max: 100
                },
                {
                    text: '15点',
                    min: 0,
                    max: 100
                },
                {
                    text: '20点',
                    min: 0,
                    max: 100
                }
            ],
            axisName: {
                color: '#b7e9fd',
                fontSize: 24,
                padding: -10
            },
            nameGap: 45,
            splitNumber: 4,
            splitArea: {
                // 坐标轴在 grid 区域中的分隔区域,默认不显示。
                show: true,
                areaStyle: {
                    // 分隔区域的样式设置。
                    color: ['rgba(27, 50, 66, 0.4)']
                }
            },
            axisLine: {
                //指向外圈文本的分隔线样式
                lineStyle: {
                    color: '#5aa3d0'
                }
            },
            splitLine: {
                lineStyle: {
                    color: 'rgba(99,192,251,0.2)', // 分隔线颜色
                    width: 2 // 分隔线线宽
                }
            }
        },
        angleAxis: {
            type: 'category',
            data: name,
            minInterval: 1,
            boundaryGap: false,
            clockwise: false,
            axisTick: {
                show: false
            },
            axisLabel: {
                show: false
            },
            axisLine: {
                show: false
            },
            splitLine: {
                show: false
            }
        },
        radiusAxis: {
            min: 0,
            max: 100,
            interval: 25,
            splitLine: {
                show: false
            },
            axisTick: {
                show: false
            },
            axisLine: {
                //指向外圈文本的分隔线样式
                lineStyle: {
                    color: '#5aa3d0'
                }
            },
            axisLabel: {
                fontSize: 12,
                color: '#5aa3d0',
                align: 'left',
                margin: -10
            }
        },
        series: [
            this.setgauge(0),
            this.setgauge(1),
            this.setgauge(2),
            this.setgauge(3),
            this.setgauge(4),
            {
                type: 'radar',
                silent: true,
                lineStyle: {
                    color: '#66ffff'
                },
                areaStyle: {
                    color: 'rgba(102, 255, 255, 0.31)'
                },
                data: this.setData()
            },
            {
                type: 'scatter',
                coordinateSystem: 'polar',
                symbolSize: 12,//原点大小
                data: this.setSpot()
            }
        ]
      })
    },
    setData() {
      return [
          {
              value: this.chartData.seriesData,
              itemStyle: {
                  normal: {
                      lineStyle: {
                          color: '#4BFFFC',
                          shadowColor: '#4BFFFC',
                          shadowBlur: 5
                      },
                      shadowColor: '#4BFFFC',
                      shadowBlur: 5
                  }
              },
              areaStyle: {
                  normal: {
                      // 单项区域填充样式
                      color: {
                          type: 'radial',
                          x: 0.5, //右
                          y: 0.5, //下
                          r: 1,
                          colorStops: [
                              {
                                  offset: 1,
                                  color: '#4BFFFC'
                              },
                              {
                                  offset: 0,
                                  color: 'rgba(0,0,0,0)'
                              }
                          ],
                          globalCoord: false
                      },
                      opacity: 0.8 // 区域透明度
                  }
              }
          }
      ]
    },

  setgauge(i) {
      return {
          type: 'gauge',
          detail: false,
          splitNumber: 10, //刻度数量
          radius: '50%', //图表尺寸
          center: ['50%', '55%'],
          startAngle: 90 + 72 * i + 18, //开始刻度的角度
          endAngle: 90 + 72 * (i + 1) - 18, //结束刻度的角度
          axisLine: {
              show: false
          },
          axisTick: {
              show: true,
              lineStyle: {
                  color: '#66ccff',
                  width: 1
              },
              length: 6,
              splitNumber: 1
          },
          splitLine: {
              show: false
          },
          axisLabel: {
              show: false
          }
      }
  },
  setSpot() {
      var scatterData = []
      this.chartData.data.map((o, i) => {
          scatterData.push({
              value: [o, i],
              itemStyle: {
                  normal: {
                      color: color[i],
                      borderColor: '#fff',
                      borderWidth: 1,
                      shadowColor: color[i],
                      shadowBlur: 8
                  }
              }
          })
      })
      return scatterData
  }
    
  }
}
</script>

使用组件:
引入:

import RadarChart from '@/views/my_components/charts/RadarChart.vue'

注册

components: { RadarChart }

使用:

<RadarChart :chartData='radarChartDataInfo' height="37%"/>

data数据

radarChartDataInfo: {
         // indicatorData: [
         //     {
         //         text: 'a',
         //         min: 0,
         //         max: 100
         //     },
         //     {
         //         text: 'b',
         //         min: 0,
         //         max: 100
         //     },
         //     {
         //         text: 'c',
         //         min: 0,
         //         max: 100
         //     },
         //     {
         //         text: 'd',
         //         min: 0,
         //         max: 100
         //     },
         //     {
         //         text: 'e',
         //         min: 0,
         //         max: 100
         //     }
         // ],
         data: [10,40,70,90,82]
}
  • 0
    点赞
  • 1
    收藏
    觉得还不错? 一键收藏
  • 0
    评论

“相关推荐”对你有帮助么?

  • 非常没帮助
  • 没帮助
  • 一般
  • 有帮助
  • 非常有帮助
提交
评论
添加红包

请填写红包祝福语或标题

红包个数最小为10个

红包金额最低5元

当前余额3.43前往充值 >
需支付:10.00
成就一亿技术人!
领取后你会自动成为博主和红包主的粉丝 规则
hope_wisdom
发出的红包
实付
使用余额支付
点击重新获取
扫码支付
钱包余额 0

抵扣说明:

1.余额是钱包充值的虚拟货币,按照1:1的比例进行支付金额的抵扣。
2.余额无法直接购买下载,可以购买VIP、付费专栏及课程。

余额充值