


http://www.cnblogs.com/rootq/archive/2008/09/06/1285779.html
ORACLE 执行计划分析
An explain plan is a representation of the access path that is taken when a query is executed within Oracle.
二、如何访问数据
At the physical level Oracle reads blocks of data. The smallest amount of data read is a single Oracle block, the largest is constrained by operating system limits (and multiblock i/o). Logically Oracle finds the data to read by using the following methods:
Full Table Scan (FTS) --全表扫描
Index Lookup (unique & non-unique) --索引扫描(唯一和非唯一)
Rowid --物理行id
三、执行计划层次关系
When looking at a plan, the rightmost (ie most inndented) uppermost operation is the first thing that is executed. --采用最右最上最先执行的原则看层次关系,在同一级如果某个动作没有子ID就最先执行
1.看一个简单的例子:
Query Plan
-----------------------------------------
SELECT STATEMENT [CHOOSE] Cost=1234
**TABLE ACCESS FULL LARGE [:Q65001] [ANALYZED] --[:Q65001]表示是并行方式,[ANALYZED]表示该对象已经分析过了
优化模式是CHOOSE的情况下,看Cost参数是否有值来决定采用CBO还是RBO:
SELECT STATEMENT [CHOOSE] Cost=1234 --Cost有值,采用CBO
SELECT STATEMENT [CHOOSE] Cost= --Cost为空,采用RBO
2.层次的父子关系,看比较复杂的例子:
PARENT1
**FIRST CHILD
****FIRST GRANDCHILD
**SECOND CHILD
Here the same principles apply, the FIRST GRANDCHILD is the initial operation then the FIRST CHILD followed by the SECOND CHILD and finally the PARENT collates the output.
四、例子解说
Execution Plan
----------------------------------------------------------
0 **SELECT STATEMENT Optimizer=CHOOSE (Cost=3 Card=8 Bytes=248)
1 0 **HASH JOIN (Cost=3 Card=8 Bytes=248)
2 1 ****TABLE ACCESS (FULL) OF 'DEPT' (Cost=1 Card=3 Bytes=36)
3 1 ****TABLE ACCESS (FULL) OF 'EMP' (Cost=1 Card=16 Bytes=304)
左侧的两排数据,前面的是序列号ID,后面的是对应的PID(父ID)。
A shortened summary of this is:
Execution starts with ID=0: SELECT STATEMENT but this is dependand on it's child objects
So it executes its first child step: ID=1 PID=0 HASH JOIN but this is dependand on it's child objects
So it executes its first child step: ID=2 PID=1 TABLE ACCESS (FULL) OF 'DEPT'
Then the second child step: ID=3 PID=2 TABLE ACCESS (FULL) OF 'EMP'
Rows are returned to the parent step(s) until finished
五、表访问方式
1.Full Table Scan (FTS) 全表扫描
In a FTS operation, the whole table is read up to the high water mark (HWM). The HWM marks the last block in the table that has ever had data written to it. If you have deleted all the rows then you will still read up to the HWM. Truncate resets the HWM back to the start of the table. FTS uses multiblock i/o to read the blocks from disk. --全表扫描模式下会读数据到表的高水位线(HWM即表示表曾经扩展的最后一个数据块),读取速度依赖于Oracle初始化参数db_block_multiblock_read_count
Query Plan
------------------------------------
SELECT STATEMENT [CHOOSE] Cost=1
**INDEX UNIQUE SCAN EMP_I1 --如果索引里就找到了所要的数据,就不会再去访问表了
There are 5 methods of index lookup:
index unique scan --索引唯一扫描
Method for looking up a single key value via a unique index. always returns a single value, You must supply AT LEAST the leading column of the index to access data via the index.
eg:
SQL> explain plan for select empno,ename from emp where empno=10;
index range scan --索引局部扫描
Index range scan is a method for accessing a range values of a particular column. AT LEAST the leading column of the index must be supplied to access data via the index. Can be used for range operations (e.g. > < <> >= <= between) .
eg:
SQL> explain plan for select mgr from emp where mgr = 5;
index full scan --索引全局扫描
Full index scans are only available in the CBO as otherwise we are unable to determine whether a full scan would be a good idea or not. We choose an index Full Scan when we have statistics that indicate that it is going to be more efficient than a Full table scan and a sort. For example we may do a Full index scan when we do an unbounded scan of an index and want the data to be ordered in the index order.
eg:
SQL> explain plan for select empno,ename from big_emp order by empno,ename;
index fast full scan --索引快速全局扫描,不带order by情况下常发生
Scans all the block in the index, Rows are not returned in sorted order, Introduced in 7.3 and requires V733_PLANS_ENABLED=TRUE and CBO, may be hinted using INDEX_FFS hint, uses multiblock i/o, can be executed in parallel, can be used to access second column of concatenated indexes. This is because we are selecting all of the index.
eg:
SQL> explain plan for select empno,ename from big_emp;
index skip scan --索引跳跃扫描,where条件列是非索引的前导列情况下常发生
Index skip scan finds rows even if the column is not the leading column of a concatenated index. It skips the first column(s) during the search.
eg:
SQL> create index i_emp on emp(empno, ename);
SQL> select /*+ index_ss(emp i_emp)*/ job from emp where ename='SMITH';
3.Rowid 物理ID扫描
This is the quickest access method available.Oracle retrieves the specified block and extracts the rows it is interested in. --Rowid扫描是最快的访问数据方式
六、表连接方式
有三种连接方式:
1.Sort Merge Join (SMJ) --由于sort是非常耗资源的,所以这种连接方式要避免
Rows are produced by Row Source 1 and are then sorted Rows from Row Source 2 are then produced and sorted by the same sort key as Row Source 1. Row Source 1 and 2 are NOT accessed concurrently.
SQL> explain plan for
select /*+ ordered */ e.deptno,d.deptno
from emp e,dept d
where e.deptno = d.deptno
order by e.deptno,d.deptno;
Query Plan
-------------------------------------
SELECT STATEMENT [CHOOSE] Cost=17
**MERGE JOIN
****SORT JOIN
******TABLE ACCESS FULL EMP [ANALYZED]
****SORT JOIN
******TABLE ACCESS FULL DEPT [ANALYZED]
Sorting is an expensive operation, especially with large tables. Because of this, SMJ is often not a particularly efficient join method.
2.Nested Loops (NL) --比较高效的一种连接方式
Fetches the first batch of rows from row source 1, Then we probe row source 2 once for each row returned from row source 1.
For nested loops to be efficient it is important that the first row source returns as few rows as possible as this directly controls the number of probes of the second row source. Also it helps if the access method for row source 2 is efficient as this operation is being repeated once for every row returned by row source 1.
SQL> explain plan for
select a.dname,b.sql
from dept a,emp b
where a.deptno = b.deptno;
Query Plan
-------------------------
SELECT STATEMENT [CHOOSE] Cost=5
**NESTED LOOPS
****TABLE ACCESS FULL DEPT [ANALYZED]
****TABLE ACCESS FULL EMP [ANALYZED]
3.Hash Join --最为高效的一种连接方式
New join type introduced in 7.3, More efficient in theory than NL & SMJ, Only accessible via the CBO. Smallest row source is chosen and used to build a hash table and a bitmap The second row source is hashed and checked against the hash table looking for joins. The bitmap is used as a quick lookup to check if rows are in the hash table and are especially useful when the hash table is too large to fit in memory.
SQL> explain plan for
select /*+ use_hash(emp) */ empno
from emp,dept
where emp.deptno = dept.deptno;
Query Plan
----------------------------
SELECT STATEMENT [CHOOSE] Cost=3
**HASH JOIN
****TABLE ACCESS FULL DEPT
****TABLE ACCESS FULL EMP
Hash joins are enabled by the parameter HASH_JOIN_ENABLED=TRUE in the init.ora or session. TRUE is the default in 7.3.
3.Cartesian Product --卡迪尔积,不算真正的连接方式,sql肯定写的有问题
A Cartesian Product is done where they are no join conditions between 2 row sources and there is no alternative method of accessing the data. Not really a join as such as there is no join! Typically this is caused by a coding mistake where a join has been left out.
It can be useful in some circumstances - Star joins uses cartesian products.Notice that there is no join between the 2 tables:
SQL> explain plan for
select emp.deptno,dept,deptno
from emp,dept
Query Plan
------------------------------
SLECT STATEMENT [CHOOSE] Cost=5
**MERGE JOIN CARTESIAN
****TABLE ACCESS FULL DEPT
****SORT JOIN
******TABLE ACCESS FULL EMP
The CARTESIAN keyword indicate that we are doing a cartesian product.
七、运算符
1.sort --排序,很消耗资源
There are a number of different operations that promote sorts:
order by clauses
group by
sort merge join
2.filter --过滤,如not in、min函数等容易产生
Has a number of different meanings, used to indicate partition elimination, may also indicate an actual filter step where one row source is filtering, another, functions such as min may introduce filter steps into query plans.
3.view --视图,大都由内联视图产生
When a view cannot be merged into the main query you will often see a projection view operation. This indicates that the 'view' will be selected from directly as opposed to being broken down into joins on the base tables. A number of constructs make a view non mergeable. Inline views are also non mergeable.
eg:
SQL> explain plan for
select ename,tot
from emp,(select empno,sum(empno) tot from big_emp group by empno) tmp
where emp.empno = tmp.empno;
Query Plan
------------------------
SELECT STATEMENT [CHOOSE]
**HASH JOIN
**TABLE ACCESS FULL EMP [ANALYZED]
**VIEW
****SORT GROUP BY
******INDEX FULL SCAN BE_IX
4.partition view --分区视图
Partition views are a legacy technology that were superceded by the partitioning option. This section of the article is provided as reference for such legacy systems.
看懂执行计划也就成了SQL优化的先决条件。 这里的SQL优化指的是SQL性能问题的定位,定位后就可以解决问题。
一. 查看执行计划的三种方法
1.1 设置autotrace
| 序号 | 命令 | 解释 |
| 1 | SET AUTOTRACE OFF | 此为默认值,即关闭Autotrace |
| 2 | SET AUTOTRACE ON EXPLAIN | 只显示执行计划 |
| 3 | SET AUTOTRACE ON STATISTICS | 只显示执行的统计信息 |
| 4 | SET AUTOTRACE ON | 包含2,3两项内容 |
| 5 | SET AUTOTRACE TRACEONLY | 与ON相似,但不显示语句的执行结果 |
SQL> set autotrace on
SQL> select * from dave;
ID NAME
---------- ----------
8 安庆
1 dave
2 bl
1 bl
2 dave
3 dba
4 sf-express
5 dmm
已选择8行。
执行计划
----------------------------------------------------------
Plan hash value: 3458767806
--------------------------------------------------------------------------
| Id | Operation | Name | Rows | Bytes | Cost (%CPU)| Time |
--------------------------------------------------------------------------
| 0 | SELECT STATEMENT | | 8 | 64 | 2 (0)| 00:00:01 |
| 1 | TABLE ACCESS FULL| DAVE | 8 | 64 | 2 (0)| 00:00:01 |
--------------------------------------------------------------------------
统计信息
----------------------------------------------------------
0 recursive calls
0 db block gets
4 consistent gets
0 physical reads
0 redo size
609 bytes sent via SQL*Net to client
416 bytes received via SQL*Net from client
2 SQL*Net roundtrips to/from client
0 sorts (memory)
0 sorts (disk)
8 rows processed
SQL>
1.2 使用SQL
SQL>EXPLAIN PLAN FOR sql语句;
SQL>SELECT plan_table_output FROM TABLE(DBMS_XPLAN.DISPLAY('PLAN_TABLE'));
示例:
SQL> EXPLAIN PLAN FOR SELECT * FROM DAVE;
已解释。
SQL> SELECT plan_table_output FROM TABLE(DBMS_XPLAN.DISPLAY('PLAN_TABLE'));
或者:
SQL> select * from table(dbms_xplan.display);
PLAN_TABLE_OUTPUT
--------------------------------------------------------------------------------
Plan hash value: 3458767806
--------------------------------------------------------------------------
| Id | Operation | Name | Rows | Bytes | Cost (%CPU)| Time |
--------------------------------------------------------------------------
| 0 | SELECT STATEMENT | | 8 | 64 | 2 (0)| 00:00:01 |
| 1 | TABLE ACCESS FULL| DAVE | 8 | 64 | 2 (0)| 00:00:01 |
--------------------------------------------------------------------------
已选择8行。
执行计划
----------------------------------------------------------
Plan hash value: 2137789089
--------------------------------------------------------------------------------
| Id | Operation | Name | Rows | Bytes | Cost (%CPU)| Time |
---------------------------------------------------------------------------------------------
| 0 | SELECT STATEMENT | | 8168 | 16336 | 29 (0)| 00:00:01 |
| 1 | COLLECTION ITERATOR PICKLER FETCH| DISPLAY | 8168 | 16336 | 29 (0)| 00:00:01 |
---------------------------------------------------------------------------------------------
统计信息
----------------------------------------------------------
25 recursive calls
12 db block gets
168 consistent gets
0 physical reads
0 redo size
974 bytes sent via SQL*Net to client
416 bytes received via SQL*Net from client
2 SQL*Net roundtrips to/from client
1 sorts (memory)
0 sorts (disk)
8 rows processed
SQL>
1.3 使用Toad,PL/SQL Developer工具
二. Cardinality(基数)/ rows
Cardinality值表示CBO预期从一个行源(row source)返回的记录数,这个行源可能是一个表,一个索引,也可能是一个子查询。 在Oracle 9i中的执行计划中,Cardinality缩写成Card。 在10g中,Card值被rows替换。
这是9i的一个执行计划,我们可以看到关键字Card:
执行计划
----------------------------------------------------------
0 SELECT STATEMENT Optimizer=CHOOSE (Cost=2 Card=1 Bytes=402)
1 0 TABLE ACCESS (FULL) OF 'TBILLLOG8' (Cost=2 Card=1 Bytes=402)
Oracle 10g的执行计划,关键字换成了rows:
执行计划
----------------------------------------------------------
Plan hash value: 2137789089
--------------------------------------------------------------------------------
| Id | Operation | Name | Rows | Bytes | Cost (%CPU)| Time |
---------------------------------------------------------------------------------------------
| 0 | SELECT STATEMENT | | 8168 | 16336 | 29 (0)| 00:00:01 |
| 1 | COLLECTION ITERATOR PICKLER FETCH| DISPLAY | 8168 | 16336 | 29 (0)| 00:00:01 |
---------------------------------------------------------------------------------------------
Cardinality的值对于CBO做出正确的执行计划来说至关重要。 如果CBO获得的Cardinality值不够准确(通常是没有做分析或者分析数据过旧造成),在执行计划成本计算上就会出现偏差,从而导致CBO错误的制定出执行计划。
在多表关联查询或者SQL中有子查询时,每个关联表或子查询的Cardinality的值对主查询的影响都非常大,甚至可以说,CBO就是依赖于各个关联表或者子查询Cardinality值计算出最后的执行计划。
对于多表查询,CBO使用每个关联表返回的行数(Cardinality)决定用什么样的访问方式来做表关联(如Nested loops Join 或 hash Join)。
多表连接的三种方式详解 HASH JOIN MERGE JOIN NESTED LOOP
http://blog.csdn.net/tianlesoftware/archive/2010/08/20/5826546.aspx
对于子查询,它的Cardinality将决定子查询是使用索引还是使用全表扫描的方式访问数据。
三. SQL 的执行计划
生成SQL的执行计划是Oracle在对SQL做硬解析时的一个非常重要的步骤,它制定出一个方案告诉Oracle在执行这条SQL时以什么样的方式访问数据:索引还是全表扫描,是Hash Join还是Nested loops Join等。 比如说某条SQL通过使用索引的方式访问数据是最节省资源的,结果CBO作出的执行计划是全表扫描,那么这条SQL的性能必然是比较差的。
Oracle SQL的硬解析和软解析
http://blog.csdn.net/tianlesoftware/archive/2010/04/08/5458896.aspx
示例:
SQL> SET AUTOTRACE TRACEONLY; -- 只显示执行计划,不显示结果集
SQL> select * from scott.emp a,scott.emp b where a.empno=b.mgr;
已选择13行。
执行计划
----------------------------------------------------------
Plan hash value: 992080948
---------------------------------------------------------------------------------------
| Id | Operation | Name | Rows | Bytes | Cost (%CPU)| Time |
---------------------------------------------------------------------------------------
| 0 | SELECT STATEMENT | | 13 | 988 | 6 (17)| 00:00:01 |
| 1 | MERGE JOIN | | 13 | 988 | 6 (17)| 00:00:01 |
| 2 | TABLE ACCESS BY INDEX ROWID| EMP | 14 | 532 | 2 (0)| 00:00:01 |
| 3 | INDEX FULL SCAN | PK_EMP | 14 | | 1 (0)| 00:00:01 |
|* 4 | SORT JOIN | | 13 | 494 | 4 (25)| 00:00:01 |
|* 5 | TABLE ACCESS FULL | EMP | 13 | 494 | 3 (0)| 00:00:01 |
---------------------------------------------------------------------------------------
Predicate Information (identified by operation id):
---------------------------------------------------
4 - access("A"."EMPNO"="B"."MGR")
filter("A"."EMPNO"="B"."MGR")
5 - filter("B"."MGR" IS NOT NULL)
统计信息
----------------------------------------------------------
0 recursive calls
0 db block gets
11 consistent gets
0 physical reads
0 redo size
2091 bytes sent via SQL*Net to client
416 bytes received via SQL*Net from client
2 SQL*Net roundtrips to/from client
1 sorts (memory)
0 sorts (disk)
13 rows processed
SQL>
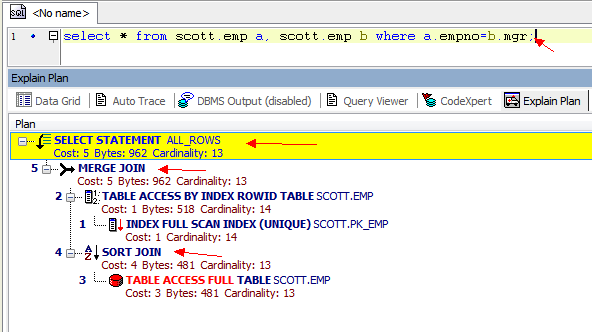
图片是Toad工具查看的执行计划。 在Toad 里面,很清楚的显示了执行的顺序。 但是如果在SQLPLUS里面就不是那么直接。 但我们也可以判断:一般按缩进长度来判断,缩进最大的最先执行,如果有2行缩进一样,那么就先执行上面的。
3.1 执行计划中字段解释:
ID: 一个序号,但不是执行的先后顺序。执行的先后根据缩进来判断。
Operation: 当前操作的内容。
Rows: 当前操作的Cardinality,Oracle估计当前操作的返回结果集。
Cost(CPU):Oracle 计算出来的一个数值(代价),用于说明SQL执行的代价。
Time:Oracle 估计当前操作的时间。
3.2 谓词说明:
Predicate Information (identified by operation id):
---------------------------------------------------
4 - access("A"."EMPNO"="B"."MGR")
filter("A"."EMPNO"="B"."MGR")
5 - filter("B"."MGR" IS NOT NULL)
Access: 表示这个谓词条件的值将会影响数据的访问路劲(表还是索引)。
Filter:表示谓词条件的值不会影响数据的访问路劲,只起过滤的作用。
在谓词中主要注意access,要考虑谓词的条件,使用的访问路径是否正确。
3.3 统计信息说明:
db block gets : 从buffer cache中读取的block的数量
consistent gets: 从buffer cache中读取的undo数据的block的数量
physical reads: 从磁盘读取的block的数量
redo size: DML生成的redo的大小
sorts (memory) :在内存执行的排序量
sorts (disk) :在磁盘上执行的排序量
Physical Reads通常是我们最关心的,如果这个值很高,说明要从磁盘请求大量的数据到Buffer Cache里,通常意味着系统里存在大量全表扫描的SQL语句,这会影响到数据库的性能,因此尽量避免语句做全表扫描,对于全表扫描的SQL语句,建议增 加相关的索引,优化SQL语句来解决。
关于physical reads ,db block gets 和consistent gets这三个参数之间有一个换算公式:
数据缓冲区的使用命中率=1 - ( physical reads / (db block gets + consistent gets) )。
用以下语句可以查看数据缓冲区的命中率:
SQL>SELECT name, value FROM v$sysstat WHERE name IN ('db block gets', 'consistent gets','physical reads');
查询出来的结果Buffer Cache的命中率应该在90%以上,否则需要增加数据缓冲区的大小。
Recursive Calls: Number of recursive calls generated at both the user and system level.
Oracle Database maintains tables used for internal processing. When it needs to change these tables, Oracle Database generates an internal SQL statement, which in turn generates a recursive call. In short, recursive calls are basically SQL performed on behalf of your SQL. So, if you had to parse the query, for example, you might have had to run some other queries to get data dictionary information. These would be recursive calls. Space management, security checks, calling PL/SQL from SQL—all incur recursive SQL calls。
DB Block Gets: Number of times a CURRENT block was requested.
Current mode blocks are retrieved as they exist right now, not in a consistent read fashion. Normally, blocks retrieved for a query are retrieved as they existed when the query began. Current mode blocks are retrieved as they exist right now, not from a previous point in time. During a SELECT, you might see current mode retrievals due to reading the data dictionary to find the extent information for a table to do a full scan (because you need the "right now" information, not the consistent read). During a modification, you will access the blocks in current mode in order to write to them. (DB Block Gets:请求的数据块在buffer能满足的个数)
当前模式块意思就是在操作中正好提取的块数目,而不是在一致性读的情况下而产生的块数。正常的情况下,一个查询提取的块是在查询开始的那个时间点上存在的数据块,当前块是在这个时刻存在的数据块,而不是在这个时间点之前或者之后的数据块数目。
Consistent Gets: Number of times a consistent read was requested for a block.
This is how many blocks you processed in "consistent read" mode. This will include counts of blocks read from the rollback segment in order to roll back a block. This is the mode you read blocks in with a SELECT, for example. Also, when you do a searched UPDATE/DELETE, you read the blocks in consistent read mode and then get the block in current mode to actually do the modification. (Consistent Gets: 数据请求总数在回滚段Buffer中的数据一致性读所需要的数据块)
这里的概念是在处理你这个操作的时候需要在一致性读状态上处理多少个块,这些块产生的主要原因是因为由于在你查询的过程中,由于其他会话对数据块进行操 作,而对所要查询的块有了修改,但是由于我们的查询是在这些修改之前调用的,所以需要对回滚段中的数据块的前映像进行查询,以保证数据的一致性。这样就产 生了一致性读。
Physical Reads: Total number of data blocks read from disk. This number equals the value of "physical reads direct" plus all reads into buffer cache. (Physical Reads:实例启动后,从磁盘读到Buffer Cache数据块数量)
就是从磁盘上读取数据块的数量,其产生的主要原因是:
(1) 在数据库高速缓存中不存在这些块
(2) 全表扫描
(3) 磁盘排序
它们三者之间的关系大致可概括为:
逻辑读指的是Oracle从内存读到的数据块数量。一般来说是'consistent gets' + 'db block gets'。当在内存中找不到所需的数据块的话就需要从磁盘中获取,于是就产生了'physical reads'。
Sorts(disk):
Number of sort operations that required at least one disk write. Sorts that require I/O to disk are quite resource intensive. Try increasing the size of the initialization parameter SORT_AREA_SIZE.
bytes sent via SQL*Net to client:
Total number of bytes sent to the client from the foreground processes.
bytes received via SQL*Net from client:
Total number of bytes received from the client over Oracle Net.
SQL*Net roundtrips to/from client:
Total number of Oracle Net messages sent to and received from the client.
更多内容参考Oracle联机文档:
Statistics Descriptions
http://download.oracle.com/docs/cd/E11882_01/server.112/e10820/stats002.htm#i375475
3.4 动态分析
如果在执行计划中有如下提示:
Note
------------
-dynamic sampling used for the statement
这提示用户CBO当前使用的技术,需要用户在分析计划时考虑到这些因素。 当出现这个提示,说明当前表使用了动态采样。 我们从而推断这个表可能没有做过分析。
这里会出现两种情况:
(1) 如果表没有做过分析,那么CBO可以通过动态采样的方式来获取分析数据,也可以或者正确的执行计划。
(2) 如果表分析过,但是分析信息过旧,这时CBO就不会在使用动态采样,而是使用这些旧的分析数据,从而可能导致错误的执行计划。
总结:
在看执行计划的时候,除了看执行计划本身,还需要看谓词和提示信息。 通过整体信息来判断SQL 效率。
整理自网络
------------------------------------------------------------------------------
Blog: http://blog.csdn.net/tianlesoftware
网上资源: http://tianlesoftware.download.csdn.net
相关视频:http://blog.csdn.net/tianlesoftware/archive/2009/11/27/4886500.aspx
DBA1 群:62697716(满); DBA2 群:62697977(满)
DBA3 群:63306533; 聊天 群:40132017


 3958
3958

 被折叠的 条评论
为什么被折叠?
被折叠的 条评论
为什么被折叠?
 到【灌水乐园】发言


