


 文章介绍了如何利用heatmap.js库在Cesium中生成热力图,包括将经纬度数据转换为像素坐标,并展示了两种在Cesium中加载热力图的方法。作者提供了一个自定义的Heatmap类,用于处理数据和渲染。此外,还提及了三维热力图的实现,强调了顶点坐标和顶点缓冲区构建的重要性。
最近整理了下手上的代码,重写了热力图的类。
先阐释下原理,使用了heatmap.js这个库,这个库生成的热力图是用canvas绘制的,那么在Cesium中,我们只要将canvas转图片,当初材质贴到我们的对象上就行。
其中Cesium加载热力图canvas生成的图片有两种方式,第一种是通过material来贴到entity或者geometry上,第二种是通过imageryprovider当作图层来加入,目前我这边以第一种方式来引入。
以下是效果:
体验传送门:功能体验
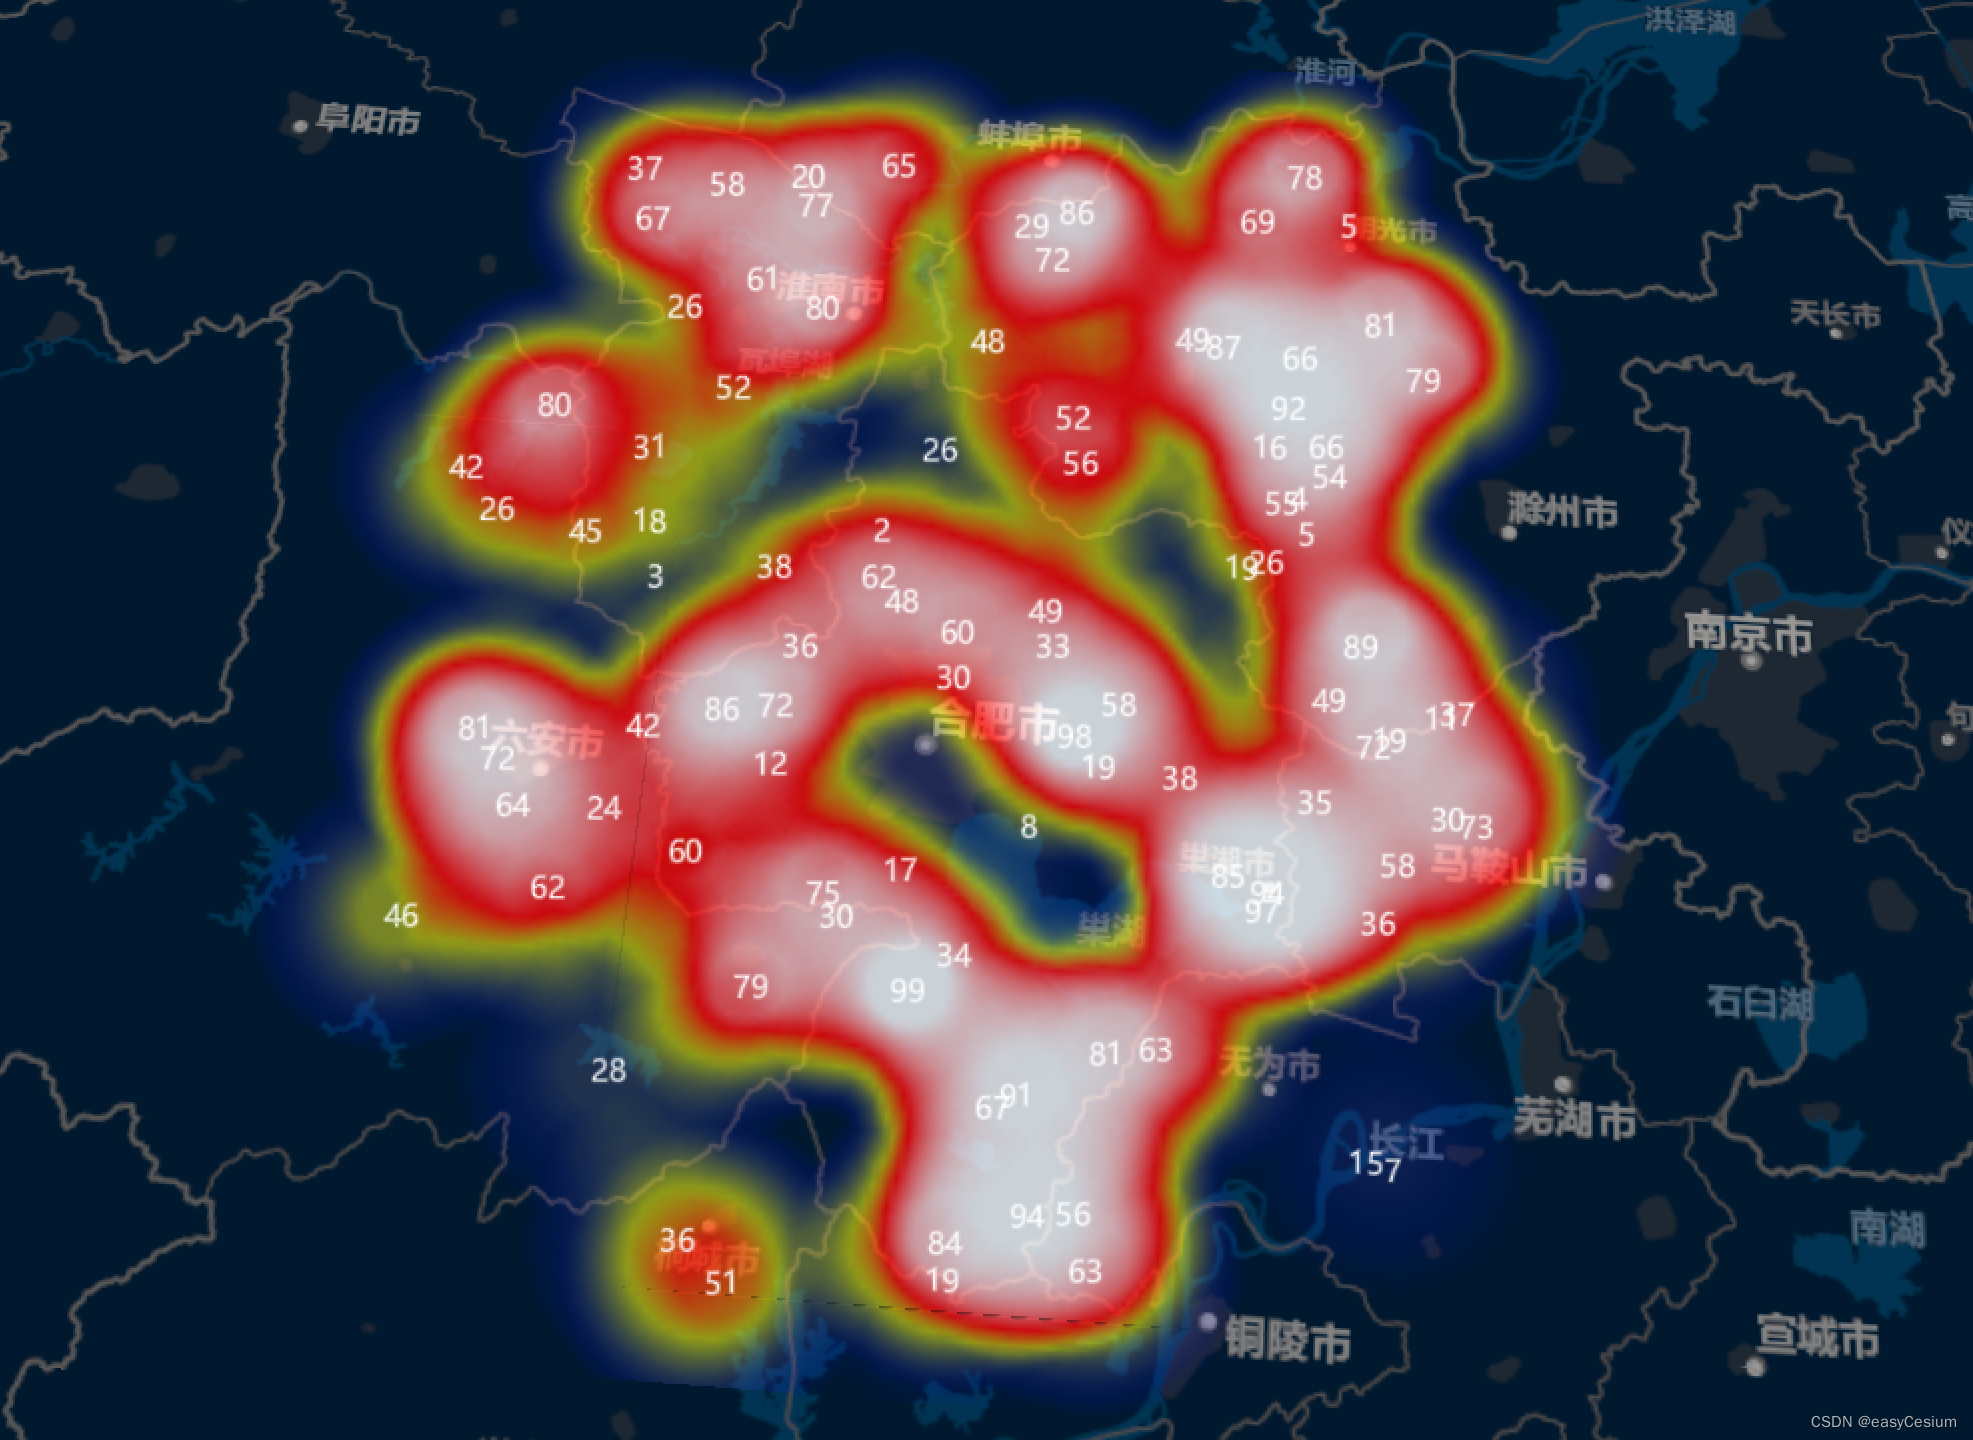
上面的数字是我模拟的各个点位的值。
因为heatmap.js生成热力图时,传入的数据是:素坐标 + 该坐标对应的值,如下: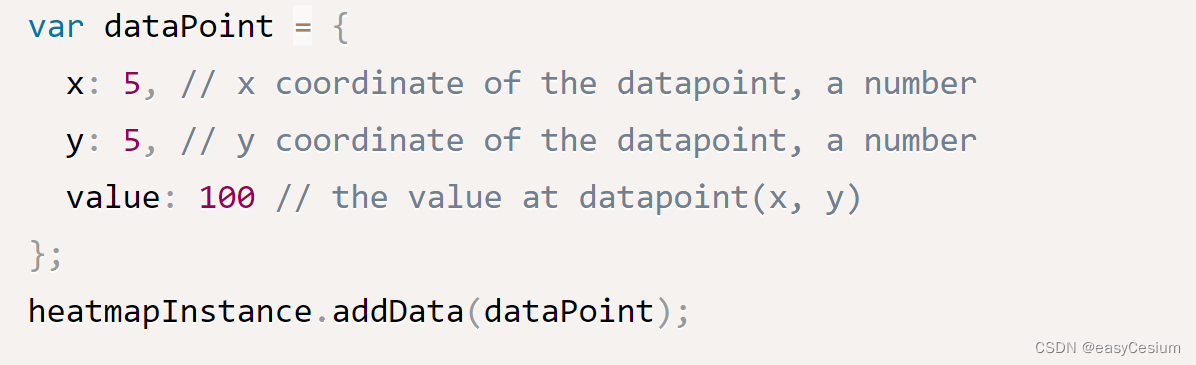
而我们三维中一般遇到的数据是:经纬度+经纬度对应的值 ,那么我们要做地图上的热力图就得做个经纬度到像素坐标的换算。
以下为全部代码:
 class Heatmap {
        constructor(viewer, opt) {
            this.viewer = viewer;
            this.opt = opt || {};
            this.list = this.opt.list || [];
            if (!this.list || this.list.length < 2) {
                console.log("热力图点位不得少于3个!");
                return;
            }
            this.dom = undefined;
            this.id = Number((new Date()).getTime() + "" + Number(Math.random() * 1000).toFixed(0));
            this.canvasw = 200;
            this.createDom();
            let config = {
                container: document.getElementById(`easy3d-heatmap-${this.id}`),
                radius: this.opt.raduis || 20,
                maxOpacity: .7,
                minOpacity: 0,
                blur: .75,
                gradient: this.opt.gradient || {
                    '.1': 'blue',
                    '.5': 'yellow',
                    '.7' : 'red',
                    '.99': 'white'
                }
            };
            this.heatmapInstance = h337.create(config);
            this.init();
        }

        init() {
            this.hierarchy = []
            for (let ind = 0; ind < this.list.length; ind++) {
                let position = Cesium.Cartesian3.fromDegrees(this.list[ind].lnglat[0], this.list[ind].lnglat[1]);
                this.hierarchy.push(position);

                this.viewer.entities.add({
                    position : position,
                    label : {
                        text :  Math.floor(this.list[ind].value) + "",
                        heightReference : 1,
                        scale : 0.5
                    }
                })
            }
            this.polygon = undefined;
            const bound = this.getBound(this.hierarchy);
            if (!bound) return;
            let points = [];
            let x_axios = Cesium.Cartesian3.subtract(bound.rightTop, bound.leftTop, new Cesium.Cartesian3());
            x_axios = Cesium.Cartesian3.normalize(x_axios, new Cesium.Cartesian3());
            let y_axios = Cesium.Cartesian3.subtract(bound.leftBottom, bound.leftTop, new Cesium.Cartesian3());
            y_axios = Cesium.Cartesian3.normalize(y_axios, new Cesium.Cartesian3());
            const girthX = Cesium.Cartesian3.distance(bound.rightTop, bound.leftTop);
            const girthY = Cesium.Cartesian3.distance(bound.leftBottom, bound.leftTop);
            for (let i = 0; i < this.hierarchy.length; i++) {
                const p1 = this.hierarchy[i];
                const p_origin = Cesium.Cartesian3.subtract(p1, bound.leftTop, new Cesium.Cartesian3());
                const diffX = Cesium.Cartesian3.dot(p_origin, x_axios);
                const diffY = Cesium.Cartesian3.dot(p_origin, y_axios);
                points.push({
                    x: Number(diffX / girthX * this.canvasw).toFixed(0),
                    y: Number(diffY / girthY * this.canvasw).toFixed(0),
                    value: this.list[i].value
                })
            }
            this.heatmapInstance.addData(points);
            this.createPolygon([
                bound.leftTop,
                bound.leftBottom,
                bound.rightBottom,
                bound.rightTop
            ]);
        }

        // 以面的形式添加
        createPolygon(positions) {
            this.polygon = this.viewer.entities.add({
                polygon: {
                    hierarchy: new Cesium.PolygonHierarchy(positions),
                    material: this.heatmapInstance.getDataURL(),
                    heightReference: 1
                }
            });
            this.viewer.zoomTo(this.polygon)
        }

        // 以地图服务的形式添加
        createProvider() {

        }

        createDom() {
            this.dom = window.document.createElement("div");
            this.dom.id = `easy3d-heatmap-${this.id}`;
            this.dom.className = `easy3d-heatmap`;
            this.dom.style.width = this.canvasw + "px";
            this.dom.style.height = this.canvasw + "px";
            this.dom.style.position = "absolute";
            this.dom.style.display = "none";
            let mapDom = window.document.getElementById(this.viewer.container.id);

            mapDom.appendChild(this.dom);
        }

        destory() {
            let dom = document.getElementById(`easy3d-heatmap-${this.id}`);
            if (dom) dom.remove();
            if (this.polygon) {
                this.viewer.entities.remove(this.polygon);
                this.polygon = undefined;
            }
        }

        // 扩展边界 防止出现热力图被分割
        getBound(positions) {
            let rect = this.toRectangle(positions); // 转为正方形
            let lnglats = cUtil.cartesiansToLnglats(rect);
            let minLat = Number.MAX_VALUE, maxLat = Number.MIN_VALUE, minLng = Number.MAX_VALUE, maxLng = Number.MIN_VALUE;
            const length = rect.length;
            for (let i = 0; i < length; i++) {
                const lnglat = lnglats[i];
                if (lnglat[0] < minLng) {
                    minLng = lnglat[0];
                }
                if (lnglat[0] > maxLng) {
                    maxLng = lnglat[0];
                }

                if (lnglat[1] < minLat) {
                    minLat = lnglat[1];
                }
                if (lnglat[1] > maxLat) {
                    maxLat = lnglat[1];
                }
            }

            const diff_lat = maxLat - minLat;
            const diff_lng = maxLng - minLng;

            minLat = minLat - diff_lat / length;
            maxLat = maxLat + diff_lat / length;
            minLng = minLng - diff_lng / length;
            maxLng = maxLng + diff_lng / length;

            return {
                leftTop: Cesium.Cartesian3.fromDegrees(minLng, maxLat),
                leftBottom: Cesium.Cartesian3.fromDegrees(minLng, minLat),
                rightTop: Cesium.Cartesian3.fromDegrees(maxLng, maxLat),
                rightBottom: Cesium.Cartesian3.fromDegrees(maxLng, minLat),
            }
        }

        // 任何图形均转化为正方形
        toRectangle(hierarchy) {
            if (!hierarchy) return;
            let boundingSphere = Cesium.BoundingSphere.fromPoints(hierarchy, new Cesium.BoundingSphere());
            let center = boundingSphere.center;
            const radius = boundingSphere.radius;

            let modelMatrix = Cesium.Transforms.eastNorthUpToFixedFrame(center.clone());
            let modelMatrix_inverse = Cesium.Matrix4.inverse(modelMatrix.clone(), new Cesium.Matrix4());
            let roate_y = new Cesium.Cartesian3(0, 1, 0);

            let arr = [];
            for (let i = 45; i <= 360; i += 90) {
                let roateZ_mtx = Cesium.Matrix3.fromRotationZ(Cesium.Math.toRadians(i), new Cesium.Matrix3());
                let yaix_roate = Cesium.Matrix3.multiplyByVector(roateZ_mtx, roate_y, new Cesium.Cartesian3());
                yaix_roate = Cesium.Cartesian3.normalize(yaix_roate, new Cesium.Cartesian3());
                let third = Cesium.Cartesian3.multiplyByScalar(yaix_roate, radius, new Cesium.Cartesian3());
                let poi = Cesium.Matrix4.multiplyByPoint(modelMatrix, third.clone(), new Cesium.Cartesian3());


                arr.push(poi);
            }

            return arr;
        }


    }
以下是调用方法:
let list = [];
    for (let i = 0; i < 100; i++) {
        list.push({
            "lnglat": [
                117.28 + Math.random() * (Math.random() > 0.5 ? 1 : -1),
                31.923 + Math.random() * (Math.random() > 0.5 ? 1 : -1)
            ],
            "value": 100 * Math.random()
        })
    }
    new Heatmap(viewer, {
        list: list
    })
下面简单说下这个类,
其中getBounds方法是计算了当前传入的经纬度组成外接正方体的边界值,为了防止生成的热力图的边界被切割,我对这这个边界进行可放大。
当我们获取到外接正方体的四个顶点坐标后,通过当前经纬度相对于正方体左上角顶点的坐标位置,来计算热力图canvas中的相对位置,以此来将经纬度与热力图的像素坐标进行匹配。
匹配成功后,创建面,传入canvas转成的图片即可。
如果想销毁 调用destroy方法即可。
以上源码也会和我主页的免费数据一起打包给大家,谢谢关注。
以上写的是二维的热力图,有时我们也会遇到三维热力图,以下是我写的三维热力图效果:
右侧为点击改三维热力图对应的热力值。
第一种效果:primitiveType 为三角形的
第二种效果:primitiveType 为线的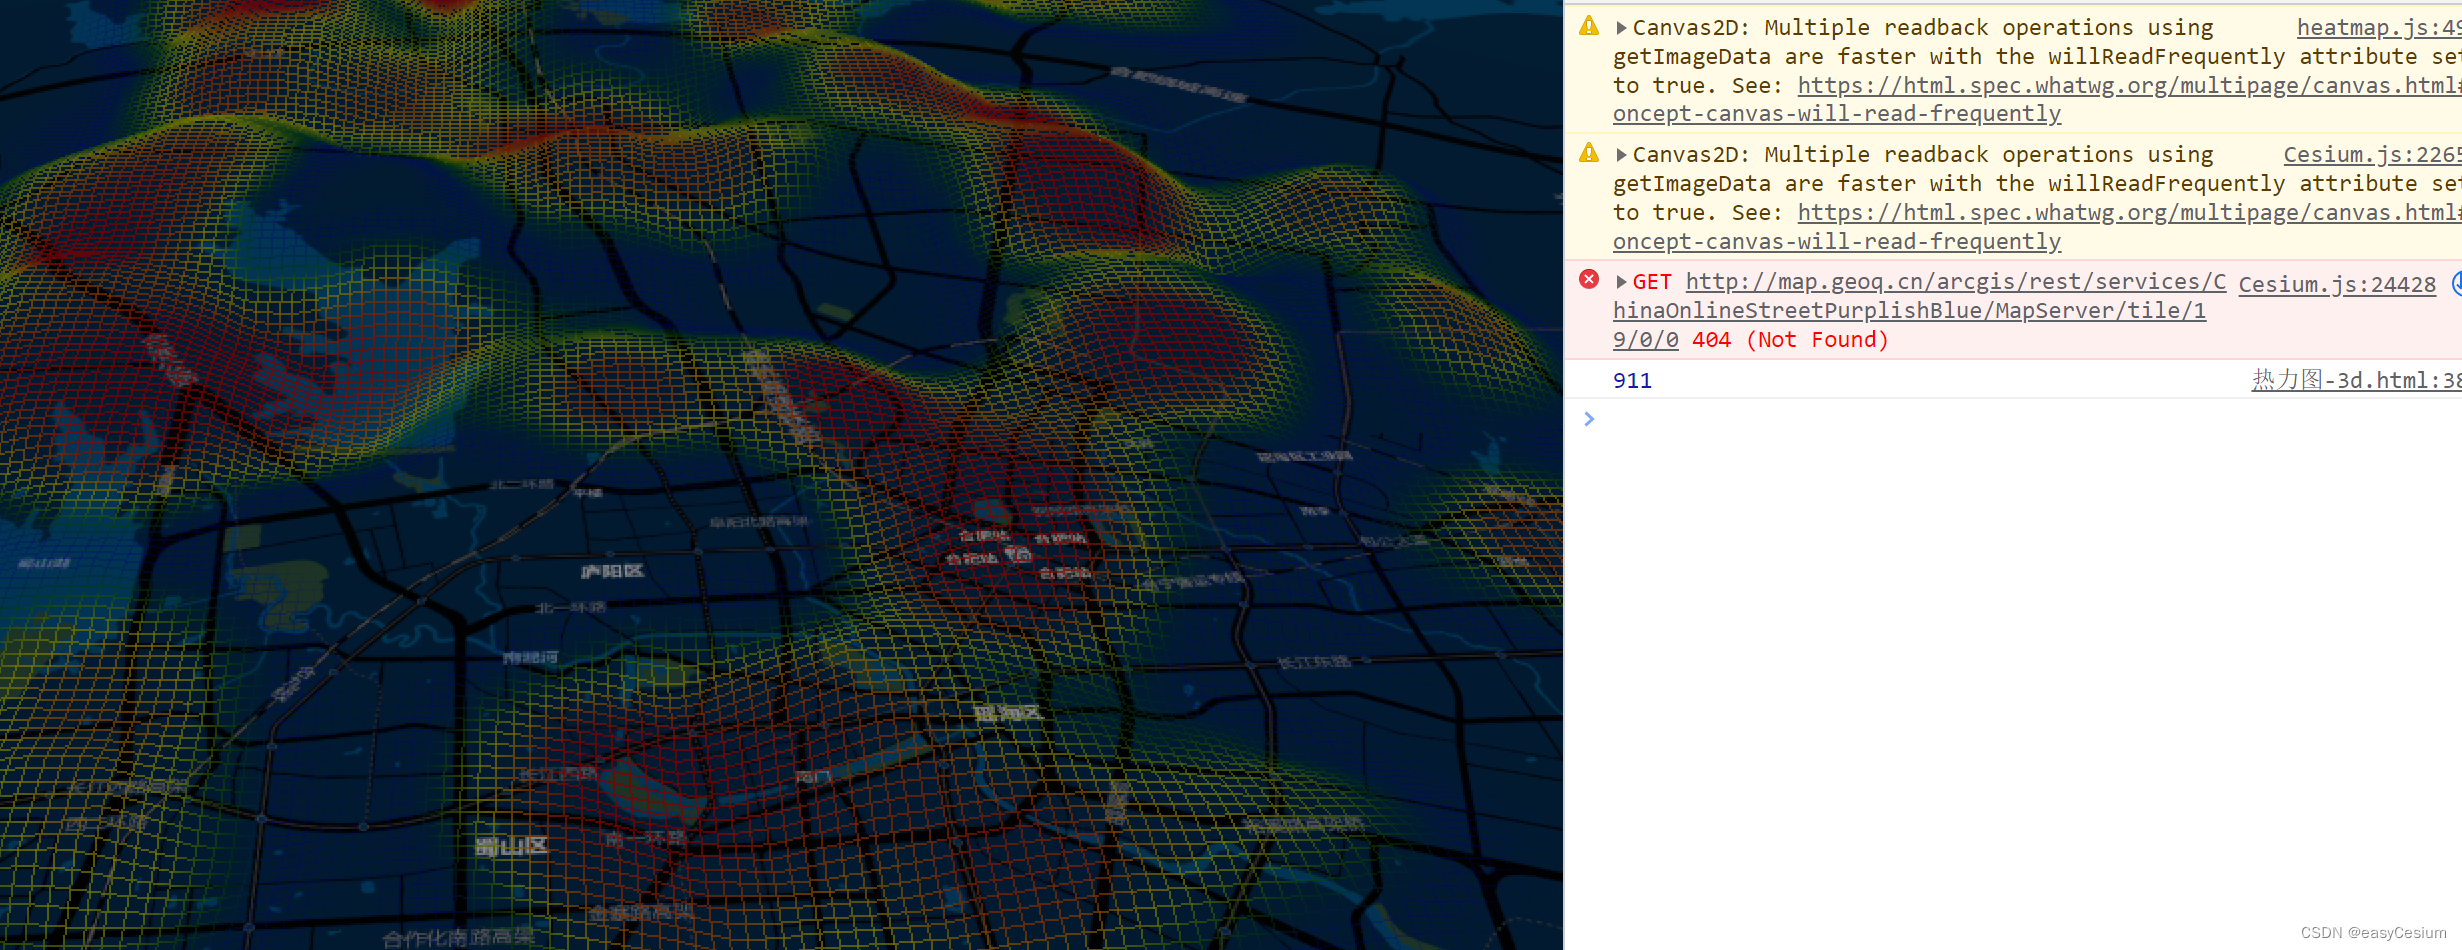
这两种只是webgl的片元处理方式不同 。
此处简单说下三维热力图的原理:
使用geometry自己构建了顶点着色器,然后材质和二维热力图一样,还是使用了材质贴图。
三维热力图与二维热力图的唯一区别在于使用顶点坐标与顶点缓冲区的构建,注意在构建顶点缓冲区时,边界要单独处理。
三维热力图要说的东西多点,后面有机会再跟大家说!


 408
408

 被折叠的 条评论
为什么被折叠?
被折叠的 条评论
为什么被折叠?
 到【灌水乐园】发言


