


 本文介绍如何使用高德地图API实现热力图展示及信息窗体弹出功能。通过加载热力图插件并设置不同的透明度与颜色渐变区间来呈现数据集中的点位热度分布;同时,根据不同区域的人员数量变化调整圆圈大小和颜色,并绑定信息窗体以展示详细信息。
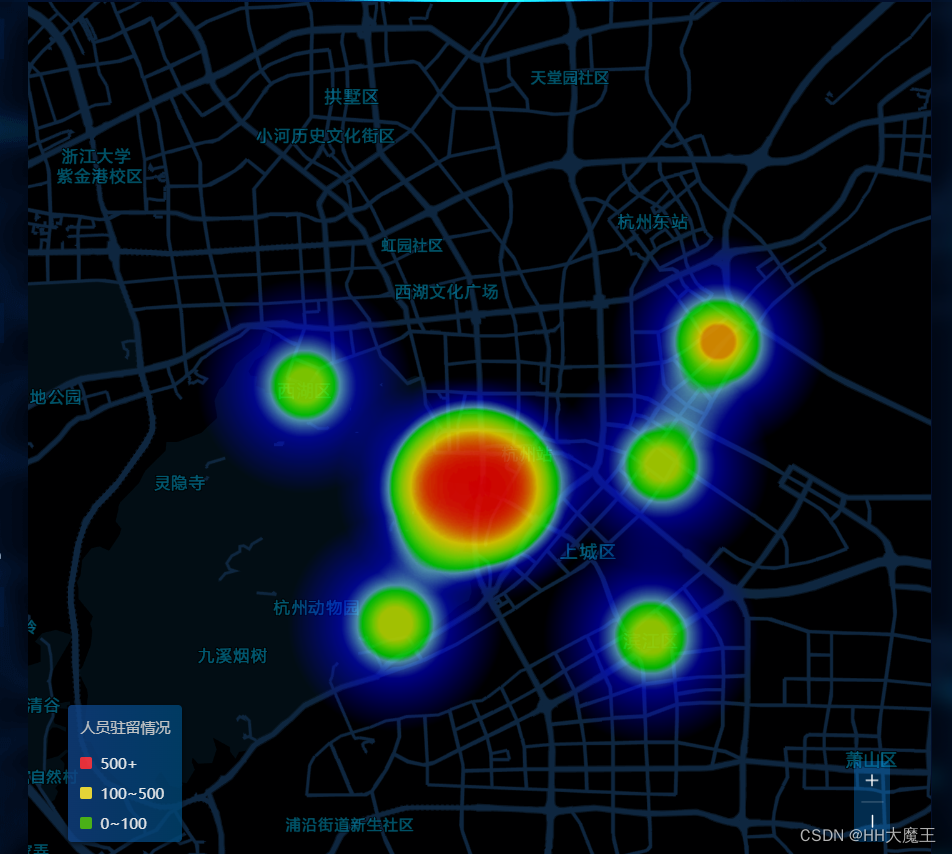
点击+(放大地图),-(缩小地图),点击热力图,弹出标牌。
需求:点击+(放大地图),-(缩小地图),点击热力图,弹出标牌。
方法:先加载出来热力图,然后加载circleMarker信息弹窗叠加在热力图上。
代码
在public/index.html中的body模块中加入:
key值查询方法:登录高德开放平台,链接:key值查询
<body>
  <script src="https://webapi.amap.com/maps?v=2.0&key=自己的key值"></script>
</body>
在新建的.vue中的代码:
<template>
  <div class="box xian-map">
    <div id="container"></div>
  </div>
</template>
export default {
  data() {
    return {
      currentMap: null,
      mapList: [
        {
          position: [120.168083, 30.239672], //经纬度
          icon: 1,
          qu: "清河坊历史文化特色街区", //区域名称
          nums: 100, //流入人员数量
        },
        {
          position: [120.163033, 30.238953],
          icon: 2,
          qu: "吴山景区吴山广场",
          nums: 55,
        },
        {
          position: [120.13026, 30.25961],
          icon: 3,
          qu: "杭州西湖风景名胜区",
          nums: 155,
        },
        {
          position: [120.227882, 30.26856],
          icon: 4,
          qu: "江和美海洋公园",
          nums: 205,
        },
        {
          position: [120.21201, 30.2084],
          icon: 5,
          qu: "鼓楼",
          nums: 315,
        },
        {
          position: [120.214523, 30.243525],
          icon: 6,
          qu: "城市阳台",
          nums: 466,
        },
        {
          position: [120.151657, 30.211077],
          icon: 7,
          qu: "八卦田遗址公园",
          nums: 555,
        },
        {
          position: [120.172874, 30.237242],
          icon: 8,
          qu: "胡雪岩旧居",
          nums: 86,
        },
        {
          position: [120.175888, 30.239679],
          icon: 9,
          qu: "五柳巷历史街区",
          nums: 135,
        },
      ],
    };
  },
  mounted() {
    setTimeout(() => {
      this.initMap();
    }, 300);
  },
  methods: {
    initMap() {
      var map = new AMap.Map("container", {
        // center: [108.939645, 34.314207], //西安未央路
        center: [120.141409, 30.319025], //杭州市拱墅区人民政府
        // layers: [new AMap.TileLayer.Satellite(),new AMap.TileLayer.RoadNet()],
        layers: [],
        mapStyle: "amap://styles/659e7a0818b4892e919457b29948695c",
        zoom: 11.1,
      });
      this.currentMap = map;

      var heatmap;
      var points =[
        { "lng": 120.168083, "lat": 30.239672, "count": 80 },
        { "lng": 120.163033, "lat": 30.238953, "count": 81 },
        { "lng": 120.13026, "lat": 30.25961, "count": 82 },
        { "lng": 120.227882, "lat": 30.26856, "count": 93 },
        { "lng": 120.21201, "lat": 30.2084, "count": 84 },
        { "lng": 120.214523, "lat": 30.243525, "count": 85 },
        { "lng": 120.151657, "lat": 30.211077, "count": 86 },
        { "lng": 120.172874, "lat": 30.237242, "count": 87 },
        { "lng": 120.175888, "lat": 30.239679, "count": 88 },
      ];

      map.plugin(["AMap.HeatMap"],function() {      //加载热力图插件
        //在地图对象叠加热力图
        heatmap = new AMap.HeatMap(map, {
          radius: 100, // 热力图中单个点的半径,默认:30,单位:pixel
          opacity: [0, 0.8], // 热力图透明度数组,取值范围[0,1],0表示完全透明,1表示不透明,默认:[0,1]
          // 热力图的渐变区间,热力图按照设置的颜色及间隔显示热力图
          gradient:{
            0.5: 'blue',
            0.65: 'rgb(117,211,248)',
            0.7: 'rgb(0, 255, 0)',
            0.9: '#ffea00',
            1.0: 'red'
          }
        });
        heatmap.setDataSet({data:points,max:100}); //设置热力图数据集
      });

      var infoWindow = new AMap.InfoWindow({
        offset: new AMap.Pixel(0, -40),
      });

      for (var i = 0; i < this.mapList.length; i += 1) {
        var center = this.mapList[i].position;
        // 根据nums的大小添加不同颜色及大小的圆
        if (this.mapList[i].nums > 500) {
          var circleRadius = 25;
          var circleColr = "";
        } else if (this.mapList[i].nums > 400 && this.mapList[i].nums <= 500) {
          var circleRadius = 22;
          var circleColr = "";
        } else if (this.mapList[i].nums > 300 && this.mapList[i].nums <= 400) {
          var circleRadius = 19;
          var circleColr = "";
        } else if (this.mapList[i].nums > 200 && this.mapList[i].nums <= 300) {
          var circleRadius = 16;
          var circleColr = "";
        } else if (this.mapList[i].nums > 100 && this.mapList[i].nums <= 200) {
          var circleRadius = 13;
          var circleColr = "";
        } else if (this.mapList[i].nums > 50 && this.mapList[i].nums <= 100) {
          var circleRadius = 10;
          var circleColr = "";
        } else if (this.mapList[i].nums > 0 && this.mapList[i].nums <= 50) {
          var circleRadius = 7;
          var circleColr = "";
        }

        // 将圆点标记添加到地图上
        var circleMarker = new AMap.CircleMarker({
          center: center,
          radius: circleRadius, //3D视图下,CircleMarker半径不要超过64px
          strokeColor: circleColr,
          strokeWeight: 2,
          strokeOpacity: 0.5,
          // fillColor:circleColr,
          fillColor: "rgba(0,0,0, 0.1)",
          fillOpacity: 0.5,
          zIndex: 10,
          bubble: true,
          cursor: "pointer",
          clickable: true,
        });
        circleMarker.setMap(map);

        //信息窗体内容及点击事件
        circleMarker.content = `<div class="info_yuanjiao">
                    <div class="quyuName">${this.mapList[i].qu}</div>
                    <div class="num">
                        <div class="icn"></div>
                        <div class="label">流入人员:</div>
                        <div class="value">${this.mapList[i].nums}</div>
                    </div>
                </div>`;
        //鼠标点击marker弹出自定义的信息窗体
        circleMarker.on("click", markerClick);
      }
      function markerClick(e) {
        infoWindow.setContent(e.target.content);
        infoWindow.open(map, e.target.getCenter());
      }
    },
    // 放大
    setBigView() {
      this.currentMap.zoomIn();
    },
    // 缩小
    setSmallView() {
      this.currentMap.zoomOut();
    },
  },
  components: {},
  beforeDestroy() {},
};
</script>
<style lang=scss scoped>
#container {
  margin: 0;
  padding: 0;
  width: 100%;
  height: 100%;
}
</style>


 3815
3815

 被折叠的 条评论
为什么被折叠?
被折叠的 条评论
为什么被折叠?
 到【灌水乐园】发言


