


最近在研究开源地图服务的组建,故将一些点滴记录下来。本次构建所涉及到的方案可能具有个人喜好色彩(例如本人有一点点抵触Java,呵呵),因某些环节还需进一步认证,所以且行且记录。
本次服务搭建,初步方案为(根据实际组建过程,可能会调整):
- 服务器操作系统:CentOS7 (请注意此处的版本,否则之后会遇到问题)
- GIS数据库支持:PostgreSQL9.x + PostGIS
- 地图数据:OSM
- 地图瓦片渲染:Mapnik + CartoCSS
- WMS服务:MapProxy TileStache
- WEB前端:OpenLayers
- 地图底图样式编辑:TilleMill
下面我们就从OSMGIS地图数据的导入开始。
1. PostGIS的创建和初始化
我们选PostgreSQL作为我们的GIS数据库,关于PostgreSQL的安装,之前已经有文章介绍过(centOS7下同样适用)。PostGIS需要额外的安装和配置。PostGIS的安装我们同样使用Yum的方式。
1.1 安装PostGIS
PostGIS 安装过程需要依赖一些相关库文件,为了方便安装,首先我们需要添加EPEL源,然后再安装PostGIS
rpm -Uvh http://dl.fedoraproject.org/pub/epel/7/x86_64/e/epel-release-7-2.noarch.rpm
yum install postgis2_93
1.2 创建地理空间数据库
目前如果导入OSM的全球数据的话,导入后至少需要480G的存储空间。所以根据需求请选择合适的存储路径来创建数据库。
mkdir /DATA/pgtbs_osmgis #目录请自行决定
chown postgres /DATA/pgtbs_osmgis
然后在psql下创建表空间, 为了方便管理,我们再创建一个PG用户osmgis
psql -Upostgres CREATE USER osmgis WITH PASSWORD 'password'; CREATE TABLESPACE pgtbs_osmgis OWNER "osmgis" LOCATION '/DATA/pgtbs_osmgis'; 创建数据库和一个对应的管理用户,管理用户建议使用password认证(pg_hba.conf),具体配置可参见之前的文章。
CREATE DATABASE osmgis WITH OWNER = "osmgis" ENCODING = 'UTF8' TABLESPACE = pgtbs_osmgis; GRANT ALL PRIVILEGES ON DATABASE osmgis TO osmgis; 1.3 添加postgis功能以及hstore
以下方法,因权限问题,需要使用postgres用户来操作
psql -Upostgres -dosmgis </usr/pgsql-9.3/share/contrib/postgis-2.1/postgis.sql
psql -Upostgres -dosmgis </usr/pgsql-9.3/share/contrib/postgis-2.1/spatial_ref_sys.sql
psql -Upostgres -dosmgis </usr/pgsql-9.3/share/contrib/postgis-2.1/postgis_comments.sql
用postgres用户登录psql,然后创建hstore
psql -Upostgres -dosmgis create extension hstore; #如报错,请检查是否安装了postgresql93-contrib 1.4 PostgreSQL配置的优化
为了使地图数据导入更加顺滑,我们需要调整一下PG的配置文件
配置文件:/var/lib/pgsql/9.3/data/postgresql.conf
- shared_buffers = 128MB
- maintenanceworkmem = 256MB
- checkpoint_segments = 20
- autovacuum = off
以上的配置一般适用于你有8G的内存,具体配置可根据自己的情况自行调整,可以参考 http://wiki.openstreetmap.org/wiki/Osm2pgsql/benchmarks 以及http://wiki.openstreetmap.org/wiki/PostgreSQL 上的建议。
修改完配置后别忘了
sudo service postgresql-9.3 reload2. OSMGIS地图数据下载
根据需要,可以去 http://planet.openstreetmap.org/ 下载地图数据,建议下载 .pbf 二进制格式的数据,这样下载和数据导入速度都会快一些。目前全球数据大小在25G左右(导入后大概占用空间500G左右)。也可以根据需要下载州、国家、地区的数据 http://download.geofabrik.de/ ,或者下载某个城市甚至可以指定一个区域下载 http://download.bbbike.org/osm/。更多的OSMGIS数据下载可以参见:
http://wiki.openstreetmap.org/wiki/Planet.osm#Downloading
我们可以先下载一个比较小的地图用于先期的测试工作,我们先拿宝岛台湾作个试验吧!
wget http://download.bbbike.org/osm/bbbike/Beijing/Beijing.osm.pbf 如果打算导入全球数据的话,根据服务器的配置不同,耗时也是不同的。快则一天,多则可能需要一周。具体可参考官方的评测报告:http://wiki.openstreetmap.org/wiki/Osm2pgsql/benchmarks, 里面例举了不同硬件/软件配置的数据导入耗时。
3. 数据导入
因为本次地图底图要支持CartoCSS, 我们选用了osm-bright的方案,当然还有其他一些开源的方案支持CartoCSS+Mapnik的底图瓦片渲染,这个可以根据个人喜好来决定。但无论选择哪种方案,最终是希望能通过一个友好的编辑器(例如TileMill),来方便的设计/修改地图的底图样式。
3.1 下载osm-bright
用皮肤,地图皮肤哦
git clone https://github.com/mapbox/osm-bright.git 3.2 imposm 安装
地图数据文件的导入工具,本次选择了imposm, 也可以用osm2pgsql,一个是python的实现一个是C的实现,据说imposm比osm2pgsql要快一些。
yum install python-psycopg2 python-devel protobuf-compiler gcc gcc-c++ protobuf-devel tokyocabinet-devel geos-devel
yum install python-pip pip install imposm
3.3 数据导入
导入需要指定一个mapping.py的配置文件,此文件在osm-bright的项目目录下
sudo -s cd /home/postgres/
su postgres
imposm --connection=postgis://osmgis:password@localhost/osmgis -m ./osm-bright/imposm-mapping.py --read --write --optimize --deploy-production-tables taiwan-latest.osm.pbf
台湾的数据比较小,我在VPS环境上大概也就不到3分钟就完成了,呵呵。
另外一个需要注意的是,imposm默认链接PG用的是IPv6 ??? 所以可能需要修改pghba.conf,否则以上导入过程可能会报错(FATAL: Ident authentication failed for user “xxxxxx”),我们需要在pghba.conf中加入以下一条规则:
# IPv6 local connections:
host    all       osmgis         ::1/128         md5
地图数据导入后,接下来我们就可以用TileMill来浏览和编辑地图样式了。
TileMill是MapBox推出的一款地图样式编辑器,同时自身还提供地图瓦片服务,上一章我们已经成功的导入了OSM的地图数据,接下来我们尝试用TileMill对地图数据进行预览和编辑。
4. 安装NodeJS
因为TileMile是NodeJS的项目,所以我们要先安装NodeJS以及NPM包管理工具
yum install nodejs npm5. 安装TileMill
从githup上下载TileMill项目,然后执行安装
git clone https://github.com/mapbox/tilemill.git
cd tilemill
npm install
TileMill默认情况下,只能本机访问服务(127.0.0.1),如果作为服务器端应用,需要指定一些启动参数才可正常访问。默认情况下端口20008提供瓦片服务,20009为前端应用服务。这个也可以自行修改决定。
cd tilemill
./index.js --server=true --listenHost=0.0.0.0 --coreUrl=${_SERVER_IP_}:20009 --tileUrl=${_SERVER_IP_}:20008SERVERIP请替换为实际的服务器IP,然后在浏览器端输入 {SERVERIP}:20009 就可以访问TileMill了。如果一些顺利的话,会看到如下的场景:
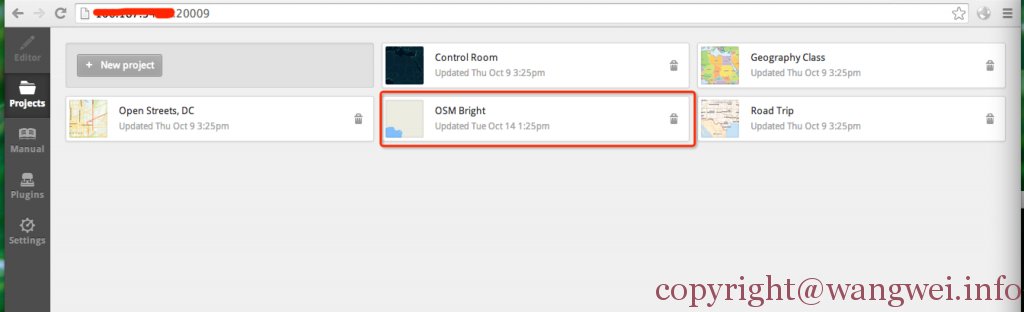
如果需要变更默认项目目录的话,在启动时候可以加上 –files=/youprojectpath , 来指定你自己的项目路径,更多的参数选择也可参见项目默认的配置文件:tilemill/lib/config.defaults.json
OSMBright 是我们通过 osm-bright 工具来创建出来的一个OSM数据源的项目,具体方法参见下面。其余的项目是系统自带的一些演示项目,打开时可能会因为系统缺少必要的字体而出现渲染瓦片失败的报错,可以安装对应的字体,或者修改相关的字体配置来解决。
6. 通过OSM-Bright创建第一个项目
osm-bright的下载之前已经介绍过了,现在我们可以通过osm-bright来创建一个支持OSM数据格式的TileMill项目。
6.1 下载ShapeFiles文件
因OSM Bright的需要,我们需要下载两个ShapeFiles(地图矢量要素文件?)
cd osm-bright
mkdir shp
cd shp
wget http://data.openstreetmapdata.com/simplified-land-polygons-complete-3857.zip
wget http://data.openstreetmapdata.com/land-polygons-split-3857.zip
unzip simplified-land-polygons-complete-3857.zip
unzip land-polygons-split-3857.zip
6.2 配置
cd osm-birght
cp configure.py.sample configure.py
然后对 configure.py 做如下的修改配置:
config["importer"] = "imposm"
config["name"] = "OSM Bright" #可以随意修改为你想要的
config["path"] = path.expanduser("/root/Documents/MapBox/project") #这个路径取决于TileMill的配置
config["postgis"]["dbname"] = "osmgis"
config["postgis"]["user"] = "osmgis"
config["land-high"] = path.join(getcwd(),"shp/land-polygons-split-3857/land_polygons.shp")
config["land-low"] = path.join(getcwd(),"shp/simplified-land-polygons-complete-3857/simplified_land_polygons.shp")
修改完配置后 ./make.py
没有问题的话,会在你指定的项目路径下生成一个 OSMBright 的项目,然后可以用TileMill打开该项目进行编辑了。
7. 中文支持
一般来说服务器需要有中文字体的支持,这样地图渲染出来才能正确的显示中文,否则你可能会看到各种方框乱码了,正好最近Google联合Adobe推出了一款新的开源字体:思源黑体,我们可以下载安装看一下效果。https://www.google.com/get/noto/#/
mkdir noto cd noto wget https://www.google.com/get/noto/pkgs/Noto.zip unzip Noto.zip cd ..
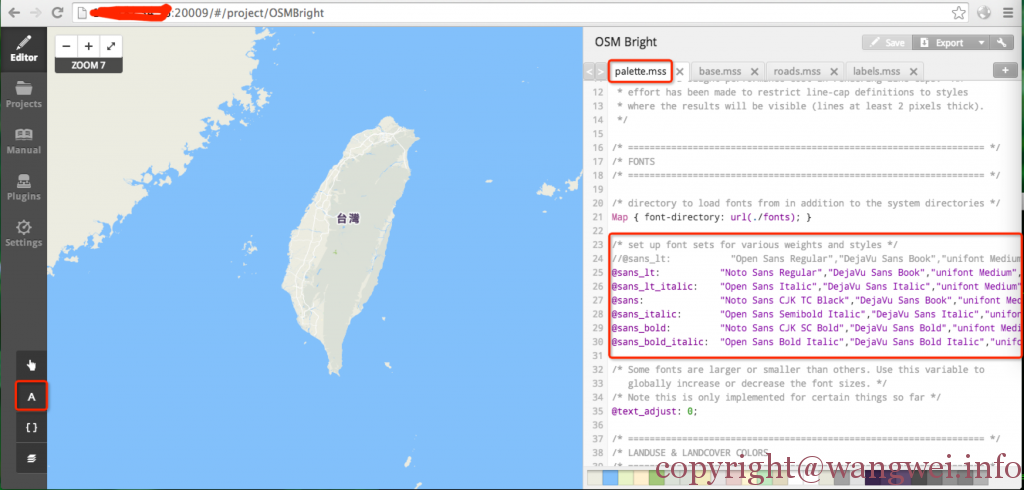
cp -r noto /usr/share/fonts/noto #安装字体到系统路径 安装成功后,重启一下TileMill服务器,这样就可以在WEB界面上选择,设置新安装的字体了。以下是我的palette.mss关于系统字体的配置:
@sans_lt: "Noto Sans Regular","DejaVu Sans Book","unifont Medium","Noto Sans Medium";
@sans_lt_italic: "Open Sans Italic","DejaVu Sans Italic","unifont Medium","Noto Sans Medium";
@sans: "Noto Sans CJK TC Black","DejaVu Sans Book","unifont Medium","Noto Sans Medium";
@sans_italic: "Open Sans Semibold Italic","DejaVu Sans Italic","unifont Medium","Noto Sans Medium";
@sans_bold: "Noto Sans CJK SC Bold","DejaVu Sans Bold","unifont Medium","Noto Sans Medium";
@sans_bold_italic: "Open Sans Bold Italic","DejaVu Sans Bold Italic","unifont Medium","Noto Sans Medium";
如果想查看当前系统支持哪些字体,可以点击编辑器左下角的 “A” 字体管理图标查看。
至此,我们已经可以通过TileMill来编辑地图样式了,接下来我们将通过OpenLayers.js实现一个简单的WEB GIS系统。
按之前的设想,现在应该用MapProxy或TileStache来搭建WMS服务了,但TileMill本身就提供了一个看起来还不错的地图瓦片服务(XYZ模式的),而且OpenLayers本身也支持这种模式,于是打算直接用OpenLayers访问TileMill的瓦片服务接口,先看看效果再说。
OpenLayers是一个开源的为WEB GIS客户端提供的JS库,可以方便的对地图做各种处理。目前已发布3.0版本了,官网:http://openlayers.org/,上面的文档也算丰富,其中还包含了各种Example,对初学者帮助很大!另外再推荐一下 Leaflet 相对来说算是轻量级的,但也非常的好用!
8. 简单的地图呈现
本次,我们只是简单的展现一下地图,通过官方的Example稍作修改,代码很简单,示例如下:
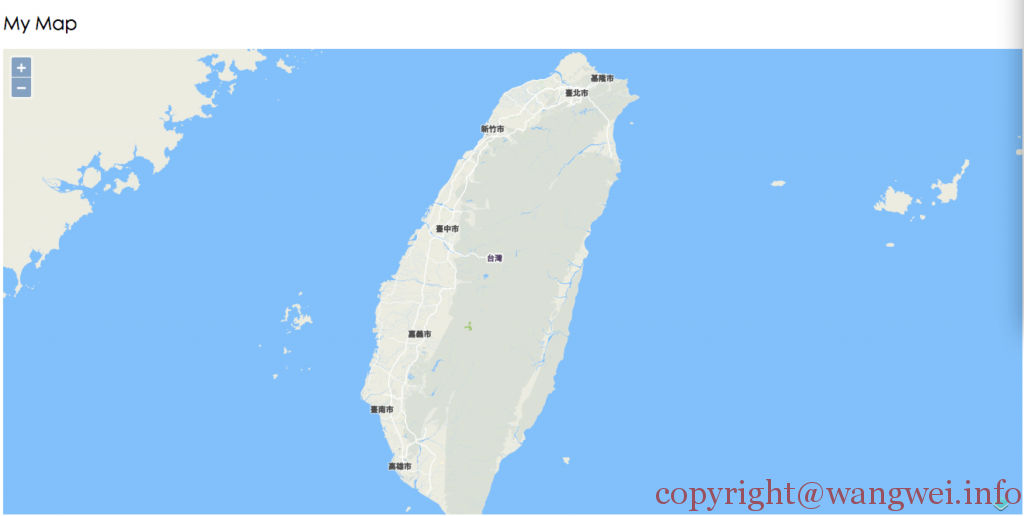
其中,ol.source.XYZ.url 中的IP请替换成你自己的即可。 ol.View.center/zoom 指定地图的中心点以及默认缩放级别,我们把焦点移到之前的台湾宝岛上看看!
<!doctype html>
  <html lang="en">
    <link rel="stylesheet" href="http://openlayers.org/en/v3.0.0/css/ol.css" type="text/css">
    <style> .map { height: 600px; width: 100%; } </style>
    <script src="http://openlayers.org/en/v3.0.0/build/ol.js" type="text/javascript"></script>
    <title>OpenLayers 3 example</title>
    <h2>My Map</h2>
      <div id="map" class="map"></div>
      <script type="text/javascript">
        var map = new ol.Map({
          target: 'map',
          layers: [ new ol.layer.Tile({ source: new ol.source.XYZ({ url: 'http://xxx.xxx.xxx.xxx:20008/tile/OSMBright/{z}/{x}/{y}.png' }) }) ],
          view: new ol.View({ center: ol.proj.transform([121.11, 23.82], 'EPSG:4326', 'EPSG:3857'), zoom: 8 })
        });
      </script>
如果没有问题的话,访问该html变可看到自己的地图了:-)
9. 通过GeoJson实现地图矢量要素层
有了地图的底图,我们还需要在此之上呈现一些交互,例如POI打点,绘制线,多边形等相关的应用,甚至是动态数据的呈现。
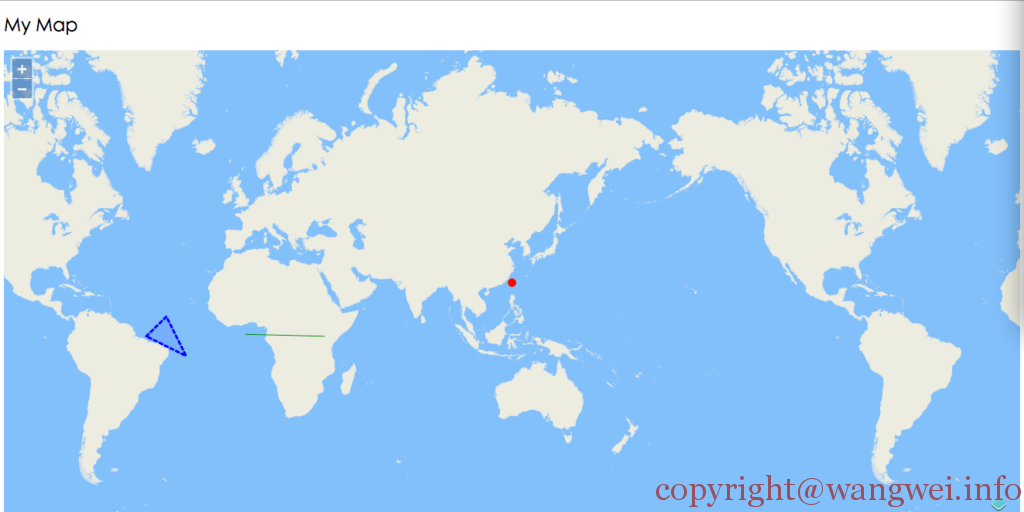
GeoJson是基于Json的数据格式为基础,专门为地理数据编码的一种载体,其中支持的几何类型有:点、线、面、多点、多线、多面以及几何数据的集合。GeoJson里包含了这些几何对象基本的特征属性。以下代码是参考 http://openlayers.org/en/v3.0.0/examples/geojson.html 的例子生成的,简单的实现了GeoJson作为载体的地图向量数据呈现的一个测试:
<!doctype html>
  <html lang="en">
    <link rel="stylesheet" href="http://openlayers.org/en/v3.0.0/css/ol.css" type="text/css">
    <style>
      .map { height: 600px; width: 100%; }
    </style>
    <script src="http://openlayers.org/en/v3.0.0/build/ol.js" type="text/javascript"></script>
    <title>OpenLayers 3 example</title>
    <h2>My Map</h2>
      <div id="map" class="map"></div>
      <script type="text/javascript">
        var image = new ol.style.Circle({
          radius: 5,
          fill: new ol.style.Stroke({color: 'red'}),
          stroke: new ol.style.Stroke({color: 'red', width: 1})
        });
        var styles = {
          'Point': [new ol.style.Style({ image: image })],
          'LineString': [new ol.style.Style({ stroke: new ol.style.Stroke({ color: 'green', width: 1 }) })],
          'Polygon': [new ol.style.Style({
            stroke: new ol.style.Stroke({
              color: 'blue',
              lineDash: [4],
              width: 3
          }),
          fill: new ol.style.Fill({ color: 'rgba(0, 0, 255, 0.1)' }) })],
          'Circle': [new ol.style.Style({ stroke: new ol.style.Stroke({ color: 'red', width: 2 }), fill: new ol.style.Fill({ color: 'rgba(255,0,0,0.2)' }) })] }; var vectorSource = new ol.source.GeoJSON( /** @type {olx.source.GeoJSONOptions} */ ({ object: { 'type': 'FeatureCollection', 'crs': { 'type': 'name', 'properties': { 'name': 'EPSG:3857' } }, 'features': [ { 'type': 'Feature', 'geometry': { 'type': 'Point', 'coordinates': ol.proj.transform([121.11, 23.82], 'EPSG:4326', 'EPSG:3857') } }, { 'type': 'Feature', 'geometry': { 'type': 'LineString', 'coordinates': [ [3e1, 1e5], [4e6, 3e1] ] } }, { 'type': 'Feature', 'geometry': { 'type': 'Polygon', 'coordinates': [ [ [-5e6, 2e1], [-4e6, 1e6], [-3e6, -1e6] ] ] } }, ] } })); var styleFunction = function (feature, resolution) { return styles[feature.getGeometry().getType()]; }; var vectorLayer = new ol.layer.Vector({ source: vectorSource, style: styleFunction }); var map = new ol.Map({ target: 'map', layers: [ new ol.layer.Tile({ source: new ol.source.XYZ({ url: 'http://xxx.xxx.xxx.xxx:20008/tile/OSMBright/{z}/{x}/{y}.png' }), }), vectorLayer ], view: new ol.View({ center: ol.proj.transform([121.11, 23.82], 'EPSG:4326', 'EPSG:3857'), zoom: 2 }) });
      </script>
效果应该是这样的:
到此为止,我们已经可以通过OpenLayers作一些简单的WebGIS应用了,搭建开源地图服务的话题暂且告一段落。当然我们还缺失一些关键性的服务器,例如地图瓦片的缓存,以及一些接口的标准化的处理,包括之前预想使用的MapProxy和TileStache, 或许本次的主题称之为借助TileMill实现地图服务更合适,呵呵。以上内容仅仅是记录了我个人对地图服务搭建学习过程中的一些点滴。随着以后不断深入学习,我尽量逐步完善和公布一些我对开源地图服务细节上的认知。


 8151
8151


 被折叠的 条评论
为什么被折叠?
被折叠的 条评论
为什么被折叠?
 到【灌水乐园】发言


