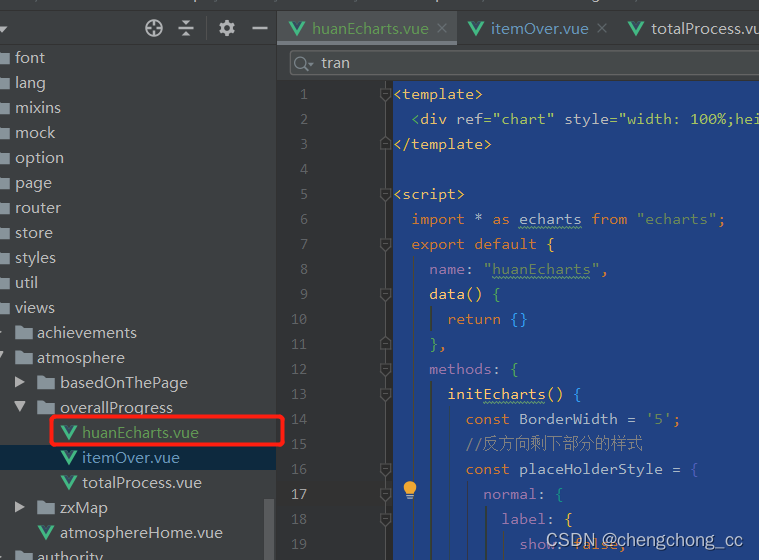
echarts 多重环形图


<template>
  <div ref="chart" style="width: 100%;height: 100%;"></div>
</template>

<script>
  import * as echarts from "echarts";

  export default {
    name: "huanEcharts",
    data() {
      return {}
    },
    methods: {
      initEcharts() {
        const BorderWidth = '5';
        //反方向剩下部分的样式
        const placeHolderStyle = {
          normal: {
            label: {
              show: false,
              position: "center"
            },
            labelLine: {
              show: false
            },
            color: "rgba(0,0,0,0)",
            borderColor: "rgba(0,0,0,0)",
            borderWidth: 0
          },
          emphasis: {
            color: "#dedede",
            borderColor: "#dedede",
            borderWidth: 0
          }
        };
        const option = {
          backgroundColor: 'transparent',
          color: ['#FF6271', '#4ebefd', '#30ed9d', '#faa234', "#FF6271"],
          legend: {
            show: false,
            orient: 'vertical',
            left: 'left',
            top: 'middle',
            data: ['正常', '次要', '警告', '重要', '严重'],
            textStyle: {
              color: '#fff',
              fontSize: 16
            }
          },
          series: [{
            name: '正常',
            type: 'pie',
            clockWise: true, //顺时加载
            startAngle:120,//起始角度
            hoverAnimation: false, //鼠标移入变大
            radius: [70, 73],
            itemStyle: {
              normal: {
                label: {
                  show: false,
                  position: 'outside'
                },
                labelLine: {
                  show: false,
                  length: 100,
                  smooth: 0.5
                },
                borderWidth: BorderWidth,
                shadowBlur: 40,
                borderColor: "#263A5C",
                shadowColor: 'rgba(0, 0, 0, 0)' //边框阴影
              }
            },
            data: [{
              value: 10,
              name: '100%'
            },
              {
                value: 0,
                name: '',
                itemStyle: placeHolderStyle
              }
            ]
          }, {
            name: '完成总数',
            type: 'pie',
            clockWise: true,
            hoverAnimation: false,
            startAngle:120,
            radius: [59, 60],
            itemStyle: {
              normal: {
                label: {
                  show: false
                },
                labelLine: {
                  show: false,
                  length: 100,
                  smooth: 0.5
                },
                borderWidth: BorderWidth,
                shadowBlur: 40,
                borderColor: "#28B3F9",
                shadowColor: 'rgba(0, 0, 0, 0)' //边框阴影
              }
            },
            data: [{
              value: 6,
              name: '60%'
            },
              {
                value: 4,
                name: '',
                itemStyle: placeHolderStyle
              }
            ]
          }, {
            name: '正常完成',
            type: 'pie',
            clockWise: true,
            startAngle:120,
            hoverAnimation: false,
            radius: [49, 50],
            itemStyle: {
              normal: {
                label: {
                  show: false
                },
                labelLine: {
                  show: false,
                  length: 100,
                  smooth: 0.5
                },
                borderWidth: BorderWidth,
                shadowBlur: 40,
                borderColor: "#00D586",
                shadowColor: 'rgba(0, 0, 0, 0)' //边框阴影
              }
            },
            data: [{
              value: 5,
              name: '40%'
            },
              {
                value: 5,
                name: '',
                itemStyle: placeHolderStyle
              }
            ]
          }, {
            name: '提前完成',
            type: 'pie',
            clockWise: true,
            hoverAnimation: false,
            startAngle:120,
            radius: [39, 40],
            itemStyle: {
              normal: {
                label: {
                  show: false
                },
                labelLine: {
                  show: false,
                  length: 100,
                  smooth: 0.5
                },
                borderWidth: BorderWidth,
                shadowBlur: 40,
                borderColor: "#FFC642",
                shadowColor: 'rgba(0, 0, 0, 0)' //边框阴影
              }
            },
            data: [{
              value: 5,
              name: '30%'
            },
              {
                value: 5,
                name: '',
                itemStyle: placeHolderStyle
              }
            ]
          }, {
            name: '逾期完成',
            type: 'pie',
            clockWise: true,
            startAngle:120,//起始角度
            hoverAnimation: false,
            radius: [29, 30],
            itemStyle: {
              normal: {
                label: {
                  show: false
                },
                labelLine: {
                  show: false,
                  length: 100,
                  smooth: 0.5
                },
                borderWidth: BorderWidth,
                shadowBlur: 40,
                borderColor: "#FF6271",
                shadowColor: 'rgba(0, 0, 0, 0)' //边框阴影
              }
            },
            data: [{
              value: 4,
              name: '30%'
            },
              {
                value: 6,
                name: '',
                itemStyle: placeHolderStyle
              }
            ]
          }],
          title: {
            text: "100%",
            subtext: '完成率',
            textAlign:"center",
            left:75,
            top:55,
            textStyle: {
              fontSize: 16,
              fontFamily: 'Impact',
              color: '#FFFFFF',
              lineHeight: 16
            },
            subtextStyle: {
              fontSize: 12,
              fontFamily: 'PingFangSC-Regular, PingFang SC',
              color: '#FFFFFF',
              lineHeight: 12,
              fontWeight:400
            }
          },
        };
        const myChart = echarts.init(this.$refs.chart);
        myChart.setOption(option);
        //随着屏幕大小调节图表
        window.addEventListener("resize", () => {
          myChart.resize();
        });

        // myChart.getZr().on("click", (params) => {
        //   let that = this;
        //   let pointInPixel = [params.offsetX, params.offsetY];
        //   if (myChart.containPixel("grid", pointInPixel)) {
        //     //点击第几个柱子
        //     let pointInGrid = myChart.convertFromPixel({ seriesIndex: 0 }, pointInPixel);
        //     // console.log(pointInGrid)
        //     // 也可以通过params.offsetY 来判断鼠标点击的位置是否是图表展示区里面的位置
        //     // 也可以通过name[xIndex] != undefined,name是x轴的坐标名称来判断是否还是点击的图表里面的内容
        //     // x轴数据的索引
        //     let xIndex = pointInGrid[0];
        //     // y轴数据的索引
        //     let yIndex = pointInGrid[1];
        //     // console.log(xIndex)
        //     // console.log(yIndex)
        //     let time = this.xAxisData[xIndex];
        //     // console.log(time)
        //     // console.log(this.data)
        //     /*
        //       this.$store.commit("secondZhuMethod", {time:time});
        //       this.openSecond();*/
        //     this.$store.state.popWindow = true;
        //     this.$store.state.toggleCtp = "zhu-second";
        //     localStorage.setItem("firstName", "zhu-echarts");
        //     localStorage.setItem("getMonitoring", time);
        //   }
        // });
      }
    },
    mounted() {
      this.initEcharts();
    }
  }
</script>

<style scoped>

</style>


参考网址:用echarts来实现多重环形图_echarts实现圆环重叠_浩星的博客-CSDN博客

  • 0
    点赞
  • 0
    收藏
    觉得还不错? 一键收藏
  • 0
    评论
实现多重环形的方法可以使用Echarts中的Polar(极坐标)和Bar(柱状)来实现。在Echarts中,可以通过设置多个系列来创建多重环形。每个系列代表一个环,通过设置各个环的半径、角度和颜色等属性,可以实现多重环形的效果。 首先,需要引入Echarts库,然后创建一个容器来承载表。接着,通过配置项来设置表的样式和数据,其中包括设置多个系列的属性。例如,设置各个环的半径、角度、颜色和数据等。 下面是一个示例代码,展示了如何使用Echarts实现多重环形: ```javascript // 引入Echarts库 import echarts from 'echarts'; // 创建容器 const chartContainer = document.getElementById('chart-container'); // 初始化表 const chart = echarts.init(chartContainer); // 配置项 const option = { // 设置表类型为极坐标 polar: {}, // 设置多个系列,每个系列代表一个环 series: [ { type: 'bar', data: [/* 数据 */], // 设置第一个环的半径和角度 radius: ['0%', '30%'], angle: [0, 360], // 设置第一个环的颜色和样式 itemStyle: { color: 'blue', }, }, { type: 'bar', data: [/* 数据 */], // 设置第二个环的半径和角度 radius: ['30%', '60%'], angle: [0, 360], // 设置第二个环的颜色和样式 itemStyle: { color: 'green', }, }, // 可以继续添加更多的系列 ], }; // 使用配置项生成表 chart.setOption(option); ``` 使用上述代码,你可以根据自己的需求设置每个环的半径、角度、颜色和数据等属性,从而实现多重环形

“相关推荐”对你有帮助么?

  • 非常没帮助
  • 没帮助
  • 一般
  • 有帮助
  • 非常有帮助
提交
评论
添加红包

请填写红包祝福语或标题

红包个数最小为10个

红包金额最低5元

当前余额3.43前往充值 >
需支付:10.00
成就一亿技术人!
领取后你会自动成为博主和红包主的粉丝 规则
hope_wisdom
发出的红包
实付
使用余额支付
点击重新获取
扫码支付
钱包余额 0

抵扣说明:

1.余额是钱包充值的虚拟货币,按照1:1的比例进行支付金额的抵扣。
2.余额无法直接购买下载,可以购买VIP、付费专栏及课程。

余额充值