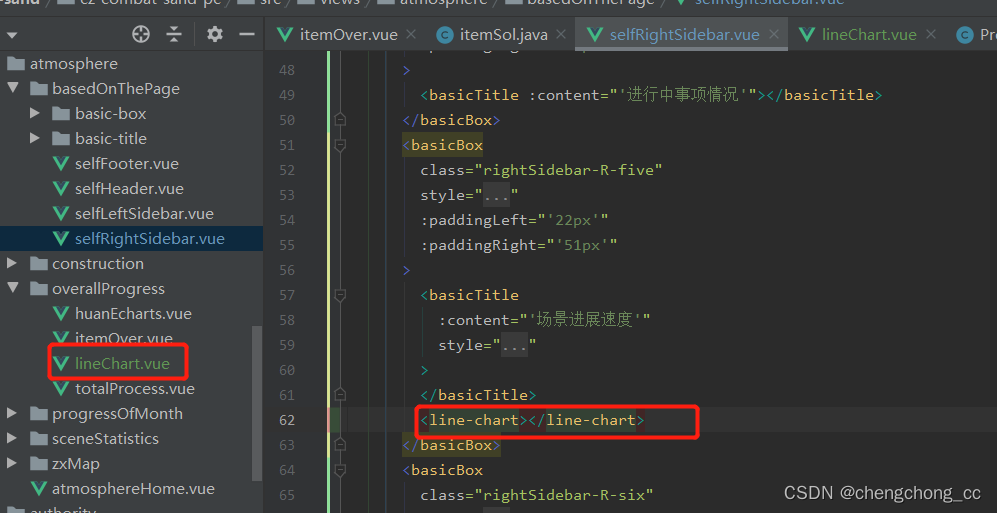
<template>
  <div>
    <div class="font" style="">单位:%</div>
    <div id="peakEcharts" style="width: 100%; height: 185px;"></div>
  </div>
</template>

<script>
  import * as echarts from "echarts";

  export default {
    name: "lineChart",
    data() {
      return {
        myChart: null,
        value1: [],
        xValue: [],
      };
    },
    mounted() {
      this.initData();
    },
    methods: {
      async initData() {
        // let that = this;
        // await noiseDataChangePad().then(res => {
        //   res.data.data.forEach(function (e) {
        //     that.xValue.push(e.time)
        //     that.value1.push(e.val)
        //   })
        // })
        this.xValue = [22.01, "22.02", "22.03", "22.04", "22.05", "22.06"];
        this.value1 = ["12", "24", "23", "25", "45", "20"];
        this.initChart()
      },
      initChart() {
        let that = this;
        const option = {
          tooltip: {
            trigger: "axis",
            axisPointer: {
              type: "line",
              // lineStyle: {
              //   color: "linear-gradient(180deg, rgba(255, 255, 255, 1), rgba(255, 255, 255, 0)) 1 1",
              // },
            },
            formatter: function (params) {
              // console.log(params);
              let str = `<div style="width: 136px;
    height: 66px;
    background: linear-gradient(180deg, rgba(32,77,139,0.93) 0%, rgba(8,30,63,0.93) 100%);
    box-shadow: 0px 2px 14px 2px #082A52;
    border-radius: 2px;
    opacity: 0.8;
    border: 1px solid;
    border-image: linear-gradient(180deg, rgba(28, 183, 255, 1), rgba(12, 129, 255, 1)) 1 1;
    backdrop-filter: blur(10px);">
                            <div style="margin-left:14px;margin-top: 11px;"><span style="height: 18px;
    font-size: 14px;
    font-family: Impact;
    color: #FFFFFF;
    line-height: 18px;
    letter-spacing: 1px;
    background: linear-gradient(180deg, #FFFFFF 0%, #FFC642 100%);
    -webkit-background-clip: text;
    -webkit-text-fill-color: transparent;">${params[0].name}</span></div>
                            <div style="margin-left:14px;margin-top: 11px;"><span style="width: 70px;
height: 14px;
font-size: 14px;
font-family: MicrosoftYaHei;
color: #FFFFFF;
line-height: 14px;">环比增长 : </span><span style='height: 14px;
font-size: 14px;
font-family: Impact;
color: #4CCCFF;
line-height: 14px;
letter-spacing: 1px;
background: linear-gradient(180deg, #FFFFFF 0%, #4CCCFF 100%);
-webkit-background-clip: text;
-webkit-text-fill-color: transparent;'>${params[0].data}%</span></div>
                        </div>`;
              return str;
            },
            extraCssText:'width: 136px;height: 66px;display: flex;background: linear-gradient(180deg, rgba(19,64,115,0.93) 0%, rgba(8,30,63,0.93) 100%);align-items: center;!important;padding:0;box-shadow: 0px 0px 0px 0px #082A52;border: 0px solid rgba(28, 183, 255, 1);border-radius: 2px;'
          },
          grid: {
            top: "8%",
            left: "12%",
            right: "5%",
            bottom: "20%",
          },
          xAxis: {
            type: "category",
            axisLine: {
              show: false,
            },
            axisLabel: {
              show: true,
              margin: 20,
              textStyle: {
                color: "#fff",
                fontSize: 14,
                fontFamily: "MicrosoftYaHei",
              },
            },
            splitLine: {
              show: false,
            },
            axisTick: {
              show: false,
            },
            boundaryGap: false,
            data: that.xValue,
          },
          yAxis: {
            type: "value",
            splitLine: {
              show: true,
              lineStyle: {
                type: "solid",
                width:1,
                color:"rgba(221,242,255,0.1)"
              },
            },
            axisLine: {
              show: false,
              lineStyle: {
                type: "dotted",
              },
            },
            axisLabel: {
              show: true,
              margin: 20,
              textStyle: {
                color: "#fFF",
                fontSize: 14,
                fontFamily: "MicrosoftYaHei",
              },
              formatter: "{value}",
            },
            axisTick: {
              show: false,
            },
            nameTextStyle: {
              color: "#fff",
            },
          },
          series: {
            type: "line",
            showSymbol: true,
            itemStyle: {
              normal: {
                color: "#4DC9FB", //改变折线点的颜色
                lineStyle: {
                  color: "#4DC9FB", //改变折线颜色
                },
              },
            },
            label: {
              show: false,
              position: "top",
              textStyle: {
                color: "#4DC9FB",
              },
            },
            areaStyle: {
              normal: {
                color: new echarts.graphic.LinearGradient(
                  0,
                  0,
                  0,
                  1,
                  [
                    {
                      offset: 0,
                      color: " rgba(77,201,251,0.5)",
                    },
                    {
                      offset: 1,
                      color: "rgba(77,201,251,0)",
                    },
                  ],
                  false
                ),
              },
            },
            data: that.value1, //data.values
          },
        };
        //随着屏幕大小调节图表

        this.myChart = echarts.init(document.getElementById("peakEcharts"));
        this.myChart.setOption(option);

        window.addEventListener("resize", () => {
          that.myChart.resize();
        });
        // echarts 万能点击事件
        // this.myChart.getZr().on('click', params => {
        //   let pointInPixel = [params.offsetX, params.offsetY]
        //   if (this.myChart.containPixel('grid', pointInPixel)) {
        //     //点击第几个柱子
        //     let pointInGrid = this.myChart.convertFromPixel({seriesIndex: 0}, pointInPixel)
        //     // 也可以通过params.offsetY 来判断鼠标点击的位置是否是图表展示区里面的位置
        //     // 也可以通过name[xIndex] != undefined,name是x轴的坐标名称来判断是否还是点击的图表里面的内容
        //     // x轴数据的索引
        //     let xIndex = pointInGrid[0]
        //     let timeValue = that.timeValue[xIndex];
        //     console.log('当前点击的索引', timeValue);
        //     that.$store.state.popWindow = true;
        //     that.$store.state.toggleCtp = "peak-noise-detail";
        //     that.$store.state.dialogCommonValue = timeValue;
        //     localStorage.setItem("firstName", "peak-noise-detail");
        //   }
        // });
      },
    },
  }
</script>

<style scoped>
  .font {
    height: 16px;
    font-size: 14px;
    font-family: MicrosoftYaHeiLight;
    color: #DEF1FF;
    line-height: 16px;
    margin-top: 11px;
    margin-left: 33px;
  }
</style>


 7373
7373


 被折叠的 条评论
为什么被折叠?


