


10.1 使用w查看系统负载
w命令可以查看谁登录了这台主机,并且在做什么。
 11:30:43 up 20 min,  2 users,  load average: 0.00, 0.01, 0.04
USER     TTY      FROM             LOGIN@   IDLE   JCPU   PCPU WHAT
root     tty1                      11:30   11.00s  0.02s  0.02s -bash
root     pts/0    192.168.16.1     11:10    3.00s  0.06s  0.02s w
第一行信息有当前时间,运行时间,用户数量,负载。
如果是网络登录,登录的就是pts/0的这种形式,如果是直接登录,会显示tty1的形式。
系统负载后的三个数字分别表示系统在1min,5min,15min的系统负载,数字表示单位时间内使用cpu的活动的进程有多少个。
这个数字多少比较合适,与逻辑cpu的数量相关。
[root@localhost: ~]# head -5 /proc/cpuinfo
processor	: 0
vendor_id	: GenuineIntel
cpu family	: 6
model		: 94
model name	: Intel(R) Core(TM) i7-6700 CPU @ 3.40GHz
第一行数字是0,表明我们只有1个逻辑cpu,那么load average为1的时候就比较理想,既不闲置,也没有太大的压力。
对于一个主机,如果有n个逻辑cpu,那么负载数稍稍小于n,就是理想状态。
还有一个uptime命令,显示的就是w的第一行。
[root@localhost: ~]# uptime
 11:41:11 up 31 min,  2 users,  load average: 0.00, 0.01, 0.04
10.2 vmstat命令
当系统负载大于逻辑cpu数的时候,我们需要继续查看我们主机的状态,这时候需要vmstat命令,它可以查看虚拟内存的使用情况。
[root@localhost: ~]# vmstat
procs -----------memory---------- ---swap-- -----io---- -system-- ------cpu-----
 r  b   swpd   free   buff  cache   si   so    bi    bo   in   cs us sy id wa st
 1  0      0 3517740   2084 186480    0    0    13     1   30   25  0  0 100  0  0
常见用法是vmstat n m,每n秒显示1次,一共显示m次。
需要关注的列是r, b, swpd, si, so, bi, bo, us, wa。
run表示多少个进程处于run的状态。不论是正在运行还是在队列中,都是run状态。
block表示等待网络或者硬盘数据的进程数。这是不可中断的。
swpd表示虚拟内存的使用量。如果数字在一直变动,说明交换分区和内存在频繁的交换数据,内存不足的表现。
si有多少kb的数据从硬盘中进入到内存。
so有多少kb的数据从内存进入到硬盘。
bi从磁盘中出来进入到内存里去,即内存读取。
bo内存写入硬盘。#io读取写入很慢,会造成block。
us表示用户级别的进程、资源占用量(0-100%)。长时间大于50即需要排查问题了。
sy是系统进程,id是空闲。
wait等待io所耗费的时间。
通过以上参数可以简单排查出系统的瓶颈。
10.3 top命令
top - 16:02:15 up  4:52,  2 users,  load average: 0.00, 0.01, 0.05
Tasks: 123 total,   1 running, 122 sleeping,   0 stopped,   0 zombie
%Cpu(s):  0.0 us,  0.0 sy,  0.0 ni,100.0 id,  0.0 wa,  0.0 hi,  0.0 si,  0.0 st
KiB Mem :  3872592 total,  3481560 free,   180524 used,   210508 buff/cache
KiB Swap:  4194300 total,  4194300 free,        0 used.  3440900 avail Mem

  PID USER      PR  NI    VIRT    RES    SHR S  %CPU %MEM     TIME+ COMMAND
  312 root      20   0       0      0      0 S   0.3  0.0   0:00.64 xfsaild/sda3
    1 root      20   0  128084   6660   4124 S   0.0  0.2   0:02.08 systemd
    2 root      20   0       0      0      0 S   0.0  0.0   0:00.02 kthreadd
    3 root      20   0       0      0      0 S   0.0  0.0   0:00.02 ksoftirqd/0
    5 root       0 -20       0      0      0 S   0.0  0.0   0:00.00 kworker/0:0H
    6 root      20   0       0      0      0 S   0.0  0.0   0:00.64 kworker/u128:0
    7 root      rt   0       0      0      0 S   0.0  0.0   0:00.01 migration/0
    8 root      20   0       0      0      0 S   0.0  0.0   0:00.00 rcu_bh
    9 root      20   0       0      0      0 S   0.0  0.0   0:00.92 rcu_sched
   10 root       0 -20       0      0      0 S   0.0  0.0   0:00.00 lru-add-drain
   11 root      rt   0       0      0      0 S   0.0  0.0   0:00.11 watchdog/0
   12 root      rt   0       0      0      0 S   0.0  0.0   0:00.07 watchdog/1
   13 root      rt   0       0      0      0 S   0.0  0.0   0:00.07 migration/1
   14 root      20   0       0      0      0 S   0.0  0.0   0:00.00 ksoftirqd/1
   15 root      20   0       0      0      0 S   0.0  0.0   0:00.41 kworker/1:0
   16 root       0 -20       0      0      0 S   0.0  0.0   0:00.00 kworker/1:0H
   17 root      rt   0       0      0      0 S   0.0  0.0   0:00.07 watchdog/2
   18 root      rt   0       0      0      0 S   0.0  0.0   0:00.01 migration/2
   19 root      20   0       0      0      0 S   0.0  0.0   0:00.02 ksoftirqd/2
   21 root       0 -20       0      0      0 S   0.0  0.0   0:00.00 kworker/2:0H
   22 root      rt   0       0      0      0 S   0.0  0.0   0:00.06 watchdog/3
   23 root      rt   0       0      0      0 S   0.0  0.0   0:00.07 migration/3
   24 root      20   0       0      0      0 S   0.0  0.0   0:00.00 ksoftirqd/3
   26 root       0 -20       0      0      0 S   0.0  0.0   0:00.00 kworker/3:0H
   28 root      20   0       0      0      0 S   0.0  0.0   0:00.01 kdevtmpfs
   29 root       0 -20       0      0      0 S   0.0  0.0   0:00.00 netns
   30 root      20   0       0      0      0 S   0.0  0.0   0:00.00 khungtaskd
   31 root       0 -20       0      0      0 S   0.0  0.0   0:00.00 writeback
   32 root       0 -20       0      0      0 S   0.0  0.0   0:00.00 kintegrityd
   33 root       0 -20       0      0      0 S   0.0  0.0   0:00.00 bioset
   34 root       0 -20       0      0      0 S   0.0  0.0   0:00.00 kblockd
   35 root       0 -20       0      0      0 S   0.0  0.0   0:00.00 md
   36 root       0 -20       0      0      0 S   0.0  0.0   0:00.00 edac-poller
   42 root      20   0       0      0      0 S   0.0  0.0   0:00.00 kswapd0
   43 root      25   5       0      0      0 S   0.0  0.0   0:00.00 ksmd
top命令是每3s刷新一次,q可以退出。
同样第一行也是uptime信息。
第二行列出的是总进程、running进程、sleeping进程、stopped进程和zombie进程。
(主程序意外关闭,子进程就会变为zombie进程)
第三行列出的是vmstat的总信息。
占用cpu的百分比和负载还是有区别的,负载可以很高的同时系统cpu占用可以很低。cpu长时间处于高负荷状态会造成寿命下降,速度下降。
第四行和第五行是内存和交换分区信息。
再下面就是每一个进程的信息了。
       16. PR  --  Priority
           The scheduling priority of the task.  If you see `rt' in this field, it means the task is running under real time scheduling priority.

           Under  linux,  real  time priority is somewhat misleading since traditionally the operating itself was not preemptible.  And while the 2.6 kernel can be
           made mostly preemptible, it is not always so.

       17. RES  --  Resident Memory Size (KiB)
           The non-swapped physical memory a task is using.
使用<>可以左右按照关键字排序
  Z,B,E,e   Global: 'Z' colors; 'B' bold; 'E'/'e' summary/task memory scale
  l,t,m     Toggle Summary: 'l' load avg; 't' task/cpu stats; 'm' memory info
  0,1,2,3,I Toggle: '0' zeros; '1/2/3' cpus or numa node views; 'I' Irix mode
  f,F,X     Fields: 'f'/'F' add/remove/order/sort; 'X' increase fixed-width

  L,&,<,> . Locate: 'L'/'&' find/again; Move sort column: '<'/'>' left/right
  R,H,V,J . Toggle: 'R' Sort; 'H' Threads; 'V' Forest view; 'J' Num justify
  c,i,S,j . Toggle: 'c' Cmd name/line; 'i' Idle; 'S' Time; 'j' Str justify
  x,y     . Toggle highlights: 'x' sort field; 'y' running tasks
  z,b     . Toggle: 'z' color/mono; 'b' bold/reverse (only if 'x' or 'y')
  u,U,o,O . Filter by: 'u'/'U' effective/any user; 'o'/'O' other criteria
  n,#,^O  . Set: 'n'/'#' max tasks displayed; Show: Ctrl+'O' other filter(s)
  C,...   . Toggle scroll coordinates msg for: up,down,left,right,home,end

  k,r       Manipulate tasks: 'k' kill; 'r' renice
  d or s    Set update interval
  W,Y       Write configuration file 'W'; Inspect other output 'Y'
  q         Quit
top -c可以查看某个进程的命令
[root@localhost: ~]# top -c
top - 16:29:03 up  5:18,  2 users,  load average: 0.00, 0.01, 0.05
Tasks: 123 total,   1 running, 122 sleeping,   0 stopped,   0 zombie
%Cpu(s):  0.0 us,  0.0 sy,  0.0 ni,100.0 id,  0.0 wa,  0.0 hi,  0.0 si,  0.0 st
KiB Mem :  3872592 total,  3481972 free,   180108 used,   210512 buff/cache
KiB Swap:  4194300 total,  4194300 free,        0 used.  3441352 avail Mem

  PID USER      PR  NI    VIRT    RES    SHR S  %CPU %MEM     TIME+ COMMAND
    1 root      20   0  128084   6660   4124 S   0.0  0.2   0:02.10 /usr/lib/systemd/systemd --switched-root --system --deserialize 22
    2 root      20   0       0      0      0 S   0.0  0.0   0:00.02 [kthreadd]
    3 root      20   0       0      0      0 S   0.0  0.0   0:00.03 [ksoftirqd/0]
top -bn1可以一次全部显示出来,用户写脚本。
       -b  :Batch-mode operation
            Starts top in Batch mode, which could be useful for sending output from top to other programs or to a file.  In this mode, top will  not  accept  input
            and runs until the iterations limit you've set with the `-n' command-line option or until killed.
       -n  :Number-of-iterations limit as:  -n number
            Specifies the maximum number of iterations, or frames, top should produce before ending.
10.4 sar命令
sar是一个十分全面的分析系统的命令。linux系统里的瑞士军刀。
它的包是sysstat,可以使用yum下载。
sar每整10分钟会记录一次主机的历史,如果是刚安装的sar,直接运行的时候可能会出现找不到文件的错误。
[root@localhost: ~]# ls /var/log/sa/
sa03  sa04  sa05  sa06  sa10  sa27  sa29  sa30
我们主要介绍如何使用sar命令查看网卡流量。
[root@localhost: ~]# sar -n DEV 1 1
Linux 3.10.0-862.3.3.el7.x86_64 (localhost.localdomain) 	07/10/2018 	_x86_64_	(4 CPU)

04:44:32 PM     IFACE   rxpck/s   txpck/s    rxkB/s    txkB/s   rxcmp/s   txcmp/s  rxmcst/s
04:44:33 PM        lo      0.00      0.00      0.00      0.00      0.00      0.00      0.00
04:44:33 PM     ens33      0.00      0.00      0.00      0.00      0.00      0.00      0.00

Average:        IFACE   rxpck/s   txpck/s    rxkB/s    txkB/s   rxcmp/s   txcmp/s  rxmcst/s
Average:           lo      0.00      0.00      0.00      0.00      0.00      0.00      0.00
Average:        ens33      0.00      0.00      0.00      0.00      0.00      0.00      0.00
每一段代表的意思是
              IFACE
                     Name of the network interface for which statistics are reported.

              rxpck/s
                     Total number of packets received per second.

              txpck/s
                     Total number of packets transmitted per second.

              rxkB/s
                     Total number of kilobytes received per second.

              txkB/s
                     Total number of kilobytes transmitted per second.

              rxcmp/s
                     Number of compressed packets received per second (for cslip etc.).

              txcmp/s
                     Number of compressed packets transmitted per second.

              rxmcst/s
                     Number of multicast packets received per second.
正常情况下,接受的数据包或者数据比特量单位时间内多少算合适呢?
一个在线的主机,数据包在几千是比较正常的,比特数要看带宽。
查看一个月内的历史数据。
[root@localhost: ~]# sar -n DEV -f /var/log/sa/sa10历史文件命名以sa开头,以日期结尾,保留一个月。
查看负载使用-q选项,多用于查询历史文件,因为当前负载使用w命令即可。
下面的命令可以查看磁盘读写。
[root@localhost: ~]# sar -b 1 1
Linux 3.10.0-862.3.3.el7.x86_64 (localhost.localdomain) 	07/10/2018 	_x86_64_	(4 CPU)

05:17:59 PM       tps      rtps      wtps   bread/s   bwrtn/s
05:18:00 PM      0.00      0.00      0.00      0.00      0.00
Average:         0.00      0.00      0.00      0.00      0.00
对于sa生成的sa10这种文件是不能被cat的,但是sar10可以直接被cat。
sar10文件会在第二天自动生成(如果支持的话)。
10.5 nload命令
nload可以动态的显示各个网卡的实时信息,使用方向键可以选择想选择的网卡。
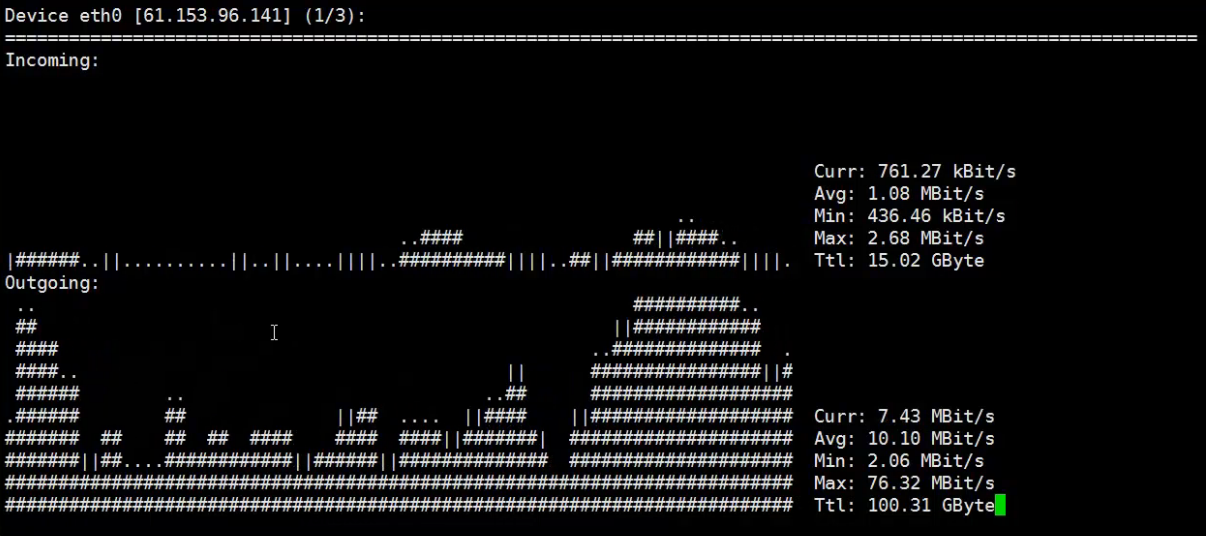
如果受到了网络攻击,进入的流量就会激增;而如果带宽不够用,出去的流量就会拉满。


 256
256

 被折叠的 条评论
为什么被折叠?
被折叠的 条评论
为什么被折叠?
 到【灌水乐园】发言


