


环境说明
监控机10.0.0.200
服务器10.0.0.201
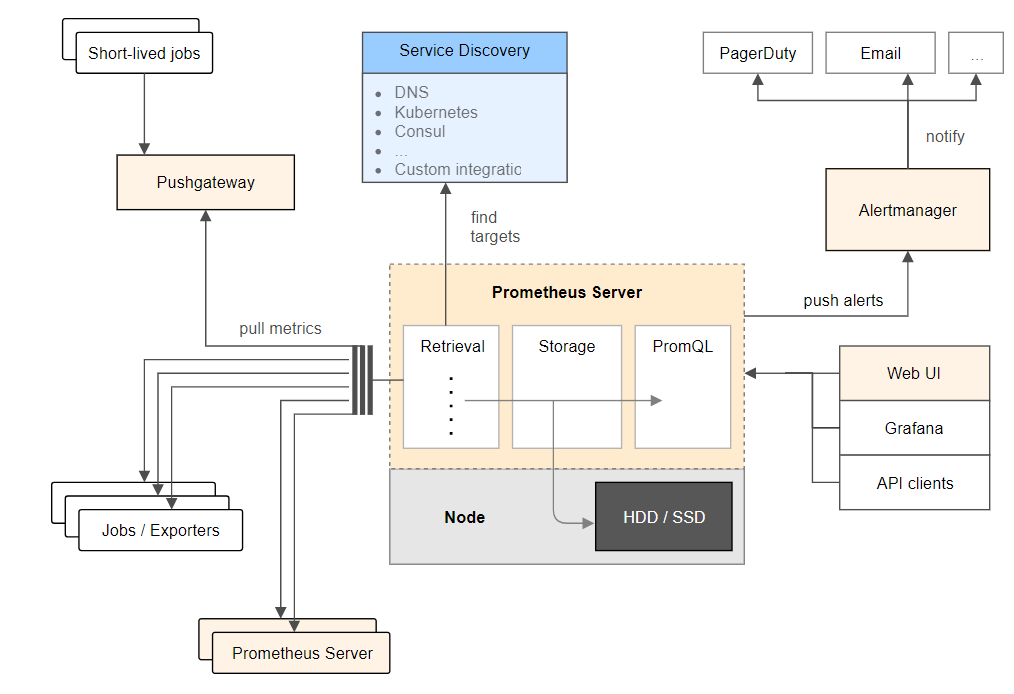
Prometheus的架构
在被监控服务器10.0.0.201安装exporter
安装node_exporter
tar zxvf node_exporter-0.15.1.linux-amd64.tar.gz
cd node_exporter-0.15.1.linux-amd64
nohup ./node_exporter &
安装mysqld_exporter
连接mysql授予权限mysql -uroot -p
GRANT REPLICATION CLIENT
,
PROCESS ON
*.*
TO
'exporter'
@
'localhost'
identified
by
'123456'
;
GRANT SELECT ON performance_schema
.*
TO
'exporter'
@
'localhost'
;
flush privileges
;
tar zxvf mysqld_exporter-0.10.0.linux-amd64
cd mysqld_exporter-0.10.0.linux-amd64
建立配置文件my.cnf
[client]
user=exporter
password=123456
运行mysqld exporter
nohup ./mysqld_exporter -config.my-cnf="my.cnf" &
在监控主机10.0.0.200安装Prometheus
tar zxvf prometheus-2.0.0.linux-amd64.tar.gz
cd prometheus-2.0.0.linux-amd64
prometheus.yml
global:
  scrape_interval:     5s # By default, scrape targets every 15 seconds.
  evaluation_interval: 15s

  # Attach these labels to any time series or alerts when communicating with
  # external systems (federation, remote storage, Alertmanager).
  #external_labels:
  #  monitor: 'codelab-monitor'

scrape_configs:
  - job_name: prometheus
    static_configs:
      - targets: ['10.0.0.200:9090']
        labels:
          instance: prometheus

  - job_name: linux
    static_configs:
      - targets: ['10.0.0.201:9100']
        labels:
          instance: db1

  - job_name: mysql
    static_configs:
      - targets: ['10.0.0.201:9104']
        labels:
          instance: db1
运行prometheus
nohup prometheus &
打开浏览器访问http://10.0.0.200:9090
查看Status->Target

安装Grafana
yum install fontconfig
yum install freetype*
yum install urw-fonts
Package details
- Installs binary to /usr/sbin/grafana-server
- Copies init.d script to /etc/init.d/grafana-server
- Installs default file (environment vars) to /etc/sysconfig/grafana-server
- Copies configuration file to /etc/grafana/grafana.ini
- Installs systemd service (if systemd is available) name grafana-server.service
- The default configuration uses a log file at /var/log/grafana/grafana.log
- The default configuration specifies an sqlite3 database at /var/lib/grafana/grafana.db
编辑配置文件/etc/grafana/grafana.ini
找到[dashboards.json]
enabled = true
path = /var/lib/grafana/dashboards
安装dashboards
git clone https://github.com/percona/grafana-dashboards.git
cp -r grafana-dashboards/dashboards /var/lib/grafana/
运行grafana server
systemctl start grafana-server
访问grafana服务器
通过浏览器访问http://10.0.0.200:3000, 默认用户名和密码是admin
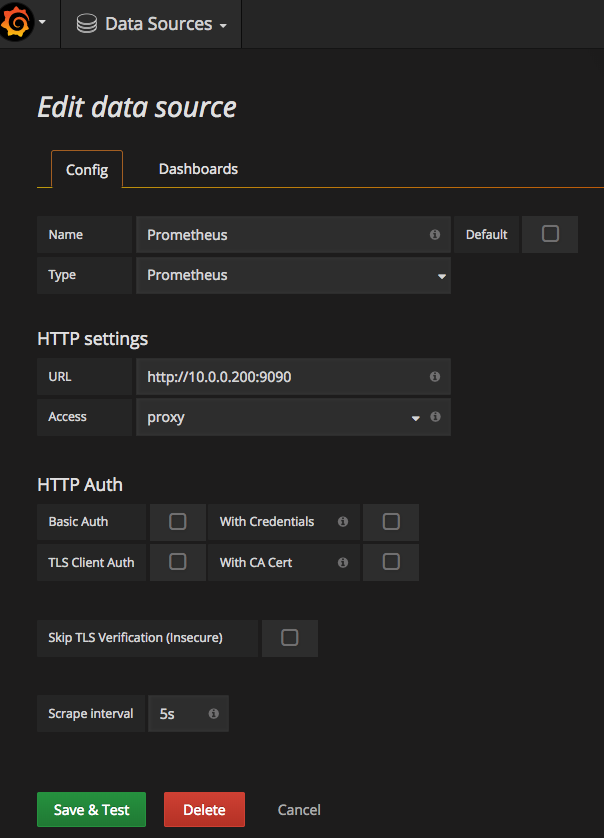
建立数据源
查看dashboard
以下展现的是node_exporter采集的数据

以下展现的是mysqld_exporter采集的数据
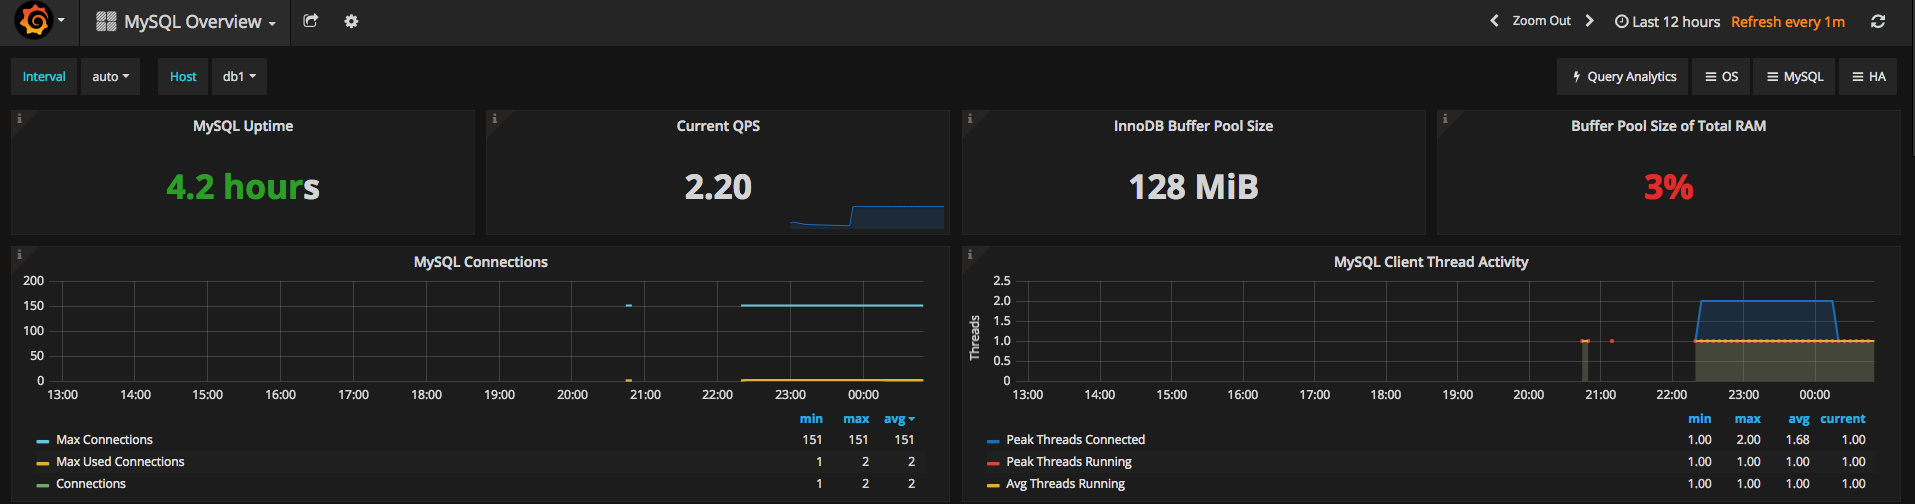
grafana的图表展现比cacti之类的确实漂亮多了。
参考资料


 1948
1948

 被折叠的 条评论
为什么被折叠?
被折叠的 条评论
为什么被折叠?
 到【灌水乐园】发言


