目录
1、后台采用SpringBoot框架,持久层采用MyBatisPlus框架
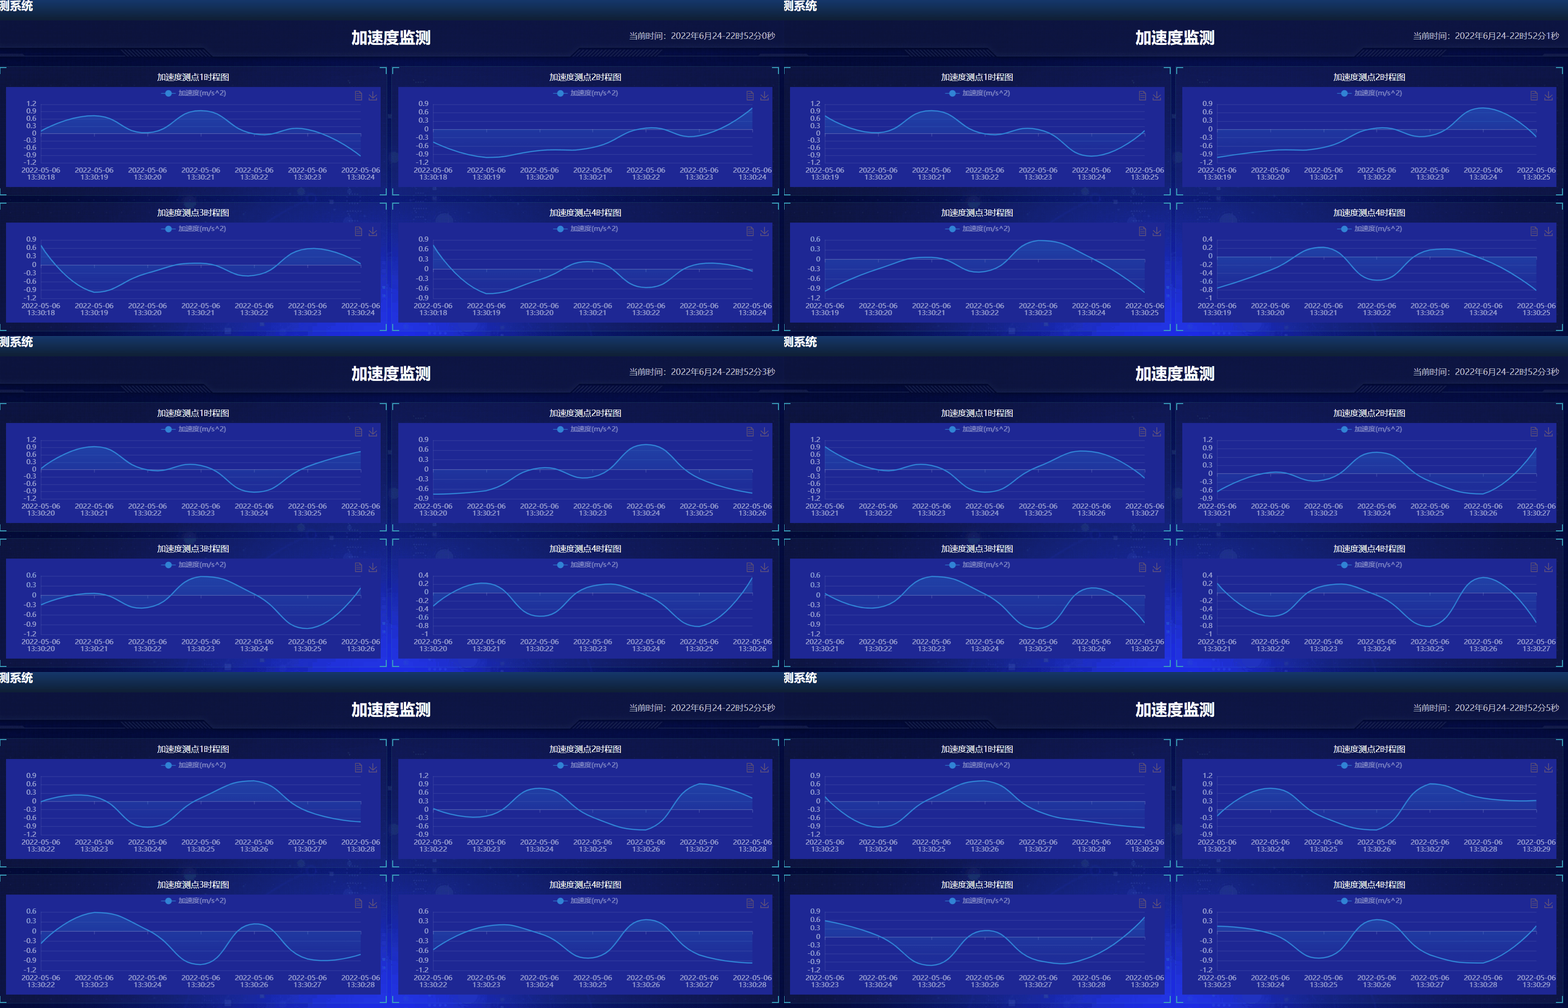
应用效果展示:

1、后台采用SpringBoot框架,持久层采用MyBatisPlus框架
- 拟对加速度传感器进行监测并且展示,首先在MySQL建立加速度传感器表:acceleration_sensor1
DROP TABLE IF EXISTS `acceleration_sensor1`; CREATE TABLE `acceleration_sensor1` ( `id` bigint(11) NOT NULL AUTO_INCREMENT, `time_value` varchar(50) CHARACTER SET utf8 COLLATE utf8_general_ci NOT NULL, `value` double NOT NULL, PRIMARY KEY (`id`) USING BTREE ) ENGINE = InnoDB AUTO_INCREMENT = 10001 CHARACTER SET = utf8 COLLATE = utf8_general_ci ROW_FORMAT = Dynamic; - 对应实体类
/**
 * @author ZayneChen
 * @date 2022年06月16日 22:55
 */
@Data
public class AccelerationSensor1 {
    private Long id;
    private String timeValue;
    private Double value;
}- dao:
/**
 * @author ZayneChen
 * @date 2022年06月16日 21:50
 */
@Mapper
public interface AccelerationSensor1Dao extends BaseMapper<AccelerationSensor1> {
}- service:
/**
 * @author ZayneChen
 * @date 2022年06月16日 21:52
 */
public interface AccelerationSensor1Service extends IService<AccelerationSensor1> {
}- serviceimpl:
/**
 * @author ZayneChen
 * @date 2022年06月16日 23:03
 */
@Service
public class AccelerationSensor1ServiceImpl extends ServiceImpl<AccelerationSensor1Dao, AccelerationSensor1> implements AccelerationSensor1Service {
}-
在测试类中,给加速度传感器表假设了10000条假数据:
/**
 * @author ZayneChen
 * @date 2022年06月16日 23:05
 */
@SpringBootTest
public class acc1Test {
    @Autowired
    private AccelerationSensor1Service testService;

    @Test
    public void test1() {
        AccelerationSensor1 test1 = new AccelerationSensor1();
        // 假设起始时间
        long l= Date.parse("Mon 6 May 2022 13:30:00");
        Date date = new Date(l);
        SimpleDateFormat formatter= new SimpleDateFormat("yyyy-MM-dd HH:mm:ss");

        // 正负号数组(为随机的加速度值的正负做准备)
        int[] ints = new int[2];
        ints[0] = -1;
        ints[1] = 1;
        // 添加10000条假数据,一秒一条,值的大小在-1~1之间
        for (int i = 0; i < 10000; i++) {
            // 确定时间
            date.setTime(date.getTime()+1000);
            String time1 = formatter.format(date);
            //System.out.println(time1);

            // 确定值
            int index = (int) Math.floor(Math.random()*2);
            //System.out.println(index);
            double random = Math.random()*ints[index];
            DecimalFormat df = new DecimalFormat("0.000");
            double result = Double.parseDouble(df.format(random));
            //System.out.println(result);

            test1.setTimeValue(time1);
            test1.setValue(result);
            System.out.println(test1);
            testService.save(test1);
        }

    }

}
2、前端界面搭建及发送异步请求
- 主界面
<!DOCTYPE html>
<html lang="en">

<head>
    <meta charset="UTF-8">
    <meta http-equiv="X-UA-Compatible" content="IE=edge">
    <meta name="viewport" content="width=device-width, initial-scale=1.0">
    <title>数据可视化</title>
    <link rel="stylesheet" href="css/index.css">

</head>
<style>
    button {
        /*position: fixed;*/
        float: left;
        margin-top: 10px;
        margin-left: 20px;
        width: 80px;
        height: 40px;
        font-size: 20px;
        font-weight: bold;
        background-color: #154b7a;
        color: white;
        cursor: pointer;
    }
    h1 {
        text-align: center;
    }
</style>
<body>
<!-- 头部的盒子 -->
<header>
<!--    <button id = "btn1">返回</button>-->
    <h1>加速度监测</h1>
    <div class="showTime"></div>
    <script>
        var t = null;
        t = setTimeout(time, 1000); //開始运行
        function time() {
            clearTimeout(t); //清除定时器
            dt = new Date();
            var y = dt.getFullYear();
            var mt = dt.getMonth() + 1;
            var day = dt.getDate();
            var h = dt.getHours(); //获取时
            var m = dt.getMinutes(); //获取分
            var s = dt.getSeconds(); //获取秒
            document.querySelector(".showTime").innerHTML =
                "当前时间:" +
                y +
                "年" +
                mt +
                "月" +
                day +
                "-" +
                h +
                "时" +
                m +
                "分" +
                s +
                "秒";
            t = setTimeout(time, 1000); //设定定时器,循环运行
        }
    </script>
</header>

<!-- 页面主体部分 -->
<section class="mainbox">
    <div class="column">
        <div class="panel bar">
            <h2>加速度测点1时程图</h2>
            <div class="chart"></div>
            <div class="panel-footer"></div>
        </div>
        <div class="panel line">
            <h2>加速度测点3时程图</h2>
            <div class="chart">图表</div>
            <div class="panel-footer"></div>
        </div>
        <div class="panel pie">
            <h2>加速度测点5时程图</h2>
            <div class="chart">图表</div>
            <div class="panel-footer"></div>
        </div>
    </div>
    <div class="column">
        <div class="panel bar2">
            <h2>加速度测点2时程图</h2>
            <div class="chart"></div>
            <div class="panel-footer"></div>
        </div>
        <div class="panel line2">
            <h2>加速度测点4时程图</h2>
            <div class="chart">
            </div>
            <div class="panel-footer"></div>
        </div>
        <div class="panel pie2">
            <h2>加速度测点6时程图</h2>
            <div class="chart">图表</div>
            <div class="panel-footer"></div>
        </div>
    </div>
</section>
<script src="js/flexible.js"></script>
<script src="js/jquery.js"></script>
<script src="js/echarts.min.js"></script>
<script src="js/acc1.js"></script>
<script src="js/acc2.js"></script>
<script src="js/acc3.js"></script>
<script src="js/acc4.js"></script>
<script src="js/acc5.js"></script>
<script src="js/acc6.js"></script>

</body>

</html>- acc1.js即加速度传感器1的脚本,包含了EChaerts和发送异步请求部分
// 加速度1模块制作

    // 判断数据数组的大小的方法,若数组大小达到8时,移除第一个数组数据
    function arrLarge(arr) {
        if (arr.length == 8) {
            arr.splice(0, 1);
        }
    }

    // 主函数,发送异步请求到后台查询数据库中的数据并赋值到对应数组中
    function mainSelAcc1() {
        // 先判断对应数组大小
        arrLarge(acc1x);
        arrLarge(acc1y);
        $.ajax({
            url: "acc1Servlet",
            data: {},
            type: "GET",
            async: true,
            dataType: "json",
            success: function (data) {
                acc1x.push(data.timeValue);
                acc1y.push(data.value);
            }
        })

    // 1. 实例化EChart对象
    var myChart1 = echarts.init(document.querySelector(".bar .chart"));
    let acc1x = new Array(); // 横坐标为时间
    let acc1y = new Array(); // 纵坐标为具体加速度值

        // 2. 指定配置
        var option = {
            backgroundColor: '#172693',
            toolbox: {
                show: true,
                feature: {
                    dataView: {readOnly: false},
                    saveAsImage: {}
                }
            },
            tooltip: {
                trigger: 'axis'

            },
            legend: {
                top: '0%',
                // data: ['邮件营销', '联盟广告'],
                textStyle: {
                    color: "rgba(255,255,255,.5)",
                    fontSize: "12"
                }
            },

            grid: {
                left: "30",
                top: "30",
                right: "35",
                bottom: "10",
                containLabel: true
            },
            xAxis: [{
                // 文本颜色为rgba(255,255,255,.6)  文字大小为 12
                axisLabel: {
                    textStyle: {
                        color: "rgba(255,255,255,.6)",
                        fontSize: 12
                    }
                },
                // x轴线的颜色为   rgba(255,255,255,.2)
                axisLine: {
                    lineStyle: {
                        color: "rgba(255,255,255,.2)"
                    }
                },
                type: 'category',
                boundaryGap: false,
                data: acc1x.map(function (str) {
                    return str.replace(' ', '\n');
                })
            }],
            yAxis: [{
                axisTick: {show: false},
                axisLine: {
                    lineStyle: {
                        color: "rgba(255,255,255,.1)"
                    }
                },
                axisLabel: {
                    textStyle: {
                        color: "rgba(255,255,255,.6)",
                        fontSize: 12
                    }
                },
                // 修改分割线的颜色
                splitLine: {
                    lineStyle: {
                        color: "rgba(255,255,255,.1)"
                    }
                },
                type: 'value'
            }],
            series: [{
                name: '加速度(m/s^2)',
                type: 'line',
                smooth: true,
                // 单独修改当前线条的样式
                lineStyle: {
                    color: "#0184d5",
                    width: 2
                },
                // 填充颜色设置
                areaStyle: {
                    // 渐变色,只需要复制即可
                    color: new echarts.graphic.LinearGradient(
                        0,
                        0,
                        0,
                        1, [{
                            offset: 0,
                            color: "rgba(1, 132, 213, 0.4)" // 渐变色的起始颜色
                        },
                            {
                                offset: 0.8,
                                color: "rgba(1, 132, 213, 0.1)" // 渐变线的结束颜色
                            }
                        ],
                        false
                    ),
                    shadowColor: "rgba(0, 0, 0, 0.1)"
                },
                // 设置拐点 小圆点
                symbol: "circle",
                // 拐点大小
                symbolSize: 8,
                // 设置拐点颜色以及边框
                itemStyle: {
                    color: "#0184d5",
                    borderColor: "rgba(221, 220, 107, .1)",
                    borderWidth: 12
                },
                // 开始不显示拐点, 鼠标经过显示
                showSymbol: false,
                data: acc1y
            }]
        };
        myChart1.setOption(option);
        // 4.让我们的图表跟随屏幕自动的去适应
        window.addEventListener("resize", function () {
            myChart1.resize()
        })
    }
    // 使用立即执行函数,每隔1秒调用主函数
    $(function () {
        setInterval("mainSelAcc1()", "1000");
    })
3、后台Controller层
- 从id为0时开始查取数据,前端每秒发送一次异步请求,id自增
/**
 * @author ZayneChen
 * @date 2022年06月17日 13:32
 */
@RestController
public class Acc1Controller {
    long id = 0L;

    @Autowired
    private AccelerationSensor1Service accelerationSensor1Service;

    @RequestMapping("/acc1Servlet")
    public AccelerationSensor1 acc1() {

        AccelerationSensor1 accSensor1 = accelerationSensor1Service.getById(id);
        System.out.println(accSensor1);
        id++;
        return accSensor1;
    }

}


 本文展示了如何使用SpringBoot和MyBatisPlus搭建后端,实现实时监测加速度传感器数据,并通过前端异步请求与ECharts展示时序图。前端界面动态更新,每秒从数据库获取并显示最新数据。


 2524
2524

 被折叠的 条评论
为什么被折叠?


