


一、K-fold cross validation
from sklearn import datasets
from sklearn import ensemble
rf = ensemble.RandomForestRegressor(max_features = 'auto')
X, y = datasets.make_regression(10000, 10)
from sklearn import cross_validation
scores = cross_validation.cross_val_score(rf, X, y)
print(scores)
#[ 0.86310151  0.87504517  0.86335846]
scores = cross_validation.cross_val_score(rf, X, y, verbose=3, cv=4)
#[CV] no parameters to be set .........................................
#[CV] ................ no parameters to be set, score=0.867883 -   0.4s
#[CV] no parameters to be set .........................................
#[CV] ................ no parameters to be set, score=0.878830 -   0.4s
#[CV] no parameters to be set .........................................
#[CV] ................ no parameters to be set, score=0.869258 -   0.4s
#[CV] no parameters to be set .........................................
#[CV] ................ no parameters to be set, score=0.872930 -   0.4s
#[Parallel(n_jobs=1)]: Done   4 out of   4 | elapsed:    1.9s finished
二、Stratified k-fold
The class representation was unbalanced in some manner. Stratified k-fold is specifically designed to maintain the class proportions.
1. Create datasets
from sklearn import datasets
X, y = datasets.make_classification(n_samples=int(1e3),weights=[1./11])
y.mean()
# 0.90600000000000003 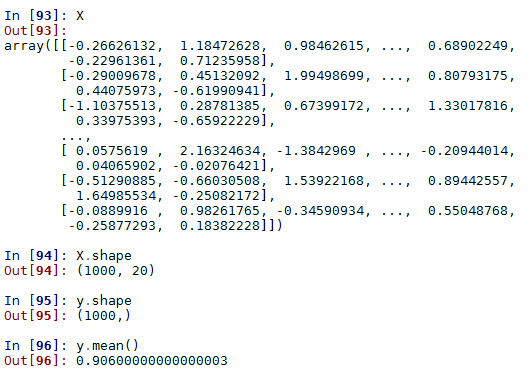
从以上数字可以看出,90.6%的样本为正,其余为负。
2. 对比Stratified k-fold and shuffle_split k-fold
from sklearn import cross_validation
n_folds = 50
strat_kfold = cross_validation.StratifiedKFold(y, n_folds = n_folds)
shuff_split = cross_validation.ShuffleSplit(n=len(y),n_iter=n_folds)

kfold_y_props = []
shuff_y_props = []

for (k_train,k_test), (s_train,s_test) in zip (strat_kfold,shuff_split):
    kfold_y_props.append(y[k_train].mean())
    shuff_y_props.append(y[s_train].mean())

import matplotlib.pyplot as plt
f, ax = plt.subplots(figsize=(7, 5))
ax.plot(range(n_folds), shuff_y_props, label = "ShuffleSplit")
ax.plot(range(n_folds),kfold_y_props,label = "Stratified", color='k', ls='--')
ax.set_title("Comparing class proportions")
ax.legend(loc='best') 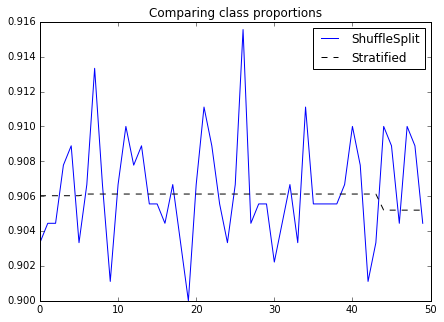
We can see that the proportion of each fold for stratified k-fold is stable across folds
3. for multiclasses
import numpy as np
three_classes = np.random.choice([1,2,3],p=[.1,.4,.5],size=1000)

import itertools as it
for train, test in cross_validation.StratifiedKFold(three_classes, 5):
    print(np.bincount(three_classes[train]))
# [  0  80 291 428]
# [  0  80 291 429]
# [  0  80 291 429]
# [  0  80 291 429]
# [  0  80 292 429]
三、Poor man’s grid search
1.选择两个参数维度
criteria = {gini, entropy}
max_features = {auto, log2, None}
parameter space = criteria * max_features
# Poor man's grid search
from sklearn import datasets
X, y = datasets.make_classification(n_samples = 2000, n_features=10)

criteria = {'gini','entropy'}
max_features = {'auto','log2',None}
import itertools as it
parameter_space = it.product(criteria, max_features)

import numpy as np
train_set = np.random.choice([True, False],size=len(y))
from sklearn.tree import DecisionTreeClassifier
accuracies = {}
for criterion, max_feature in parameter_space:
    print(criterion,max_feature)
    dt = DecisionTreeClassifier(criterion=criterion, max_features = max_feature)
    dt.fit(X[train_set],y[train_set])
    accuracies[(criterion,max_feature)] = (dt.predict(X[~train_set]) == y[~train_set]).mean()

print(accuracies)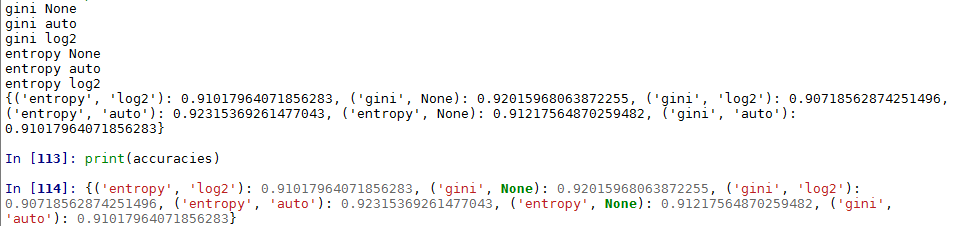
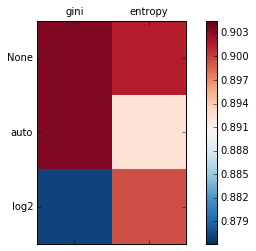
2. Visualize the results
# Visualize
from matplotlib import pyplot as plt
from matplotlib import cm

cmap = cm.RdBu_r
f, ax = plt.subplots(figsize=(7,4))
ax.set_xticklabels([''] + list(criteria))
ax.set_yticklabels([''] + list(max_features))
plot_array = []
for max_feature in max_features:
    m=[]
    for criterion in criteria:
        m.append(accuracies[(criterion, max_feature)])
    plot_array.append(m)
colors = ax.matshow(plot_array, vmin=np.min(list(accuracies.values()))-0.001,
                    vmax=np.max(list(accuracies.values()))+0.001,cmap=cmap)
f.colorbar(colors)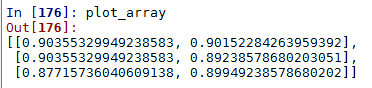
注意:python3中,accuracies.values()为字典格式,需要通过list()函数将其转化为列表形式的,否则会报错。

四、Brute force grid search
1. Create some classification data
# Brute force grid search
from sklearn.datasets import make_classification
X, y = make_classification(1000, n_features=5)
2.Create logistic regression object
from sklearn.linear_model import LogisticRegression
lr = LogisticRegression(class_weight='auto')
3. Grid Search
#lr.fit(X,y)
grid_search_params = {'penalty':['l1','l2'],
'C':[1,2,3,4]}
import scipy.stats as st
random_search_params = {'penalty':['l1','l2'],
'C':st.randint(1,4)}
#fit the classifier
from sklearn.grid_search import GridSearchCV, RandomizedSearchCV
gs = GridSearchCV(lr, grid_search_params)
gs.fit(X, y)
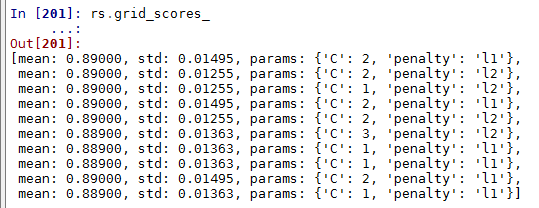
rs = RandomizedSearchCV(lr, random_search_params)
rs.fit(X, y)
gs.grid_scores_
rs.grid_scores_
max(gs.grid_scores_,key=lambda x : x[1])
max(rs.grid_scores_,key=lambda x : x[1])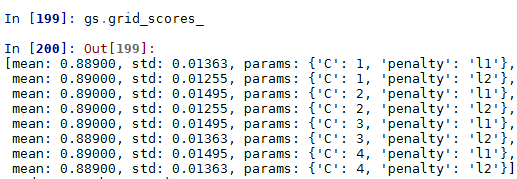


 700
700

 被折叠的 条评论
为什么被折叠?
被折叠的 条评论
为什么被折叠?
 到【灌水乐园】发言


