


(翻译说明:http://my.oschina.net/ywlaker/blog/468911)
Debugging your programs
调试程序
In this section, you will debug a Java program.
本小节,你将学会调试Java程序。
- In the Package Explorer view in the Java perspective, double-click junit.samples/VectorTest.java to open it in an editor.
在Java包管理器视图中,双击junit.samples/VectorTest.java 打开。 - Place your cursor on the vertical ruler along the left edge of the editor area on the following line in the setUp() method:
fFull.addElement (new Integer(1));and double-click on the ruler to set a breakpoint.
把光标放在编辑器中setUp() 方法左侧的垂直标尺上,然后双击设置断点。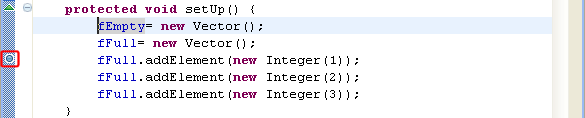
The breakpoint icon indicates the status of the breakpoint. The plain blue breakpoint icon indicates that the breakpoint has been set, but not yet installed.
断点图标标示了断点的状态。蓝色断点图标的意思是设置了断点,但还没有运行。Note: Once the class is loaded by the Java VM, the breakpoint will be installed and a checkmark overlay will be displayed on the breakpoint icon.
注意:当Java虚拟机加载类之后,断点将被触发,原有断点图标之上会显示一个箭头。 - In the Package Explorer view, select the junit.samples package and select Debug As, and then Java Application. When you run a program from a package, you will be prompted to choose a type from all classes in the package that define amainmethod.
在包管理器视图中,选择junit.samples 包右键选择Debug As,然后选择Java Application。当你直接从包层面运行程序时,会弹出提示框让你选择该包下定义了main方法的类。 - Select the VectorTest item in the dialog, then click OK.
选择VectorTest,点击OK。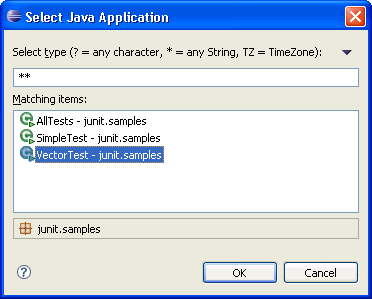
Note: You can also simply hit the debug button
 which will launch the currently selected resource or active editor. Select Java Application when you are prompted to select a way to debug VectorTest.
注意:点击 按钮就可以启动当前选择的类或者出于激活状态的编辑器代码。选择弹出提示框的Java Application 调试VectorTest。 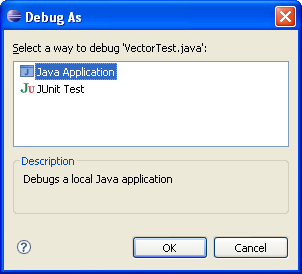
- The program will run until the breakpoint is reached. When the breakpoint is hit, execution is suspended, and you are asked whether to open the Debug perspective. Click Yes. Notice that the process is still active (not terminated) in the Debug view. Other threads might still be running.
程序会一直运行到断点处,到达断点时,程序被挂起,然后弹出是否打开调试视图的提示框,选择Yes。注意到此时程序并没有被终止,其他线程仍然在运行。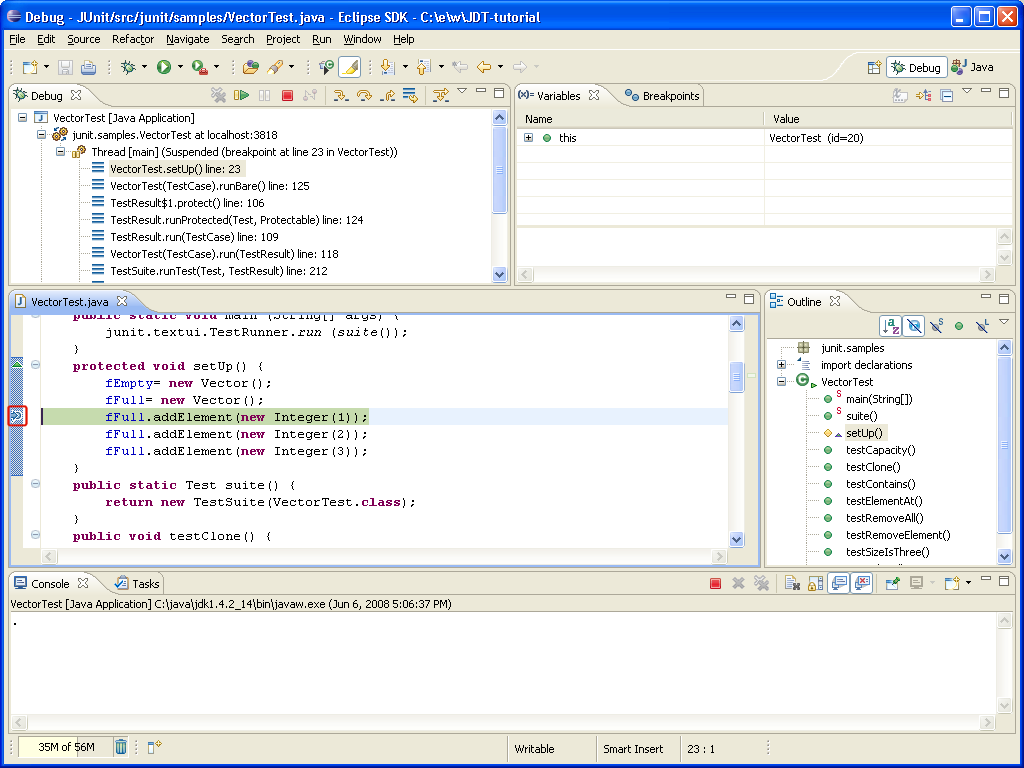
Note: The breakpoint now has a checkmark overlay
 since the class VectorTest was loaded in the Java VM.
注意:此时断点处的图标处多了一个箭头,因为VectorTest 类被加载到了Java虚拟机 - In the editor in the Debug perspective, selectnew Vector()from the line above where the breakpoint is set, and from its context menu, select Inspect.
在Debug视图的编辑器中,选择断点上一行的new Vector()代码,然后右键选择Inspect菜单。
- The expression is evaluated in the context of the current stack frame, and a pop-up appears which displays the results. You can send a result to the Expressions view by pressing the key binding displayed in the pop-up.
出现一个弹出框,显示了该表达式的计算结果。 - Expressions that you evaluate while debugging a program will be listed in this view. To delete an expression after working with it, select the expression and choose Remove from its context menu.
此处应该是打开Expressions视图,然后右键Watch,inspect看不到这个效果。
- The Variables view (available on a tab along with the Expressions view) displays the values of the variables in the selected stack frame. Expand the this.fFull tree in the Variables view until you can see elementCount.
变量视图中显示了当前堆栈中变量的值。逐步展开this.fFull tree 直到看见elementCount。
- The variables (e.g., elementCount) in the Variables view will change when you step through VectorTest in the Debug view. To step through the code, click the Step Over (
 ) button. Execution will continue at the next line in the same method (or, if you are at the end of a method, it will continue in the method from which the current method was called).
变量视图中的变量的值会随着程序的运行而改变,点击Step Over () 按钮步进调试程序 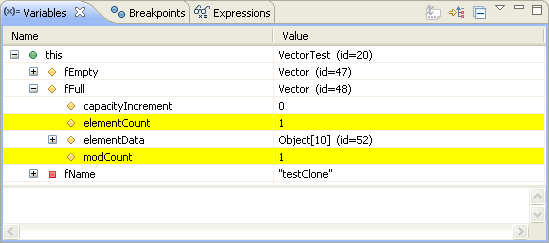
- In the variables view you can choose to see certain types as logical structures. This hides the implementation details of a type and simply shows it as arrays or fields. You can define logical structures by yourself in the preference page Java > Debug > Logical Structures.
在变量视图中可以查看类的逻辑结构,这些结构隐藏了类的具体实现,只是简单的将类中的数据以数组或者属性的方式显示出来。可以在Java > Debug > Logical Structures首选页中设置这个显示的逻辑结构。
- Try some other step buttons (Step Into
 , Step Return
  ) to step through the code. Note the differences in stepping techniques.
使用其他几种步进调试按钮,注意他们之间的区别。 - You can end a debugging session by allowing the program to run to completion or by terminating it.
停止调试有几种方式:


- You can continue to step over the code with the Step buttons until the program completes.
使用步进调试知道程序结束。 - You can click the Resume (
 ) button to allow the program to run until the next breakpoint is encountered or until the program is completed.
点击Resume () 按钮让程序运行到下一个断点处,或者结束程序。 - You can select Terminate from the context menu of the program's process in the Debug view to terminate the program.
在Debug视图中右键选择Terminate 菜单终止调试。


 449
449


 被折叠的 条评论
为什么被折叠?
被折叠的 条评论
为什么被折叠?
 到【灌水乐园】发言


