


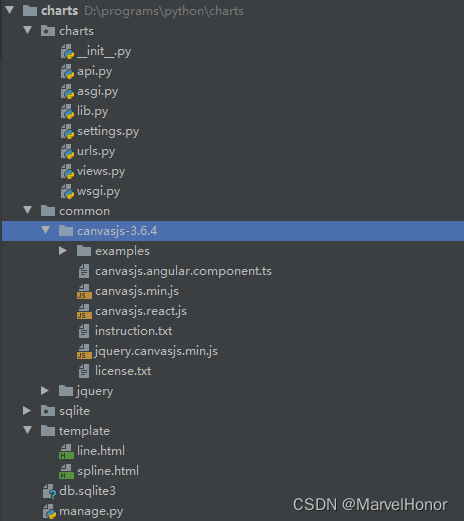
基于canvasjs实现数据的图表可视化,这个组件非常好用,而且漂亮,简单易集成。啥不多话,贴上最核心的代码先
资源:
canvasjs下载链接:https://canvasjs.com/download-html5-charting-graphing-library/?f=chart
setting.py增加代码:
STATIC_URL = 'static/'
STATICFILES_DIRS = [os.path.join(BASE_DIR,'common')]
控制器views.py
from django.shortcuts import HttpResponse,redirect,render
from django.http import JsonResponse,HttpRequest
from . import lib as lib

def line(request:HttpRequest):
    return render(request,"line.html")

def spline(request:HttpRequest):
    return render(request,"spline.html")
接口api.py
from django.shortcuts import HttpResponse,redirect,render
from django.http import JsonResponse,HttpRequest
from . import lib as lib
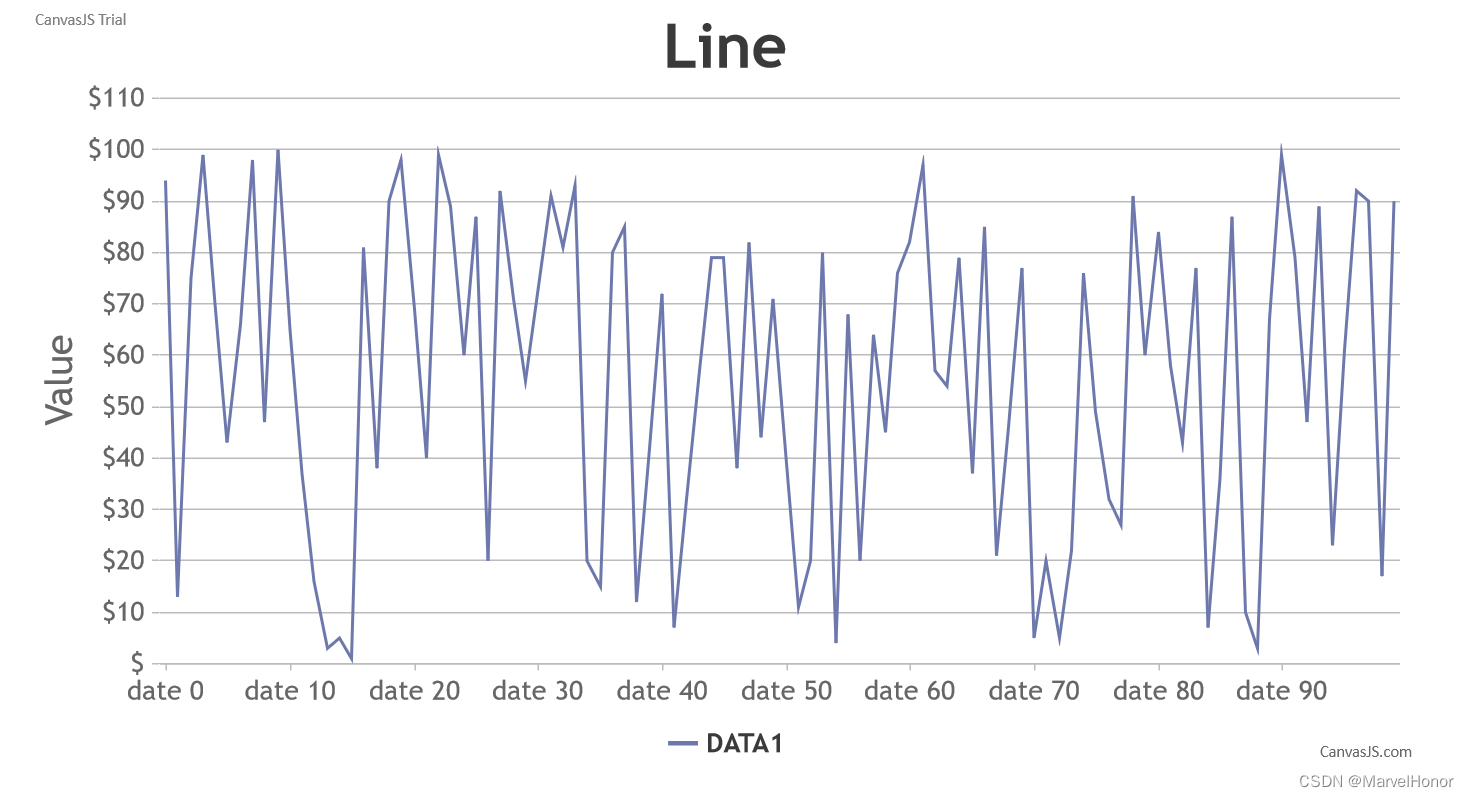
def line(request:HttpRequest):
points=lib.line_data()
return JsonResponse({
"animationEnabled": "true",
"theme": "light2",
"title":{
"text": "Line"
},
"axisY": {
"title": "Value",
"valueFormatString": "$#"
},
"legend": {
"cursor": "pointer",
"itemclick": "toggleDataSeries"
},
"data": [{
"name": "DATA1",
"showInLegend": "true",
"type": "line",
"dataPoints": [
{"label": p[0],"y":p[1]} for p in points
]
}]
})
def spline(request:HttpRequest):
points=lib.line_data()
return JsonResponse({
"animationEnabled": "true",
"exportEnabled": "true",
"theme": "light2",
"title":{
"text": "SPLine"
},
"axisY": {
"title": "Value",
"valueFormatString": "$#"
},
"legend": {
"cursor": "pointer",
"itemclick": "toggleDataSeries"
},
"data": [{
"name": "DATA1",
"showInLegend": "true",
"type": "spline",
"dataPoints": [
{"label": p[0],"y":p[1]} for p in points
]
}]
})路由器:
from django.contrib import admin
from django.urls import path
from . import views
from . import api
urlpatterns = [
    path('admin/', admin.site.urls),
    path('api/line/',api.line),
    path('api/spline/',api.spline),
    path('line/',views.line),
    path('spline/',views.spline)
]
库lib.py
from sqlite.SQLITE import SQLITE
from charts.settings import BASE_DIR
def line_data():
    sqlite=SQLITE(BASE_DIR / "db.sqlite3")
    dt=sqlite.query("select value,text from data")
    points=[]
    for row in dt:
        points.append((row[1],row[0]))
    return points
SQLITE封装类:
import sqlite3

class SQLITE(object):
    def __new__(cls, *args, **kwargs):
        if not hasattr(cls, "_instance"):
            cls._instance = super(SQLITE, cls).__new__(cls)
        return cls._instance

    def __init__(self, db_name):
        self.db_name = db_name
        self.connect = sqlite3.connect(self.db_name,check_same_thread=False)
        self.cursor = self.connect.cursor()

    def __enter__(self):
        return self

    def __exit__(self, exc_type, exc_val, exc_tb):
        self.connect.close()

    def execute_sql(self, sql):
        try:
            self.cursor.execute(sql)
            self.connect.commit()
        except Exception as e:
            self.connect.rollback()
    def query(self, sql):
        try:
            self.cursor.execute(sql)
            return self.cursor.fetchall()
        except Exception as e:
            return False
    def executemany_sql(self, sql, data_list):
        try:
            self.cursor.executemany(sql, data_list)
            self.connect.commit()
        except Exception as e:
            self.connect.rollback()
            raise Exception("executemany failed")

# db=SQLITE("../db.sqlite3")
# import random
# db.cursor.execute("drop table if exists data")
# db.cursor.execute("""create table data (
#     id INTEGER PRIMARY KEY AUTOINCREMENT,
#     value REAL,
#     text TEXT,
#     date TEXT DEFAULT (datetime('now','localtime'))
#     )""")
# data=[]
# for i in range(100):
#     data.append((random.randint(1,100),"date %d" % i))
# db.cursor.executemany("INSERT INTO data (value,text) VALUES (?,?)",data)
# dt=db.query("select value,text from data")
# db.connect.commit()
# print(dt)
# db.cursor.execute("drop table if exists COMPANY")
# db.cursor.execute("create table data (id INTEGER PRIMARY KEY AUTOINCREMENT, text TEXT, date TEXT)")
# db.cursor.execute("insert into data(text,date) values ('test','2022-02-10')")
# db.cursor.execute("insert into data(text,date) values ('marvelhonor','2022-02-10')")
# db.cursor.execute("""CREATE TABLE COMPANY(
#    ID INTEGER PRIMARY KEY   AUTOINCREMENT,
#    NAME           TEXT      NOT NULL,
#    AGE            INTEGER       NOT NULL,
#    ADDRESS        TEXT,
#    SALARY         REAL,
#    DATETIME       TEXT DEFAULT (datetime('now','localtime'))
# )""")
# db.cursor.executemany("INSERT INTO COMPANY (NAME,AGE,ADDRESS,SALARY) VALUES (?,?,?,?)",
#               [('Paul', 32, 'California', 20000.00),('Allen', 25, 'Texas', 15000.00),
#                ('Teddy', 23, 'Norway', 20000.00),('Mark', 25, 'Rich-Mond ', 65000.00)])
# dt=db.query("select * from COMPANY")
# for row in dt:
#     print(row)
# print()
# db.execute_sql("select * from data")
# dt=db.cursor.fetchall()
# for row in dt:
#     print(row)
模板line.html
<!DOCTYPE html>
<html lang="en">
<head>
    <meta charset="UTF-8">
    <title>CanvasJs Line</title>
    <script src="/static/canvasjs-3.6.4/canvasjs.min.js"></script>
    <script src="/static/jquery/jquery.min.js"></script>
</head>
<body>
<div id="chartContainer" style="height: 500px; max-width: 920px; margin: 0px auto;"></div>
<script>
$(document).ready(function(){
    $.get('/api/line/',function(d,s){
        if(s=="success"){
            var chart = new CanvasJS.Chart("chartContainer", d);
            chart.render();
        }
    });
});
function toggleDataSeries(e) {
	if(typeof(e.dataSeries.visible) === "undefined" || e.dataSeries.visible) {
		e.dataSeries.visible = false;
	}
	else {
		e.dataSeries.visible = true;
	}
	chart.render();
}
</script>
</body>
</html>
模板spline.html
<!DOCTYPE html>
<html lang="en">
<head>
    <meta charset="UTF-8">
    <title>CanvasJs Line</title>
    <script src="/static/canvasjs-3.6.4/canvasjs.min.js"></script>
    <script src="/static/jquery/jquery.min.js"></script>
</head>
<body>
<div id="chartContainer" style="height: 500px; max-width: 920px; margin: 0px auto;"></div>
<script>
$(document).ready(function(){
    $.get('/api/spline/',function(d,s){
        if(s=="success"){
            var chart = new CanvasJS.Chart("chartContainer", d);
            chart.render();
        }
    });
});
function toggleDataSeries(e) {
	if(typeof(e.dataSeries.visible) === "undefined" || e.dataSeries.visible) {
		e.dataSeries.visible = false;
	}
	else {
		e.dataSeries.visible = true;
	}
	chart.render();
}
</script>
</body>
</html>
启动

访问示例


自己部署,带动画哦。


 707
707


 被折叠的 条评论
为什么被折叠?
被折叠的 条评论
为什么被折叠?
 到【灌水乐园】发言


