


正文
材料准备
System: Linux x64
JDK: 1.7.0_67
Elasticsearch: 2.4.1
Logstash-2.4.0
Kibana: 4.6.1-linux-x86_64
Redis: 3.0.2
补充:
ELK下载地址:https://www.elastic.co/downloads
平台搭建
1.搭建客户端Logstash
(1)先在文件目录下解压包:tar -zxvf logstash-2.4.0.tar.gz
(2)编写配置文件
cd logstash-2.4.0
mkdir config
vi config/client.conf
配置文件的内容如下:
input {file {path => ["/xxx/access*.log"]start_position => "beginning"tags => ["haha"]}}output {redis {host => "10.168.242.92"port => 7380data_type => "list"key => "logstash:redis"}}
(3)启动
nohup ./bin/logstash -f config/client.conf &
2.搭建服务端Logstash
同1,
配置文件略有不同
input {redis {host => "192.168.52.102"port => "7380"data_type => "list"key => "logstash:redis"type => "redis-input"}}filter {#自定义数据字段grok {match => {"message" => ["%{DATA:dateTime}\|%{IP:clientIP}\|%{DATA:clientPort}\|%{IP:serverIP}\|%{DATA:serverPort}\|%{DATA:group}\|%{DATA:serviceName}\|%{DATA:version}\|%{DATA:methodName}\|%{DATA:methodParam}\|%{DATA:exception}\|%{NUMBER:executionTime}\|"]}}#date {# target => "runtime"# locale => "en"# match => ["dateTime","yyyy-MM-dd HH:mm:ss"]#}}output {if "wishdubbo" in [tags]{elasticsearch {hosts => ["115.231.103.57:9200"]index => "info"#采用自定义索引模板manage_template => false#模板名称template_name => "info"#elasticsearch 采用了自定义的索引模板,这里要指向模板文件template => "/data/project/chenkw/elasticsearch-2.4.1/config/templates/info.json"}}}
这里的模板文件,详见elasticsearch部分。
redis在此处仅用做缓冲队列,避免数据丢失,非必需。
补充相关参考文档:
logstash最佳实践:http://udn.yyuap.com/doc/logstash-best-practice-cn/output/elasticsearch.html
logstash grok dubber:https://grokdebug.herokuapp.com/
3.搭建Elasticsearch
(1)先在文件目录下解压包:tar -zxvf elasticsearch-2.4.1
(2)编写配置文件
vi elasticsearch-2.4.1/config/elasticsearch.yml
具体内容如下:
cluster.name : es_clusternode.name : node0path.data : /xxx/elasticsearch-2.4.1/datapath.logs : /xxx/elasticsearch-2.4.1/logsnetwork.host : 23.453.103.57network.port : 9200
(3)自定义索引模板
由于我们的日志,直接导入到elasticsearch的时候,诸如number、ip等类型,都会被默认模板定义为string。这会使得kibana不能对这些字段做数据统计。
引入自定义模板,可以解决这个问题。
模板如下,供参考:
{"order": 0,"template": "info*","settings": {"index": {"refresh_interval": "5s"}},"mappings": {"_default_": {"dynamic_templates": [{"message_field": {"mapping": {"index": "analyzed","omit_norms": true,"fielddata": {"format": "disabled"},"type": "string"},"match_mapping_type": "string","match": "message"}},{"string_fields": {"mapping": {"index": "analyzed","omit_norms": true,"fielddata": {"format": "disabled"},"type": "string","fields": {"raw": {"index": "not_analyzed","ignore_above": 256,"type": "string"}}},"match_mapping_type": "string","match": "*"}}],"properties": {"@timestamp": {"type": "date"},"geoip": {"dynamic": true,"properties": {"location": {"type": "geo_point"},"longitude": {"type": "float"},"latitude": {"type": "float"},"ip": {"type": "ip"}}},"@version": {"index": "not_analyzed","type": "string"},"dateTime": {"type": "string"},"clientIP": {"type": "ip"},"clientPort": {"type": "string","index": "not_analyzed"},"serverIP": {"type": "ip"},"serverPort": {"type": "string","index": "not_analyzed"},"message": {"type": "string"},"serviceName": {"type": "string","index": "not_analyzed"},"version": {"type": "string","index": "not_analyzed"},"methodName": {"type": "string","index": "not_analyzed"},"executionTime": {"type": "long"}},"_all": {"enabled": true,"omit_norms": true}}},"aliases": {}}
通过以下指令,把模板推送到elasticsearch
curl -XPUT http://123.21.103.517:9200/_template/template_info -d '@/xxx/elasticsearch-2.4.1/config/templates/info.json'
(4)启动
nohup ./bin/elasticsearch &
(5)注意点
A. 搭建elasticsearch时,修改elasticsearch.yml配置项时需要注意,每个配置项的key和value不能使用等于号(=),应使用英文冒号,且冒号前后要有空格!否则,启动会报错!
(6)补充
elasticsearch指南(中文版):http://es.xiaoleilu.com/
elasticsearch最佳实践:http://udn.yyuap.com/doc/logstash-best-practice-cn/output/elasticsearch.html
4.搭建Kibana
(1)先在文件目录下解压包:tar -zxvf kibana-4.6.1-linux-x86_64
(2)编写配置文件
vi kibana-4.6.1-linux-x86_64/config/kibana.yml
server.port : 5601server.host : 115.231.103.57elasticsearch.url : http://123.21.103.517:9200kibana.index : ".kibana"
(3)启动
nohup ./bin/kibana &
(4)注意点:
A. 在linux服务器上通过./kibana启动kibana后,发现用ps -ef|grep kibana 并不能找到进程,可以通过netstat -nap|grep 5601(端口号)来找到进程
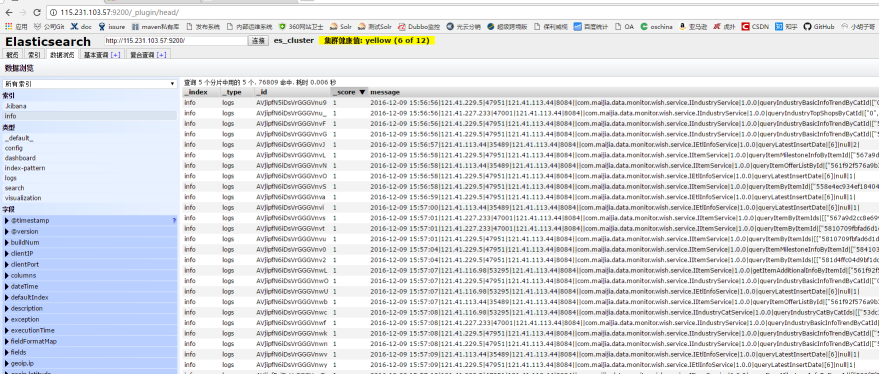
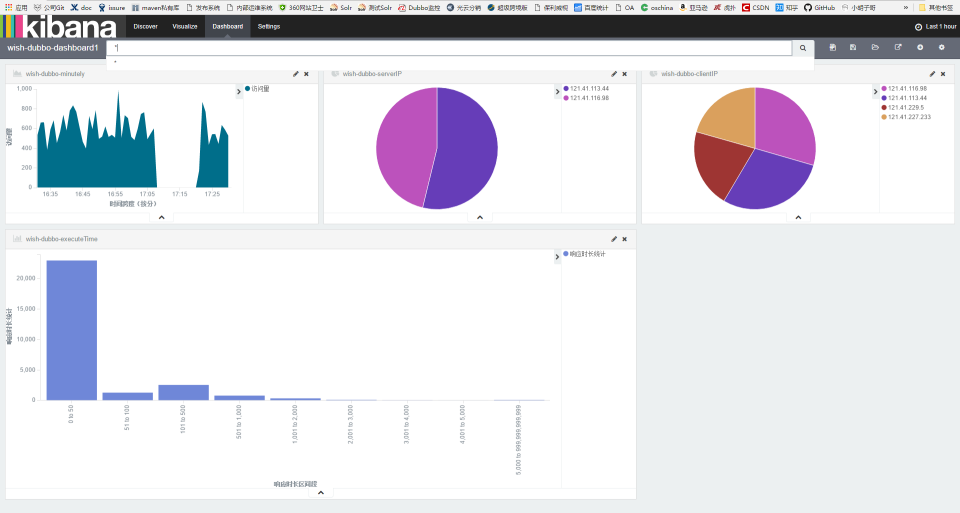
5. 效果
elasticsearch界面:http://123.21.103.517:9200/_plugin/head/
kibana界面:http://123.21.103.517:5601/
参考文章
http://www.tuicool.com/articles/YR7RRr
http://ju.outofmemory.cn/entry/270938
http://tshare365.com/archives/2344.html


 307
307

 被折叠的 条评论
为什么被折叠?
被折叠的 条评论
为什么被折叠?
 到【灌水乐园】发言


