


监控Nginx主要用到以下模块:
nginx-module-vts:Nginx virtual host traffic status module,Nginx的监控模块,能够提供JSON格式的数据产出。
nginx-vts-exporter:Simple server that scrapes Nginx vts stats and exports them via HTTP for Prometheus consumption。主要用于收集Nginx的监控数据,并给Prometheus提供监控接口,默认端口号9913。
一 nginx-module-vts模块编译
nginx_vts_exporter依赖nginx-module-vts模块,安装此模块无需任何其他依赖。模块与Nginx的版本兼容性如下:
1.11.x (last tested: 1.11.10)
1.10.x (last tested: 1.10.3)
1.8.x (last tested: 1.8.0)
1.6.x (last tested: 1.6.3)
1.4.x (last tested: 1.4.7)
1) 下载模块
cd /usr/local
git clone git://github.com/vozlt/nginx-module-vts.git
2)查看nginx已经安装模块
# /usr/local/nginx/sbin/nginx -V
nginx version: nginx/1.14.2
built by gcc 4.8.5 20150623 (Red Hat 4.8.5-36) (GCC)
built with OpenSSL 1.0.2k-fips  26 Jan 2017
TLS SNI support enabled
configure arguments: --prefix=/usr/local/nginx/ --with-http_stub_status_module --with-http_ssl_module --with-stream --with-ld-opt=-Wl,-rpath,/usr/local/nginx/lua/luajit/lib --add-module=/usr/local/ngx_devel_kit-0.3.0/ --add-module=/usr/local/lua-nginx-module-0.10.11/
3)重新编译添加–add-module=/root/mapr/nginx-module-vts
/usr/local/nginx-1.14.2
./configure --prefix=/usr/local/nginx/ --with-http_stub_status_module --with-http_ssl_module --with-stream --with-ld-opt="-Wl,-rpath,/usr/local/nginx/lua/luajit/lib" --add-module=/usr/local/ngx_devel_kit-0.3.0/ --add-module=/usr/local/lua-nginx-module-0.10.11/ --add-module=/usr/local/nginx-module-vts
make -j 2
注意:不要执行make install
4) 替换二进制文件
cp /usr/local/nginx/sbin/nginx /usr/local/nginx/sbin/nginx.20190726

cp /usr/local/nginx-1.14.2/objs/nginx /usr/local/nginx/sbin/nginx

# /usr/local/nginx/sbin/nginx -V
nginx version: nginx/1.14.2
built by gcc 4.8.5 20150623 (Red Hat 4.8.5-36) (GCC)
built with OpenSSL 1.0.2k-fips  26 Jan 2017
TLS SNI support enabled
configure arguments: --prefix=/usr/local/nginx/ --with-http_stub_status_module --with-http_ssl_module --with-stream --with-ld-opt=-Wl,-rpath,/usr/local/nginx/lua/luajit/lib --add-module=/usr/local/ngx_devel_kit-0.3.0/ --add-module=/usr/local/lua-nginx-module-0.10.11/ --add-module=/usr/local/nginx-module-vts

# /usr/local/nginx/sbin/nginx -t
nginx: the configuration file /usr/local/nginx//conf/nginx.conf syntax is ok
nginx: configuration file /usr/local/nginx//conf/nginx.conf test is successful
二 修改nginx 配置文件
添加 配置文件
vim /usr/local/nginx/conf/nginx.conf
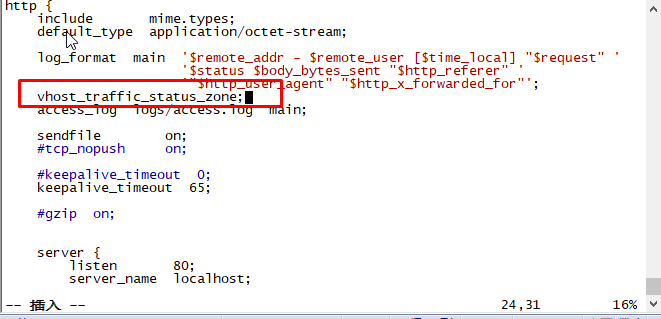
http 下添加
vhost_traffic_status_zone;
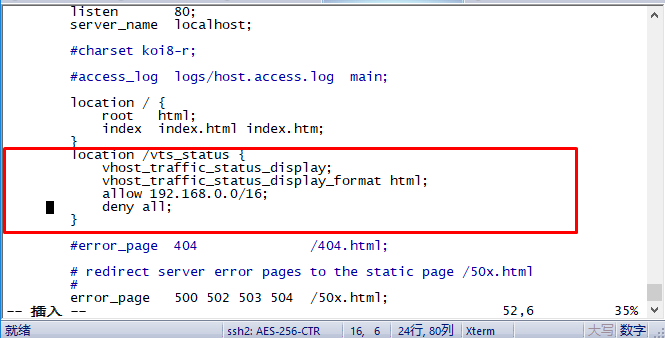
server下添加
location /vts_status {
vhost_traffic_status_display;
vhost_traffic_status_display_format html;
allow 192.168.0.0/16;
deny all;
}
allow 192.168.0.0/16; 这里最好使用127.0.0.1
# /usr/local/nginx/sbin/nginx -t
nginx: the configuration file /usr/local/nginx//conf/nginx.conf syntax is ok
nginx: configuration file /usr/local/nginx//conf/nginx.conf test is successful
# /usr/local/nginx/sbin/nginx -s stop
# /usr/local/nginx/sbin/nginx
配置建议:
1 打开vhost过滤:
vhost_traffic_status_filter_by_host on;
开启此功能,在Nginx配置有多个server_name的情况下,会根据不同的server_name进行流量的统计,否则默认会把流量全部计算到第一个server_name上。
2 在不想统计流量的server区域禁用vhost_traffic_status,配置示例:
server {
...
vhost_traffic_status off;
...
}
三 测试能否请求到数据
curl http://192.168.184.134/vts_status/format/json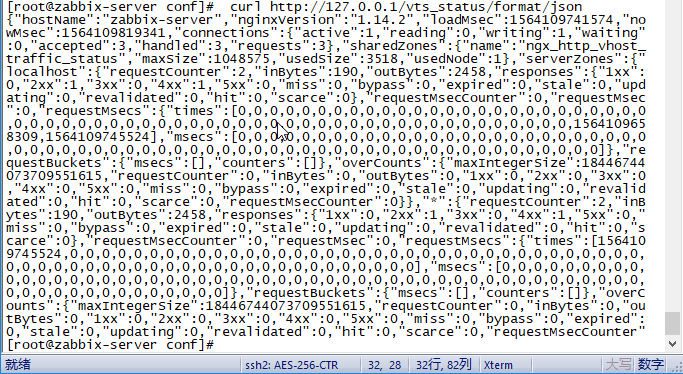
三 安装nginx-vts-exporter
1)下载nginx-vts-exporter
cd /usr/local
 wget https://github.com/hnlq715/nginx-vts-exporter/releases/download/v0.10.3/nginx-vts-exporter-0.10.3.linux-amd64.tar.gz

tar xf nginx-vts-exporter-0.10.3.linux-amd64.tar.gz
mv nginx-vts-exporter-0.10.3.linux-amd64 nginx-vts-exporter
2) 将nginx-vts-exporter 写成系统服务
 配置 nginx-vts-exporter.service

[Unit]
Description=nginx-vts-exporter
After=network.target

[Service]
Type=simple
ExecStart=/usr/local/nginx-vts-exporter/nginx-vts-exporter -nginx.scrape_uri=http://127.0.0.1/vts_status/format/json
Restart=on-failure

[Install]
WantedBy=multi-user.target

 启动服务,nginx-vts-exporter 默认监听端口为 9913
# systemctl enable nginx-vts-exporter
# systemctl start nginx-vts-exporter
# systemctl status nginx-vts-exporter
四 Prometheus添加节点
  {
    "targets": [
      "192.168.184.134:9913"
    ],
    "labels": {
      "hostname": "192.168.184.134_nginx"
    }
  }


systemctl start prometheus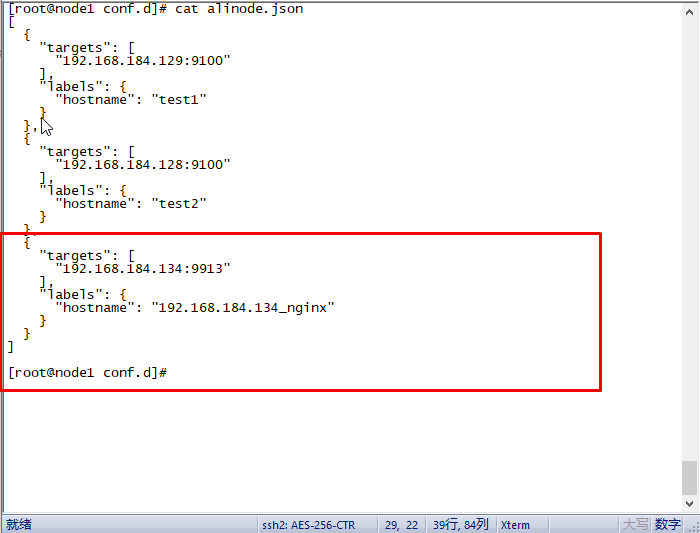
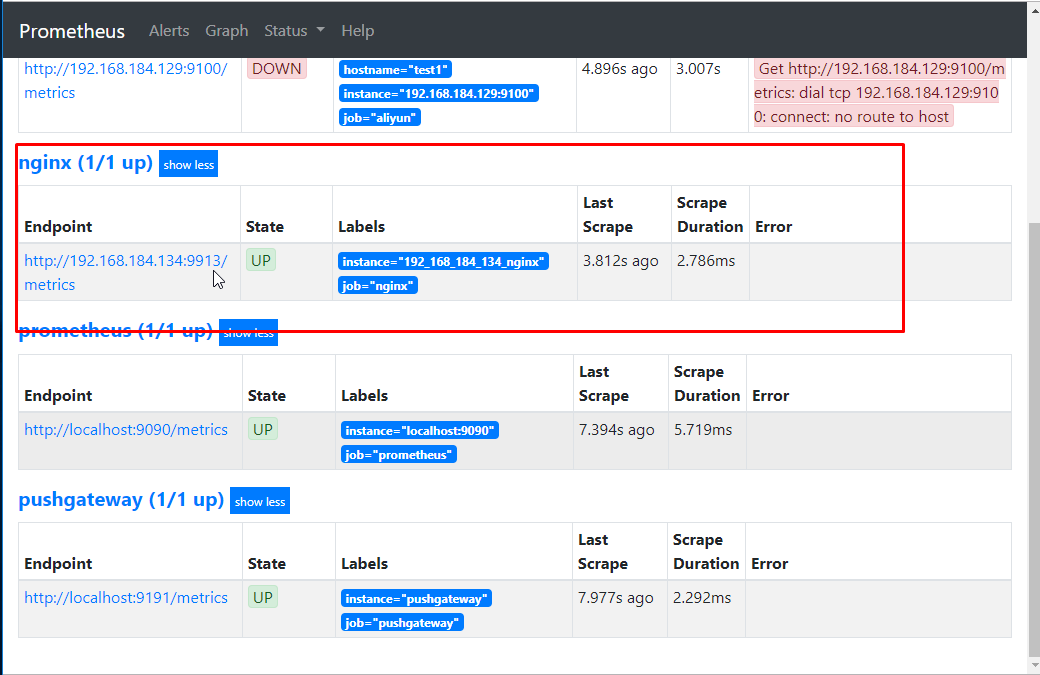
或者直接在prometheus.yml中添加
  - job_name: 'nginx'
    static_configs:
    - targets: ['192.168.184.134:9913']
      labels:
       instance: 192_168_184_134_nginx


systemctl start prometheus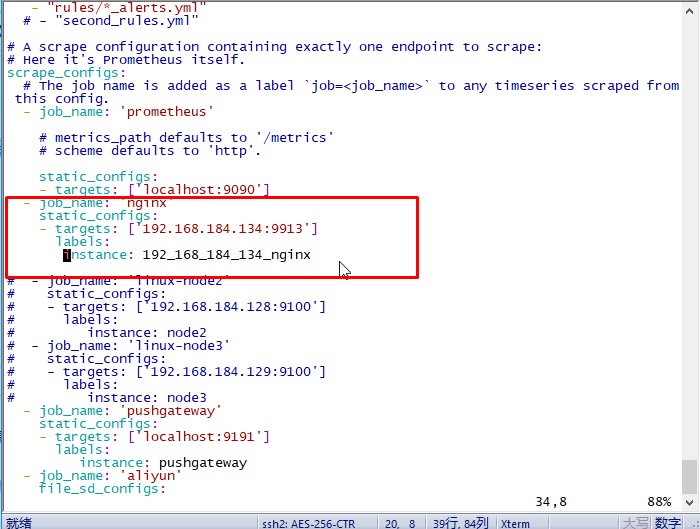
五 Grafana数据展示
推荐使用 模板 2949
https://grafana.com/grafana/dashboards/2949/revisions六 Nginx的监控数据类型
nginx-vts-exporter的数据类型命名空间默认以“nginx”开头,主要有如下9个
HELP是对监控条目的解释,TYPE的格式是:监控条目名称+Prometheus数据类型
# HELP nginx_server_bytes request/response bytes
# TYPE nginx_server_bytes counter
# HELP nginx_server_cache cache counter
# TYPE nginx_server_cache counter
# HELP nginx_server_connections nginx connections
# TYPE nginx_server_connections gauge
# HELP nginx_server_requestMsec average of request processing times in milliseconds
# TYPE nginx_server_requestMsec gauge
# HELP nginx_server_requests requests counter,可以区分状态码
# TYPE nginx_server_requests counter
# HELP nginx_upstream_bytes request/response bytes
# TYPE nginx_upstream_bytes counter
# HELP nginx_upstream_requestMsec average of request processing times in milliseconds
# TYPE nginx_upstream_requestMsec gauge
# HELP nginx_upstream_requests requests counter,可以区分状态码
# TYPE nginx_upstream_requests counter
# HELP nginx_upstream_responseMsec average of only upstream/backend response processing times in milliseconds
# TYPE nginx_upstream_responseMsec gauge
七 常用表达式
常用监控汇总表达式:
DomainName对应nginx conf里的server_name,这里可以根据不同的server_name和upstream分别进行qps、2xx/3xx/4xx/5xx的状态码监控,另外也可以监控nginx每台后端server的qps和后端接口响应时间。如果不需要区分server_name,可以把表达式里的$DomainName改为星号,“*****”代表所有;
1 求Nginx的QPS:
sum(irate(nginx_server_requests{code="total",host=~"$DomainName"}[5m]))
2 求4xx万分率(5xx类似,code=“5xx”):
(sum(irate(nginx_server_requests{code="4xx",host=~"$DomainName"}[5m])) / sum(irate(nginx_server_requests{code="total",host=~"$DomainName"}[5m]))) * 10000
3 求upstream的QPS(示例求group1的qps):
sum(irate(nginx_upstream_requests{code="total",upstream="group1"}[5m]))
4 求upstream后端server的响应时间(示例求group1的后端响应时间):
nginx_upstream_responseMsec{upstream=“group1”}


 1万+
1万+


 被折叠的 条评论
为什么被折叠?
被折叠的 条评论
为什么被折叠?
 到【灌水乐园】发言


