


想要更丰富效果的ECharts图例但是原生配置项legend不满足需求?使用HTML显示但又不能割舍鼠标在图例上的交互?莫急,我们完全可以像写HTML一样,但是仍然有鼠标移上去后的图表交互。
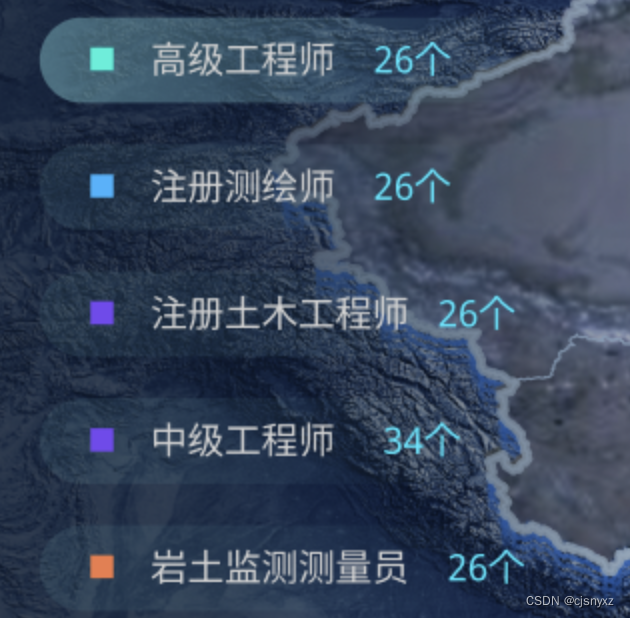
首先我们像平常写HTML一样渲染图例的数据,添加你希望展示的样式效果。然后在元素上监听鼠标的移入移出。
@mouseover="handleEnter(item, index)"
@mouseleave="handleLeave"
当鼠标进来,关键代码:chart.dispatchAction,注意:seriesIndex是你想要出现交互效果的饼状图,对应series数据。
const handleEnter = (data: any, index: number) => {
  // 遍历饼图数据,取消所有图形的高亮效果
  props.data.forEach((e, idx) => {
    chart.dispatchAction({
      type: 'downplay',
      seriesIndex: 5,
      dataIndex: idx,
    });
  });
  // 高亮当前图形
  chart.dispatchAction({
    type: 'highlight',
    seriesIndex: 5,
    dataIndex: index,
  });
  // 显示 tooltip
  chart.dispatchAction({
    type: 'showTip',
    seriesIndex: 5,
    dataIndex: index,
  });
};
当鼠标移开
const handleLeave = () => {
  // 遍历饼图数据,取消所有图形的高亮效果
  props.data.forEach((e, idx) => {
    chart.dispatchAction({
      type: 'downplay',
      seriesIndex: 5,
      dataIndex: idx,
    });
    // 取消显示 tooltip
    chart.dispatchAction({
      type: 'hideTip',
      seriesIndex: 5,
      dataIndex: idx,
    });
  });
};
至此完成我们的需求^-^


 1304
1304


 被折叠的 条评论
为什么被折叠?
被折叠的 条评论
为什么被折叠?
 到【灌水乐园】发言


