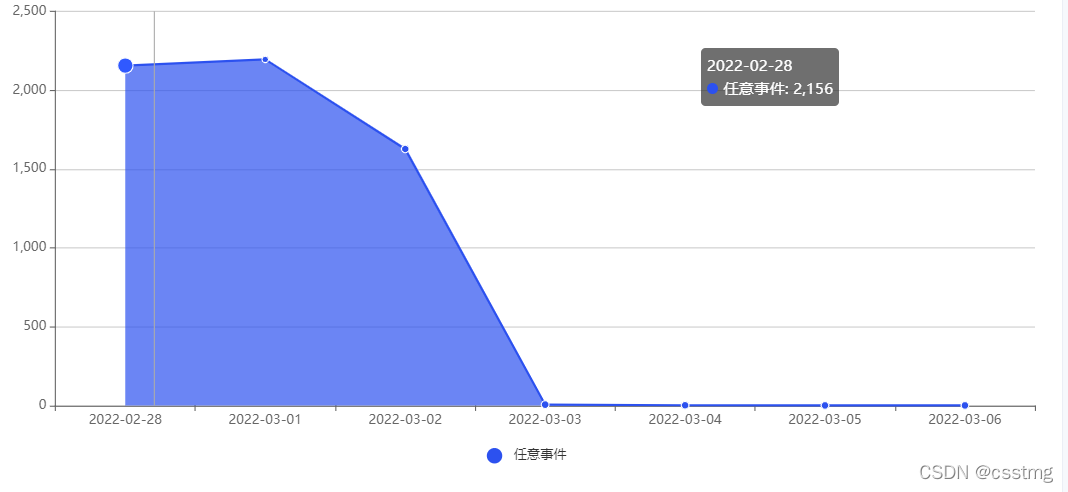
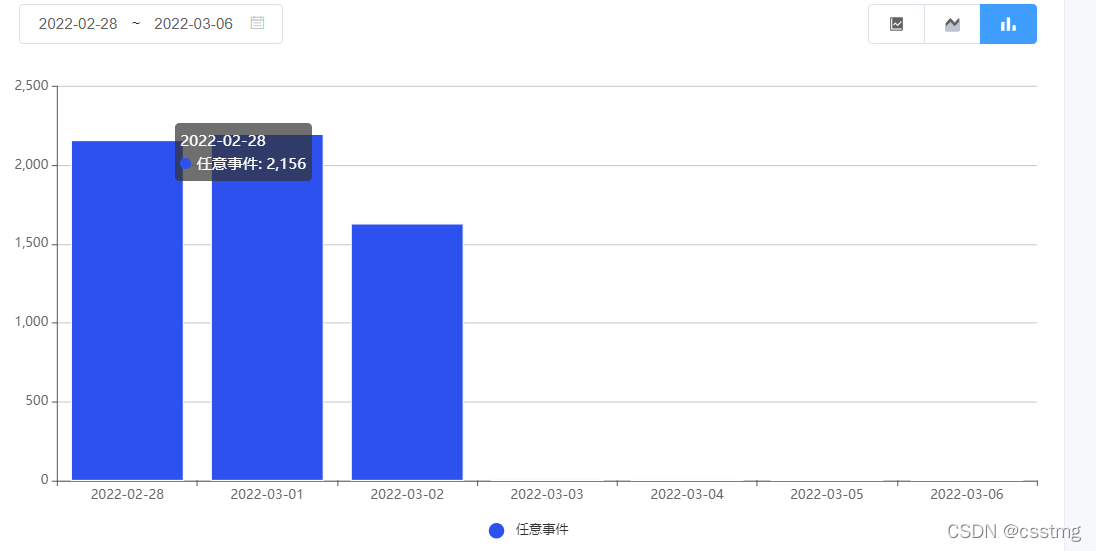
先上效果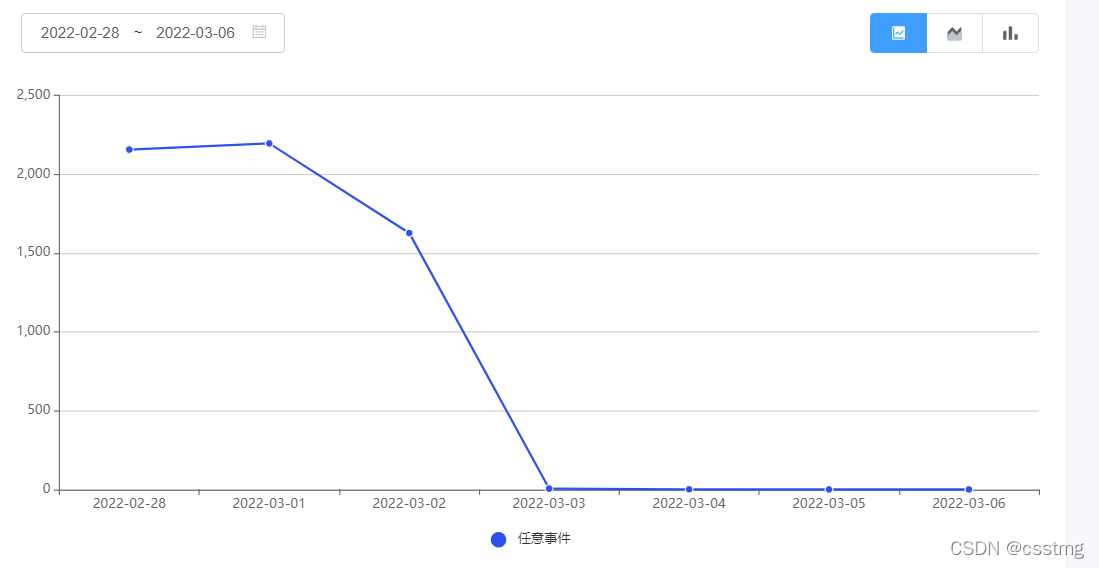
window.addEventListener('resize', () => {
setTimeout(() => {
this.myEchart && this.myEchart.resize()
}, 200)
})
<template>
<div class="analysisChart">
<div ref="myDiv" :style="{height}" class="com-rank" />
</div>
</template>
<script>
import * as echarts from 'echarts'
import { mapGetters } from 'vuex'
import { getColor } from '@/views/dataCenter/api/configEchartsColor'
export default {
name: 'analysisChart',
props: {
type: {
type: String
},
chartData: {
type: [Array, Object, String]
},
charType: {
type: Number,
default: 1
},
height: {
type: String,
default: () => '425px'
},
distributionType: {
type: String,
default: () => ''
}
},
data() {
return {
myEchart: '',
chooseColor: {}
}
},
computed: {
...mapGetters([
'sidebar'
]),
xData() {
let xAxes = []
if (this.type === 'event') {
xAxes = this.chartData[0].eventAnalysisLineVOS.map(item => item.eventTime)
} else if (this.type === 'retained') {
xAxes = this.chartData?.endEventVos.map(item => item.eventTime)
} else if (this.type === 'funnel') {
xAxes = this.chartData.map(item => item.eventTime)
} else if (this.type === 'distribute') {
if (this.charType === 1) {
xAxes = this.chartData.map(item => item.groupValue)
} else if (this.charType === 2) {
if (this.distributionType === 'dataKanban') {
xAxes = this.chartData.map(item => item.groupValue)
} else {
xAxes = this.chartData[0].list.map(item => item.eventTime)
}
}
} else if (this.type === 'dataKanban') {
xAxes = this.chartData.map(item => item.eventTime)
}
return xAxes
},
legendData() {
let legend = []
if (this.type === 'event') {
legend = this.chartData.map(item => {
if (item.eventAnalysisLineVOS[0]) {
return item.eventAnalysisLineVOS[0].name
}
})
}
return legend
},
seriesData() {
let series = []
if (this.type === 'event') {
series = this.chartData.map(item => {
let type = ''
if (this.charType === 1 || this.charType === 2) {
type = 'line'
} else {
type = 'bar'
}
return {
name: item.eventAnalysisLineVOS[0]?.name,
data: item.eventAnalysisLineVOS.map(item1 => item1.countNum),
type,
stack: this.charType === 2 ? 'Total' : '',
areaStyle: this.charType === 2 ? {} : null,
emphasis: this.charType === 2 ? { focus: 'series' } : ''
}
})
} else if (this.type === 'retained') {
series.push(
{
name: this.chartData?.eventTime,
data: this.chartData?.endEventVos.map(item => item.count),
type: 'line'
}
)
} else if (this.type === 'funnel') {
series.push(
{
name: '总转化率',
data: this.chartData.map(item => item.rate),
type: 'line'
}
)
} else if (this.type === 'distribute') {
if (this.charType === 1) {
series.push({
type: 'bar',
data: this.chartData.map(item => item.countNum),
name: '分布数'
})
} else if (this.charType === 2) {
series = this.chartData.map(item => {
return {
stack: 'Total',
areaStyle: {},
emphasis: {
focus: 'series'
},
type: 'line',
name: item.groupValue,
data: item.list.map(item1 => item1.countNum)
}
})
}
} else if (this.type === 'dataKanban') {
if (this.charType === 3) {
series.push({
type: 'bar',
data: this.chartData.map(item => item.countNum),
name: '任意事件'
})
} else if (this.charType === 2) {
series.push({
stack: 'Total',
areaStyle: {},
emphasis: {
focus: 'series'
},
type: 'line',
name: '任意事件',
data: this.chartData.map(item => item.countNum)
})
}
}
return series
}
},
watch: {
'sidebar.opened'() {
setTimeout(() => {
this.myEchart && this.myEchart.resize()
}, 200)
},
chartData: {
handler(newVal, oldVal) {
if (newVal.length === 0) {
return
}
this.createChart()
},
deep: true
}
},
created() {
this.chooseColor = getColor()
},
mounted() {
window.addEventListener('resize', () => {
setTimeout(() => {
this.myEchart && this.myEchart.resize()
}, 200)
})
this.createChart()
},
methods: {
createChart() {
this.myEchart = this.$echarts.init(this.$refs.myDiv)
this.myEchart.setOption(
{
color: ['#2C51EF', '#12C5D2', '#FC7F2B', '#FECE2B', '#F54E5A', '#4CBD11', '#B365FF'],
title: {
text: ''
},
tooltip: {
trigger: 'axis',
position: function (point, params, dom, rect, size) {
if ((size.viewSize[0] / 2) >= point[0]) {
return [point[0] + 50, '10%']
} else {
return [point[0] - 200, '10%']
}
}
},
legend: {
data: this.legendData,
bottom: '0',
left: 'center',
type: 'scroll',
icon: 'circle',
textStyle: {
color: this.chooseColor.titleColor
}
},
grid: {
left: '2%',
right: '25px',
bottom: '9%',
top: '2%',
containLabel: true
},
xAxis: {
type: 'category',
data: this.xData,
axisLine: {
lineStyle: {
color: this.chooseColor.textColor
}
}
},
yAxis: {
type: 'value',
axisLine: {
lineStyle: {
color: this.chooseColor.textColor
}
}
},
series: JSON.parse(JSON.stringify(this.seriesData)).map(item => {
if (this.type === 'dataKanban' || this.type === 'distribute') {
if (item.type === 'bar') {
return item
} else {
item.symbol = 'circle'
item.symbolSize = '7'
item.itemStyle = {
borderColor: 'rgba(255, 255, 255, 1)',
borderWidth: 1
}
}
} else {
item.symbol = 'circle'
item.symbolSize = '7'
item.itemStyle = {
borderColor: 'rgba(255, 255, 255, 1)',
borderWidth: 1
}
}
return item
})
}, true)
this.myEchart.off('click')
this.myEchart.on('click', (params) => {
})
}
}
}
</script>
<style lang="scss" scoped>
</style>


 295
295

 被折叠的 条评论
为什么被折叠?
被折叠的 条评论
为什么被折叠?
 到【灌水乐园】发言


