


 Chrome DevTools提供了一套强大的控制台功能,包括使用`console.log`格式化输出,清除控制台,计数元素,记录复杂对象,显示不同错误级别,保留导航期间的日志,分组消息,打印堆栈跟踪,计算执行时间以及生成CPU配置文件等。通过这些功能,开发者可以更好地理解和调试JavaScript代码,提高工作效率。
devtools 控制台
Every browser exposes a console that lets you interact with the Web Platform APIs and also gives you an inside look at the code by printing messages that are generated by your JavaScript code running in the page.
每种浏览器都提供一个控制台,该控制台使您可以与Web平台API进行交互,还可以通过打印由页面中运行的JavaScript代码生成的消息来使您深入了解代码。

控制台概述 (Overview of the console)
The console toolbar is simple. There’s a button to clear the console messages, something you can also do by clicking cmd-K in macOS, or ctrl-K on Windows, a second button that activates a filtering sidebar, that lets you filter by text, or by type of message, for example error, warning, info, log, or debug messages.
控制台工具栏很简单。 有一个按钮可以清除控制台消息,您也可以通过以下操作来完成此操作:单击macOS中的cmd-K或Windows中的ctrl-K ,第二个按钮可以激活过滤侧边栏,使您可以按文本或消息类型进行过滤,例如错误,警告,信息,日志或调试消息。
You can also choose to hide network-generated messages, and just focus on the JavaScript log messages.
您还可以选择隐藏网络生成的消息,而只关注JavaScript日志消息。

The console is not just a place where you can see messages, but also the best way to interact with JavaScript code, and many times the DOM. Or, just get information from the page.
控制台不仅是您可以查看消息的地方,还是与JavaScript代码(以及许多DOM)进行交互的最佳方式。 或者,仅从页面获取信息。
Let’s type our first message. Notice the >, let’s click there and type
让我们输入第一个消息。 注意>,让我们单击此处并键入
console.log('test')The console acts as a REPL, which means read–eval–print loop. In short, it interprets our JavaScript code and prints something.
控制台充当REPL ,这意味着读-评估-打印循环。 简而言之,它解释了我们JavaScript代码并输出了一些内容。
使用console.log格式 (Use console.log formatting)
As you see, console.log('test') prints ‘test’ in the Console.
如您所见, console.log('test')在控制台中输出'test'。
Using console.log in your JavaScript code can help you debug for example by printing static strings, but you can also pass it a variable, which can be a JavaScript native type (for example an integer) or an object.
在JavaScript代码中使用console.log可以例如通过打印静态字符串来帮助您进行调试,但是您也可以向其传递一个变量,该变量可以是JavaScript本机类型(例如整数)或对象。
You can pass multiple variables to console.log, for example:
您可以将多个变量传递给console.log ,例如:
console.log('test1', 'test2')We can also format pretty phrases by passing variables and a format specifier.
我们还可以通过传递变量和格式说明符来格式化漂亮的短语。
For example:
例如:
console.log('My %s has %d years', 'cat', 2)%sformat a variable as a string%s将变量格式化为字符串%dor%iformat a variable as an integer%d或%i将变量格式化为整数%fformat a variable as a floating point number%f将变量格式化为浮点数%ocan be used to print a DOM Element%o可用于打印DOM元素%Oused to print an object representation%O用于打印对象表示
Example:
例:
console.log('%o, %O', document.body, document.body)
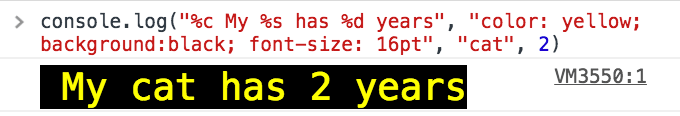
Another useful format specifier is %c, which allows to pass CSS to format a string. For example:
另一个有用的格式说明符是%c ,它允许传递CSS来格式化字符串。 例如:
console.log(
  '%c My %s has %d years',
  'color: yellow; background:black; font-size: 16pt',
  'cat',
  2
)
清除控制台 (Clear the console)
There are three ways to clear the console while working on it, with various input methods.
使用各种输入方法,有三种清除控制台的方法。
The first way is to click the Clear Console Log button on the console toolbar.
第一种方法是单击控制台工具栏上的“ 清除控制台日志”按钮。
The second method is to type console.clear() inside the console, or in your a JavaScript function that runs in your app / site.
第二种方法是在console.clear()内或在您的应用程序/站点中运行的JavaScript函数中键入console.clear() 。
You can also just type clear().
您也可以只键入clear() 。
The third way is through a keyboard shortcut, and it’s cmd-k (mac) or ctrl + l (Win)
第三种方法是通过键盘快捷键,它是cmd-k (mac)或ctrl + l (Win)
计数元素 (Counting elements)
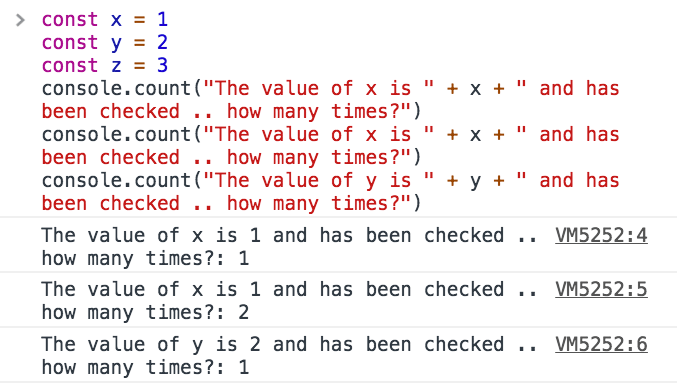
console.count() is a handy method.
console.count()是一种方便的方法。
Take this code:
采取以下代码:
const x = 1
const y = 2
const z = 3
console.count(
  'The value of x is ' + x + ' and has been checked .. how many times?'
)
console.count(
  'The value of x is ' + x + ' and has been checked .. how many times?'
)
console.count(
  'The value of y is ' + y + ' and has been checked .. how many times?'
)
What happens is that count will count the number of times a string is printed, and print the count next to it:
发生的是该计数将对打印字符串的次数进行计数,并在其旁边打印计数:
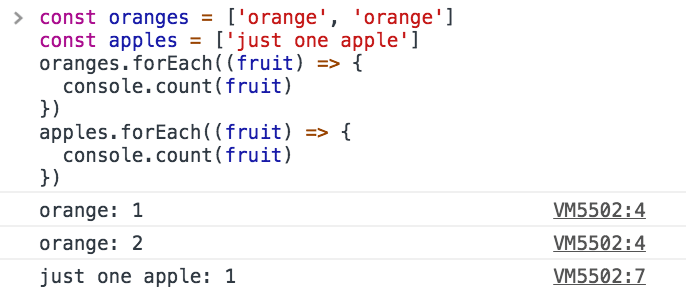
You can just count apples and oranges:
您可以只数苹果和橙子:
const oranges = ['orange', 'orange']
const apples = ['just one apple']
oranges.forEach(fruit => {
  console.count(fruit)
})
apples.forEach(fruit => {
  console.count(fruit)
})
记录更复杂的对象 (Log more complex objects)
console.log is pretty amazing to inspect variables. You can pass it an object too, and it will do its best to print it to you in a readable way. Most of the times this means it prints a string representation of the object.
console.log非常令人惊奇地检查变量。 您也可以向其传递一个对象,它会尽力以可读的方式将其打印给您。 大多数情况下,这意味着它会打印对象的字符串表示形式。
For example try
例如尝试
console.log([1, 2])Another option to print objects is to use console.dir:
打印对象的另一种方法是使用console.dir :
console.dir([1, 2])As you can see this method prints the variable in a JSON-like representation, so you can inspect all its properties.
如您所见,此方法以类似于JSON的表示形式打印变量,因此您可以检查其所有属性。
The same thing that console.dir outputs is achievable by doing
通过执行可实现console.dir输出的相同功能
console.log('%O', [1, 2])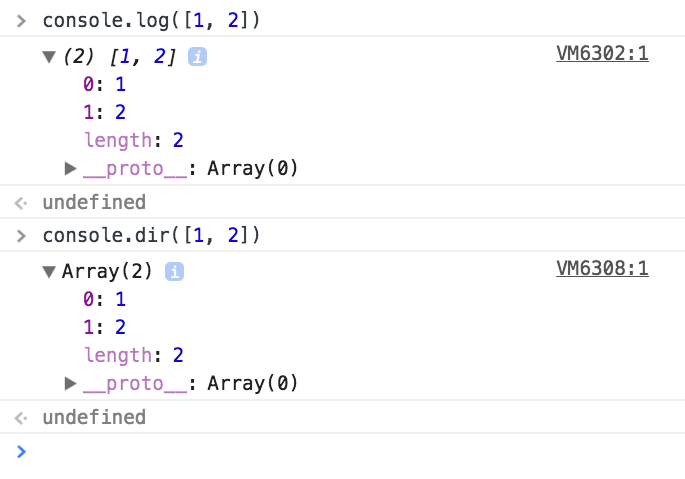
Which one to use depends on what you need to debug of course, and one of the two can do the best job for you.
当然,要使用哪一个取决于您需要调试的东西,并且两者之一可以为您做得最好。
Another function is console.table() which prints a nice table.
另一个函数是console.table() ,它打印一个漂亮的表。
We just need to pass it an array of elements, and it will print each array item in a new row.
我们只需要向它传递一个元素数组,它将在新行中打印每个数组项。
For example
例如
console.table([[1, 2], ['x', 'y']])or you can also set column names, by passing instead of an array, an Object Literal, so it will use the object property as the column name
或者您也可以通过传递而不是数组的Object Literal来设置列名,这样它将使用object属性作为列名
console.table([
  { x: 1, y: 2, z: 3 },
  { x: 'First column', y: 'Second column', z: null }
])
console.table can also be more powerful and if you pass it an object literal that in turn contains an object, and you pass an array with the column names, it will print a table with the row indexes taken from the object literal. For example:
console.table也可以更强大,如果向它传递一个对象常量,而该对象常量又包含一个对象,并且传递一个带有列名的数组,它将打印一个带有从对象常量获取的行索引的表。 例如:
const shoppingCart = {}
shoppingCart.firstItem = { color: 'black', size: 'L' }
shoppingCart.secondItem = { color: 'red', size: 'L' }
shoppingCart.thirdItem = { color: 'white', size: 'M' }
console.table(shoppingCart, ['color', 'size'])
记录不同的错误级别 (Logging different error levels)
As we saw console.log is great for printing messages in the Console.
如我们所见,console.log非常适合在控制台中打印消息。
We’ll now discover three more handy methods that will help us debug, because they implicitly indicate various levels of error.
现在,我们将发现另外三个方便的方法,这些方法将帮助我们进行调试,因为它们隐式指示各种级别的错误。
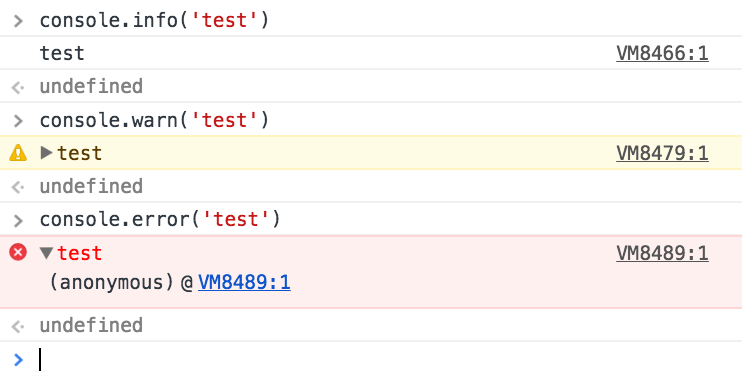
First, console.info()
首先, console.info()
As you can see a little ‘i’ is printed beside it, making it clear the log message is just an information.
如您所见,在其旁边印有一个小“ i”,表明日志消息只是一个信息。
Second, console.warn()
二, console.warn()
prints a yellow exclamation point.
打印一个黄色的感叹号。
If you activate the Console filtering toolbar, you can see that the Console allows you to filter messages based on the type, so it’s really convenient to differentiate messages because for example if we now click ‘Warnings’, all the printed messages that are not warnings will be hidden.
如果您激活控制台过滤工具栏,您会看到控制台允许您根据类型过滤消息,因此区分消息确实非常方便,因为例如,如果我们现在单击“警告”,则所有打印的非警告消息将被隐藏。
The third function is console.error()
第三个功能是console.error()
this is a bit different than the others because in addition to printing a red X which clearly states there’s an error, we have the full stack trace of the function that generated the error, so we can go and try to fix it.
这与其他方法有点不同,因为除了打印红色的X明确指出存在错误外,我们还对产生错误的函数进行了完整的堆栈跟踪,因此我们可以尝试对其进行修复。
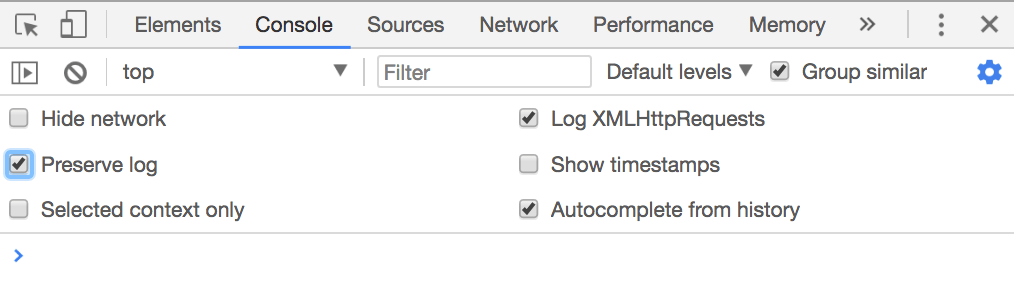
导航期间保留日志 (Preserve logs during navigation)
Console messages are cleared on every page navigation, unless you check the Preserve log in the console settings:
除非您在控制台设置中选中“ 保留日志” ,否则每次页面导航都会清除控制台消息:
分组控制台消息 (Grouping console messages)
The Console messages can grow in size and the noise when you’re trying to debug an error can be overwhelming.
控制台消息的大小可能会增加,并且在尝试调试错误时可能会产生巨大的噪音。
To limit this problem the Console API offers a handy feature: Grouping the Console messages.
为了限制此问题,控制台API提供了一个方便的功能:对控制台消息进行分组。
Let’s do an example first.
让我们先做一个例子。
console.group('Testing the location')
console.log('Location hash', location.hash)
console.log('Location hostname', location.hostname)
console.log('Location protocol', location.protocol)
console.groupEnd()
As you can see the Console creates a group, and there we have the Log messages.
如您所见,控制台创建了一个组,并且我们有Log消息。
You can do the same, but output a collapsed message that you can open on demand, to further limit the noise:
您可以执行相同的操作,但是输出折叠的消息,可以按需打开该消息,以进一步限制噪声:
console.groupCollapsed('Testing the location')
console.log('Location hash', location.hash)
console.log('Location hostname', location.hostname)
console.log('Location protocol', location.protocol)
console.groupEnd()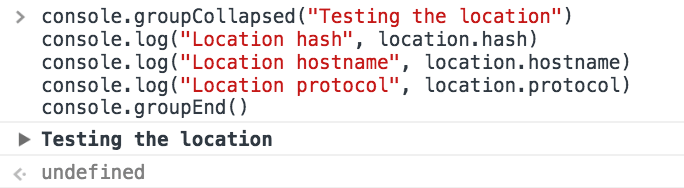
The nice thing is that those groups can be nested, so you can end up doing
令人高兴的是,这些组可以嵌套,因此您最终可以
console.group('Main')
console.log('Test')
console.group('1')
console.log('1 text')
console.group('1a')
console.log('1a text')
console.groupEnd()
console.groupCollapsed('1b')
console.log('1b text')
console.groupEnd()
console.groupEnd()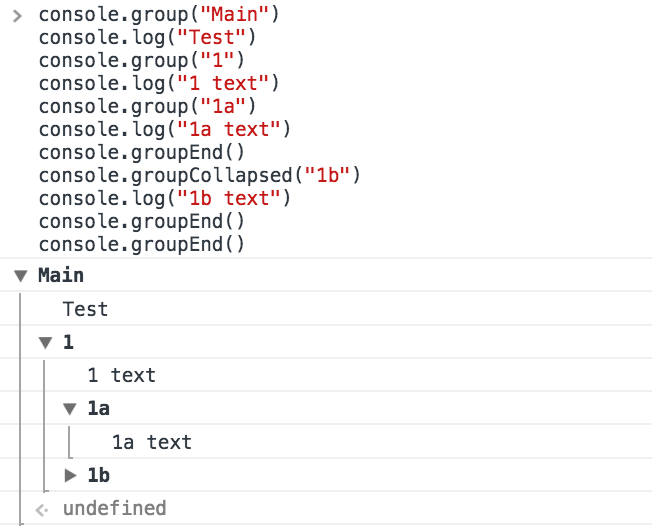
打印堆栈跟踪 (Print the stack trace)
There might be cases where it’s useful to print the call stack trace of a function, maybe to answer the question how did you reach that part of code?
在某些情况下,打印函数的调用堆栈跟踪很有用,也许可以回答以下问题: 如何到达代码的那一部分?
You can do so using console.trace():
您可以使用console.trace()这样做:
const function2 = () => console.trace()
const function1 = () => function2()
function1()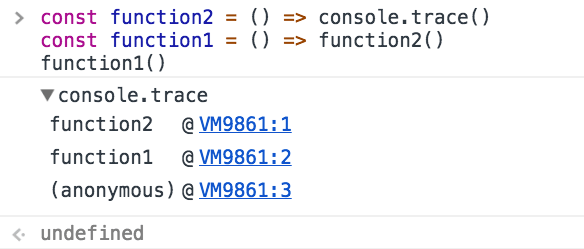
计算花费的时间 (Calculate the time spent)
You can easily calculate how much time a function takes to run, using time() and timeEnd()
您可以使用time()和timeEnd()轻松计算函数运行所需的time()
const doSomething = () => console.log('test')
const measureDoingSomething = () => {
  console.time('doSomething()')
  //do something, and measure the time it takes
  doSomething()
  console.timeEnd('doSomething()')
}
measureDoingSomething()
生成CPU配置文件 (Generate a CPU profile)
The DevTools allow you to analyze the CPU profile performance of any function.
DevTools允许您分析任何功能的CPU配置文件性能。
You can start that manually, but the most accurate way to do so is to wrap what you want to monitor between the profile() and profileEnd() commands. They are similar to time() and timeEnd(), except they don’t just measure time, but create a more detailed report.
您可以手动启动,但最准确的方法是在profile()和profileEnd()命令之间包装要监视的内容。 它们类似于time()和timeEnd() ,除了它们不只是测量时间,还创建更详细的报告。
const doSomething = () => console.log('test')
const measureDoingSomething = () => {
  console.profile('doSomething()')
  //do something, and measure its performance
  doSomething()
  console.profileEnd()
}
measureDoingSomething()
devtools 控制台


 1089
1089

 被折叠的 条评论
为什么被折叠?
被折叠的 条评论
为什么被折叠?
 到【灌水乐园】发言


