By now, we’ve all learned to love Vagrant and the development flexibility it provides. No matter the platform, you can easily have a development environment up and running in no time that’s not only stable, but also identical in every regard to the environment your colleagues, mentors or mentees use. But as the applications we’re developing reside inside a virtual machine, they’re a bit tricky to debug with Xdebug which is, by default, tuned for localhost.
到现在为止,我们都学会了爱Vagrant及其提供的开发灵活性。 无论使用哪种平台,您都可以轻松地立即建立并运行一个开发环境,该环境不仅稳定,而且在同事,导师或受训者所使用的环境的各个方面都相同。 但是,由于我们正在开发的应用程序驻留在虚拟机中,因此使用Xdebug进行调试有点棘手,默认情况下,Xdebug已针对本地主机进行了调整。
Xdebug is a PHP extension which allows you to debug and profile your code, view detailed and readable stack traces when errors happen, and much more. For a detailed walkthrough, see Shameer’s post. If you’re completely unfamiliar with it, you would do well to first install it following the procedures below, and then refer to the post linked above for a breakdown of everything Xdebug can do for you and your apps.
Xdebug是一个PHP扩展,它允许您调试和分析代码,在发生错误时查看详细且可读的堆栈跟踪,等等。 有关详细的演练,请参见Shameer的文章 。 如果您完全不熟悉它,则最好按照以下步骤进行安装,然后参考上面的链接,详细了解Xdebug对您和您的应用程序可以做的一切。
In this tutorial, we’ll set up Xdebug with PHPStorm for Vagrant hosted PHP apps.
在本教程中,我们将为Vagrant托管PHP应用程序设置带有PHPStorm的Xdebug。
制备 (Preparation)
To prepare the environment, please install and boot Homestead.
要准备环境,请安装并启动Homestead 。
Once it’s booted, vagrant ssh into it, and install a sample Laravel app. You can do this by executing:
一旦启动,请无所事事的vagrant ssh进入其中,并安装示例Laravel应用程序。 您可以通过执行以下操作来执行此操作:
composer create-project laravel/laravel Laravel --prefer-distWhen you get the Laravel greeting screen, you’re good to go.
当您看到Laravel问候屏幕时,就很好了。
安装Xdebug (Installing Xdebug)
This step can be skipped. Homestead comes with Xdebug installed and enabled. You can see this by looking at phpinfo() after booting Homestead:
可以跳过此步骤。 Homestead随附安装并启用了Xdebug。 您可以在启动Homestead后通过查看phpinfo()来查看此信息:
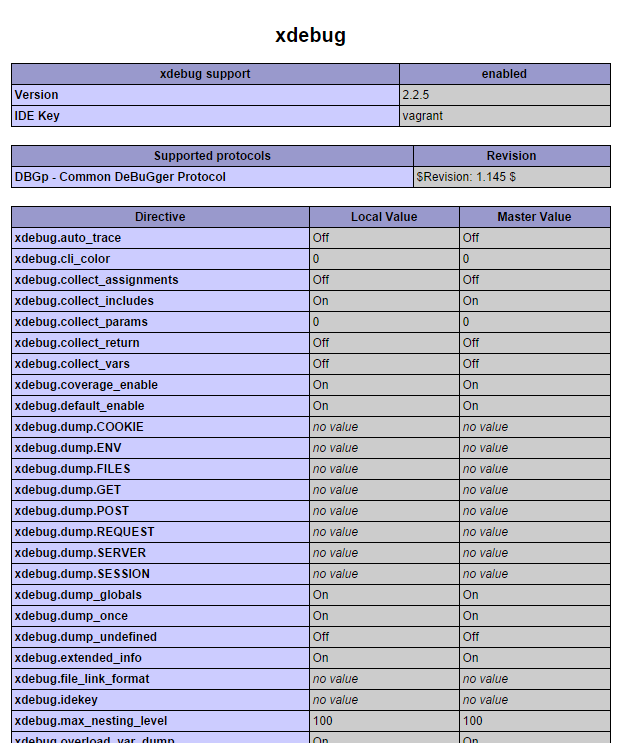
or by checking out the conf.d folders of PHP FPM and PHP CLI:
或通过检出PHP FPM和PHP CLI的conf.d文件夹:
ls /etc/php5/fpm/conf.d
ls /etc/php5/cli/conf.d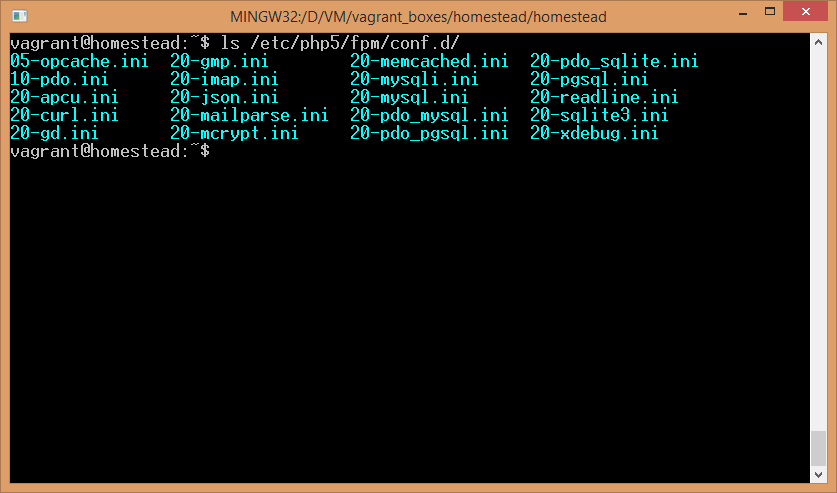
If you see xdebug.ini in there, it’s loaded. If you’re using any other Vagrant box instead and xdebug isn’t present, refer to Shameer’s post for installation instructions.
如果您在其中看到xdebug.ini ,则表示已加载。 如果您使用的是其他Vagrant框,而xdebug不存在,请参阅Shameer的帖子以获取安装说明。
配置xdebug.ini (Configuring xdebug.ini)
To allow Xdebug to be used remotely, we need to alter the ini file and give it some parameters that are off by default. Homestead’s default xdebug.ini file (found in /etc/php5/mods-available) originally only contains the directive that tells PHP to enable it, but nothing else:
为了允许Xdebug远程使用,我们需要更改ini文件并为其提供一些默认情况下处于禁用状态的参数。 Homestead的默认xdebug.ini文件(位于/etc/php5/mods-available )最初只包含告诉PHP启用它的指令,但没有其他内容:
zend_extension=xdebug.soUnder that line, add the following options:
在该行下,添加以下选项:
xdebug.remote_enable = on
xdebug.remote_connect_back = on
xdebug.idekey = "vagrant"
Close the file and restart php-fpm: sudo service php5-fpm restart. That’s all we need to configure on Xdebug’s end.
关闭文件并重新启动php-fpm: sudo service php5-fpm restart 。 这就是我们需要在Xdebug端进行配置的所有内容。
配置PHPStorm –服务器 (Configuring PHPStorm – Servers)
PHPStorm needs a bit of configuration, too. First, use it to open the directory of the Laravel app we created in step 1:
PHPStorm也需要一些配置。 首先,使用它打开我们在步骤1中创建的Laravel应用的目录:

Then, go to project settings and under PHP -> Servers add a new one. Give it port 8000, the name of your choice, and under host, put the name of your site’s virtual host (default: homestead.app). Then, use Path Mappings to map paths so that the location of your codebase on the host machine corresponds to the location on the VM. Do the same for the public subfolder. Basically, transplant the folders block from Homestead.yaml to this window. Follow my example:
然后,转到项目设置,然后在PHP->服务器下添加一个新的。 为它提供端口8000(您选择的名称),并在主机下放置您站点的虚拟主机的名称(默认值: homestead.app )。 然后,使用路径映射来映射路径,以使代码库在主机上的位置与VM上的位置相对应。 对public子文件夹执行相同的操作。 基本上,将folders块从Homestead.yaml移植到此窗口。 跟随我的例子:

配置PHPStorm –调试配置 (Configuring PHPStorm – Debug Configuration)
To run the debugger on an app, we need to create a debug environment. Go into Run -> Edit Configurations. In there, create a new configuration for “PHP Web Application”:
要在应用程序上运行调试器,我们需要创建一个调试环境。 进入Run -> Edit Configurations 。 在其中,为“ PHP Web应用程序”创建一个新配置:
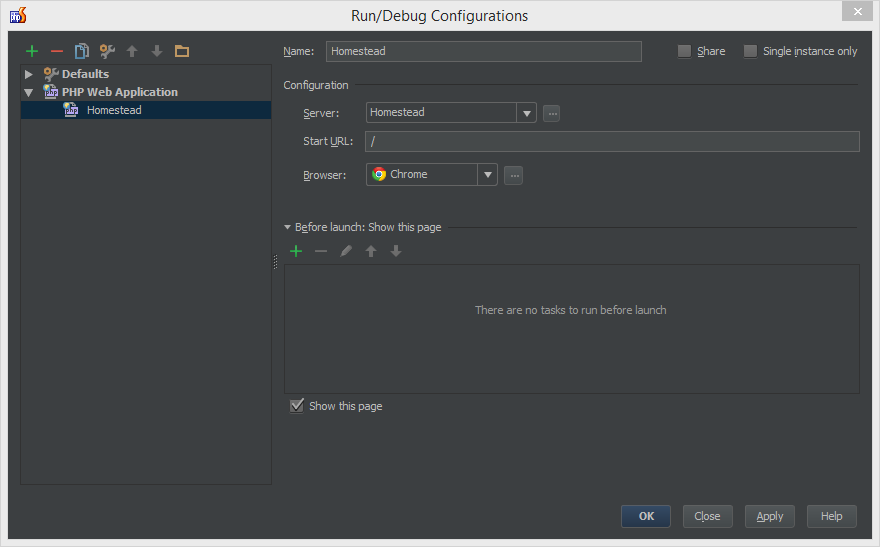
Apply the new settings and close the configuration.
应用新设置并关闭配置。
测试中 (Testing)
That’s all there is to setting it up. Let’s see if it works as expected.
这就是设置它的全部。 让我们看看它是否按预期工作。
In app/routes.php, alter the home route’s closure so that it looks like the code below:
在app/routes.php ,更改本地路线的关闭时间,使其类似于以下代码:
Route::get('/', function()
{
    $a = [1, 2, 3, 4, 5];

    array_pop($a);

	return View::make('hello');
});
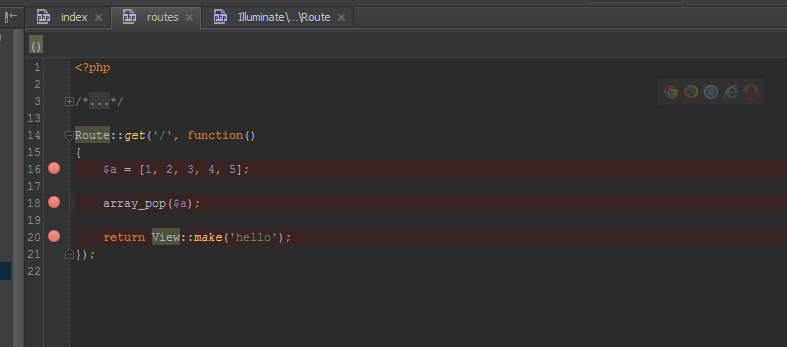
Then, put a breakpoint next to each line of the closure that does something, like so:
然后,在执行操作的闭合的每一行旁边放置一个断点,如下所示:
Let’s test these breakpoints. If you have the app open in your browser, close that tab now, otherwise PHPStorm won’t be able to re-run it. Then, go to Run -> Debug and run your predefined debug configuration. A new tab should launch and immediately return you to PHPStorm with an output similar to this one:
让我们测试这些断点。 如果您已在浏览器中打开该应用程序,请立即关闭该选项卡,否则PHPStorm将无法重新运行它。 然后,转到Run -> Debug并运行预定义的调试配置。 应该会启动一个新选项卡,并立即将您返回到PHPStorm,其输出类似于以下内容:
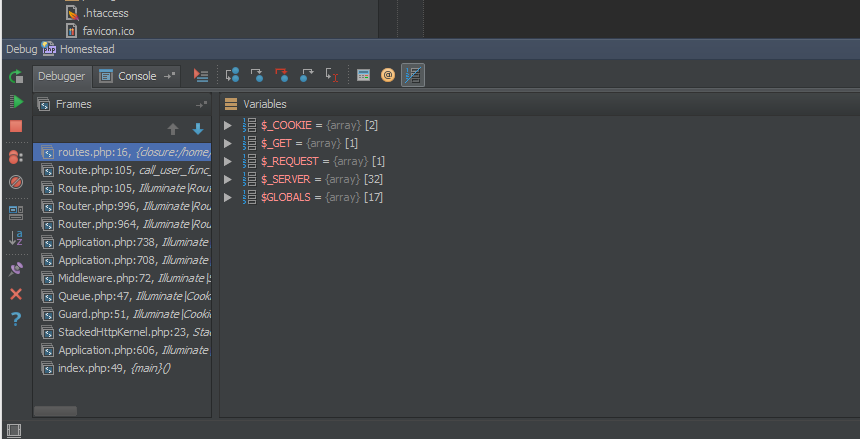
The left frame lists the stacktrace – the files the request already went through – and stops at routes.php, our file. You’ll notice in the right panel that only the superglobals are declared – no other variables are present at this time. Clicking the Resume button moves on to the next breakpoint and produces the following output:
左框架列出了stacktrace(请求已通过的文件),并停在我们的文件routes.php 。 您会在右侧面板中注意到,仅声明了超全局变量–当前没有其他变量。 单击“继续”按钮将移至下一个断点并产生以下输出:
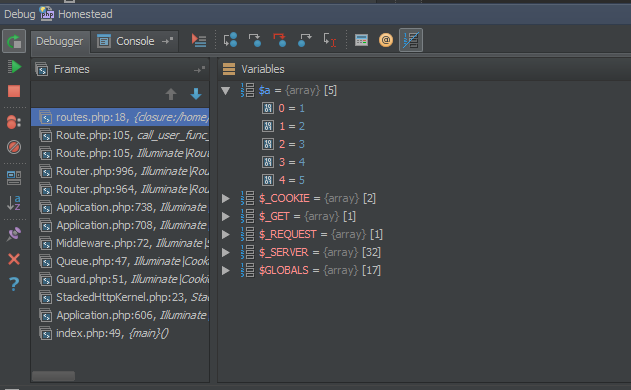
Notice our $a variable is there now. Also notice you can expand it to see what it contains. Clicking the Resume button once more produces a slightly different output:
注意我们的$a变量现在在那里。 还要注意,您可以展开它以查看其包含的内容。 再次单击“恢复”按钮将产生稍微不同的输出:
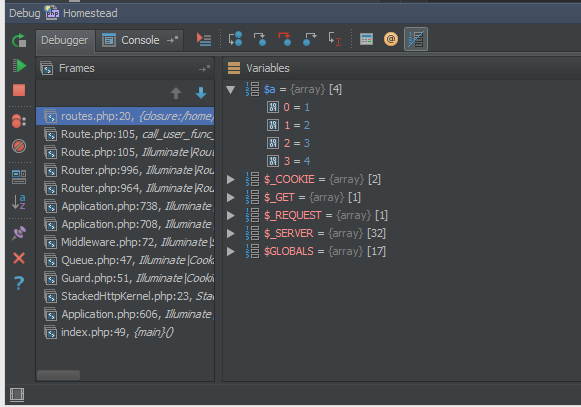
Our $a array has one less element due to the array_pop operation we performed. This proves our breakpoints work as intended, and Xdebug has been successfully set up.
由于执行了array_pop操作,我们的$a数组少$a一个元素。 这证明了我们的断点可以按预期工作,并且Xdebug已成功设置。
结论 (Conclusion)
Despite initial impressions, Xdebug is very easy to install for use via Vagrant when one knows what has to be done. These instructions are easily applicable to Xdebug’s integration into any other IDE as well, so feel free to adapt them as you see fit – only the PHPStorm sections likely need changing.
尽管有最初的印象,但当知道要做什么时,通过Vagrant可以很容易地安装Xdebug。 这些说明也很容易适用于Xdebug集成到任何其他IDE中,因此请随意调整它们-只有PHPStorm部分可能需要更改。
Do you debug through the VM layer? Are you using any other approaches? Have any problems we neglected to mention? Let us know!
您是否通过VM层进行调试? 您是否还在使用其他方法? 有什么我们忽略的问题吗? 让我们知道!
翻译自: https://www.sitepoint.com/install-xdebug-phpstorm-vagrant/


 131
131

 被折叠的 条评论
为什么被折叠?


