


This article was created in partnership with WRLD. Thank you for supporting the partners who make SitePoint possible.
本文是与WRLD合作创建的。 感谢您支持使SitePoint成为可能的合作伙伴。
We’re just about wrapping up our series on the WRLD platform. So far, we’ve looked at how to use WRLD with outside maps. In this tutorial, we’re going to design and use an indoor map (also known as a floorplan, if you’re going to be pedantic about it like a Dwight Schrute). As you might be able to tell, I think The Office would be a good theme for this one. Let us start off with a quote:
我们只是将我们的系列包装在WRLD平台上。 到目前为止,我们已经研究了如何将WRLD与外部地图一起使用。 在本教程中,我们将设计和使用室内地图(如果要像Dwight Schrute一样对它进行整修,也称为平面图)。 您可能会说,我认为办公室将是一个不错的主题。 让我们以报价开头:
Would I ever leave this company? Look, I’m all about loyalty. In fact, I feel like part of what I’m being paid for here is my loyalty. But if there were somewhere else that valued loyalty more highly… I’m going wherever they value loyalty the most. – Dwight K. Schrute
我会离开这家公司吗? 看,我全是忠诚。 实际上,我觉得自己在这里得到的报酬是我的忠诚度的一部分。 但是,如果还有其他地方对忠诚度有更高的评价……那么我将前往他们最重视忠诚度的地方。 –德怀特·K·施鲁特
In this tutorial, we’re going to cover the following topics:
在本教程中,我们将涵盖以下主题:
- Creating an indoor map 制作室内地图
- Importing the map into WRLD 将地图导入WRLD
- Highlighting specific rooms 突出显示特定房间
- Creating a schedule and looping through it 创建时间表并遍历时间表
The code for this tutorial has been tested with a modern version of Chrome.
本教程的代码已经过现代版本的Chrome的测试。
创建室内地图 (Creating Indoor Maps)
We’re going to try and re-create the office, from The Office. I think it’s going to be a bit of a fun challenge. We’ll start by installing some software. I’m on a Mac, so these are the instructions for how to do it on a Mac. Apparently, it’s a lot simpler on Windows…
我们将尝试从The Office重新创建办公室 。 我认为这将是一个有趣的挑战。 我们将从安装一些软件开始。 我在Mac上,因此这些是在Mac上操作方法的说明。 显然,在Windows上它要简单得多……
The first bit of software we need is called QGIS. You can download it directly from their site, but the Mac link goes off-site to a rather dodgy looking place. I’m a bit more trusting with software I can install through Homebrew, because I can see what it’s doing at each step of the way. If you are on a Mac, and you haven’t already got Homebrew, I suggest you install it. Once that’s done, you can start the QGIS installation via some Python packages:
我们需要的第一部分软件称为QGIS。 您可以直接从他们的网站下载该文件,但是Mac链接不在站点上,而是看上去很晦涩。 我对可以通过Homebrew安装的软件有更多的信任,因为我可以看到它在每个步骤中的作用。 如果您使用的是Mac,并且还没有Homebrew,建议您安装它。 完成后,您可以通过一些Python软件包开始QGIS安装:
brew install gdal
brew install python
When I tried installing
python, Homebrew told me I already had Python installed. However, thepipcommand was missing. I had to reinstallpython, usingbrew reinstall python; and then I had to re-link it, usingbrew unlink python && brew link python. After this, I had thepipcommand.当我尝试安装
python,Homebrew告诉我我已经安装了Python。 但是,缺少pip命令。 我不得不重新安装python,采用brew reinstall python; 然后我必须使用brew unlink python && brew link python重新链接它。 之后,我有了pip命令。
You can follow this up with:
您可以执行以下操作:
pip install matplotlib
pip install psycopg2
brew tap osgeo/osgeo4mac
brew install qgis2
All of this works, at the time of writing. That’s no guarantee that it’ll work by the time you read this. You may have to resort to the seemly official, yet utterly dodgy-looking QGIS download site I mentioned earlier.
在撰写本文时,所有这些都有效。 不能保证在您阅读本文时它会起作用。 您可能不得不求助于我之前提到的看似正式但看上去完全晦涩的QGIS下载站点。
I learned of this process from a tutorial, about installing QGIS through Homebrew.
我从有关通过Homebrew安装QGIS的教程中了解了此过程。
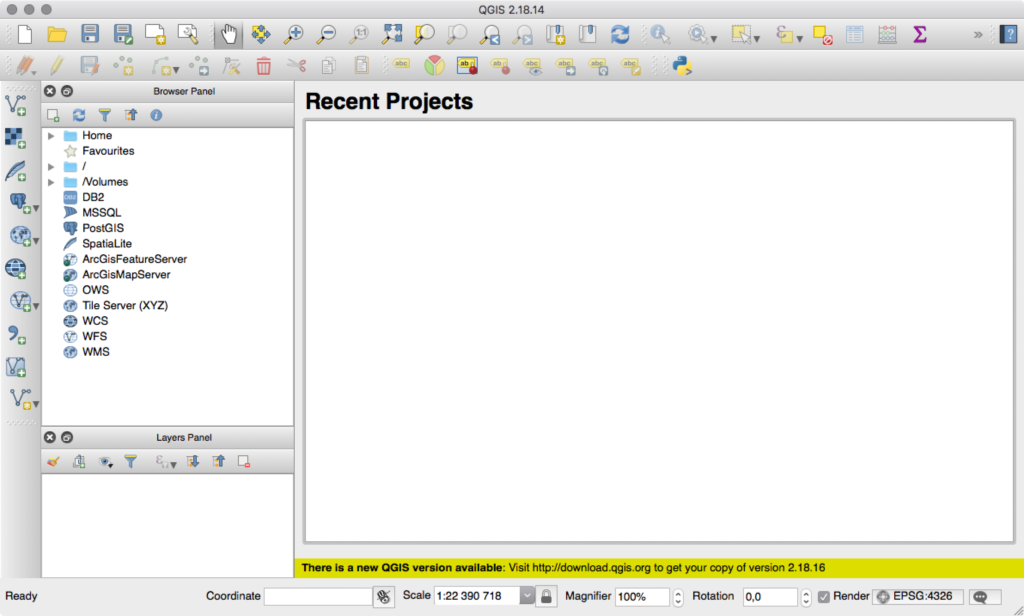
After all that, you should be able to run the qgis2 command…
毕竟,您应该能够运行qgis2命令…
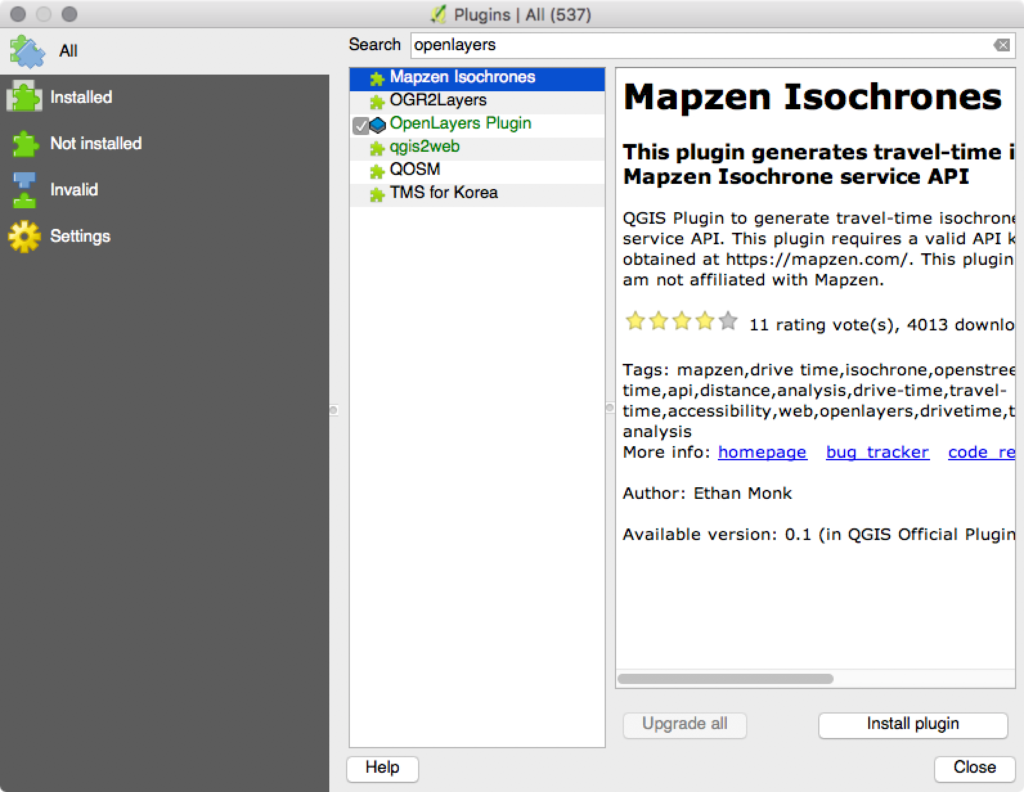
You will also need to install a few plugins. Go to Plugins → Manage and Install Plugins. Install the OpenLayers plugin and the Lat Lon Tools plugin.
您还需要安装一些插件。 转到插件→管理和安装插件。 安装OpenLayers插件和Lat Lon Tools插件。
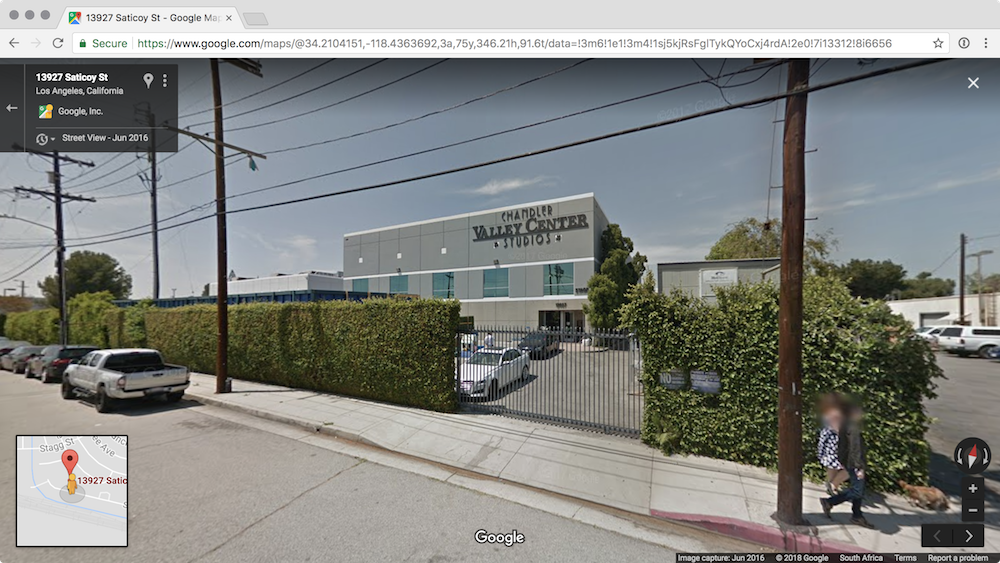
Next, we need to figure out where it is. In the show, it’s said that the office is located at 1725 Slough Avenue in Scranton, PA. The actual location of the building is really at 13927 Saticoy Street in Panorama City, CA.
接下来,我们需要弄清楚它在哪里。 在展览中,据说办公室位于宾夕法尼亚州斯克兰顿的Slough Avenue 1725号。 该建筑物的实际位置实际上是在加利福尼亚全景市的Saticoy街13927号。
The easiest way to confirm a map location (if you remember how the place looks) is to search for the address in something like Google Maps, which provides a street view mode. Just to prove that the Panorama City location is the right one, I searched for that address in street view, and got this:
确认地图位置的最简单方法(如果您还记得该地方的外观)是在类似于Google Maps(提供街景模式)的位置中搜索地址。 只是为了证明Panorama City的位置是正确的位置,我在街景视图中搜索了该地址,并得到了:
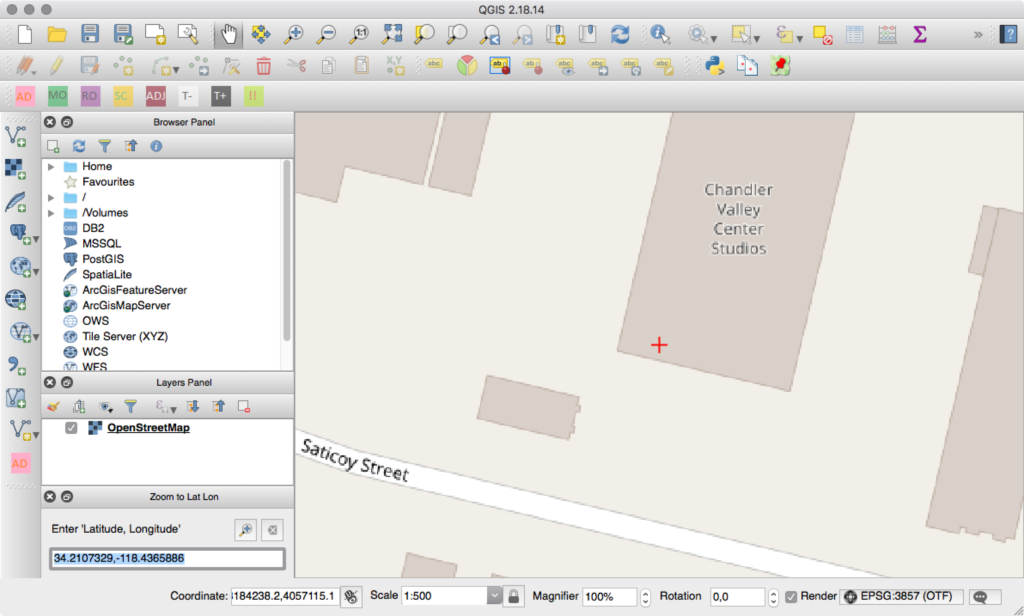
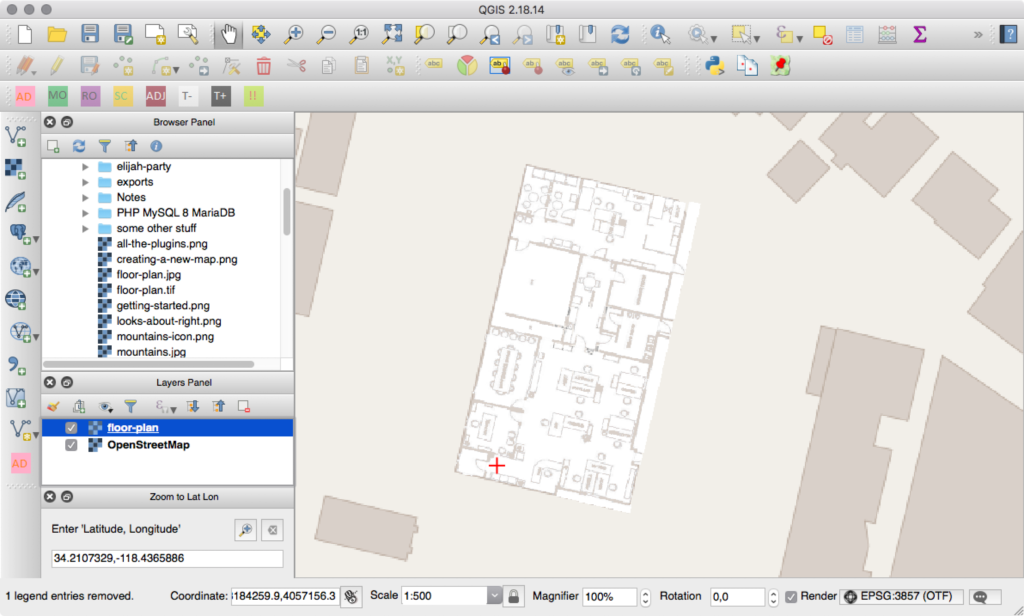
Now, it’s time to start creating the map. Add a new OpenStreetMap layer by going to Web → OpenLayers plugin → OpenStreetMap → OpenStreetMap. You should see a zoomed-out map of the world. Go to Plugins → Lat Lon Tools → Zoom To Latitude, Longitude and enter in the coordinates you want (in this case: 34.2107329,-118.4365886). You can change the scale to 1:500 for a closer look.
现在,该开始创建地图了。 转到Web→OpenLayers插件→OpenStreetMap→OpenStreetMap,添加一个新的OpenStreetMap图层。 您应该会看到一张缩小的世界地图。 转到插件→纬度工具→缩放到纬度,经度,然后输入所需的坐标(在这种情况下:34.2107329,-118.4365886)。 您可以将比例更改为1:500,以进行仔细查看。
Next, click Raster → Georeferencer → Georeferencer. That’ll pop up a new, empty window. Click File → Open Raster to select the floor plan. “What floor plan?”, you ask. The very same you can download by searching for “The Office floor plan”.
接下来,单击栅格→地理参考→地理参考。 这将弹出一个新的空窗口。 单击文件→打开栅格以选择平面图。 您问:“什么平面图?” 您可以通过搜索“办公室平面图”下载相同的内容。
I should mention that you’ll be asked what kind of Coordinate Reference System (CRS or SRS) you need. Select “WGS 84 / Pseudo Mercator”. I don’t really understand why, but it was the default and it seems to have worked well for me! The floor plan should then be displayed in the editor.
我应该提到,您会被问到您需要哪种坐标参考系统(CRS或SRS)。 选择“ WGS 84 /伪墨卡托”。 我真的不明白为什么,但这是默认设置,对我来说似乎效果很好! 然后应在编辑器中显示平面图。

We need to link the indoor map to the outdoor map. Click Add Point (in the Georeferencer window) and click on a perimeter point (like the corner of the building). Then click From map canvas and select the corresponding point from the outdoor map.
我们需要将室内地图链接到室外地图。 单击“添加点”(在“地理参考”窗口中),然后单击一个外围点(例如建筑物的拐角)。 然后单击“从地图画布”,然后从室外地图中选择相应的点。
Repeat this a few times. I know it’s probably technically not accurate to match the indoor map 1:1 with the outdoor building shape but that’s what I’ve done for now. Feel free to do the same. Try to be as accurate as possible.
重复几次。 我知道将室内地图1:1与室外建筑物的形状相匹配在技术上可能并不准确,但这就是我目前所做的。 随意做同样的事情。 尝试尽可能准确。
When you’re happy with the points you’ve mapped, click Settings → Transformation Settings and make the settings look similar to this:
当您对已映射的点感到满意时,请单击“设置”→“变换设置”,并使设置类似于以下内容:
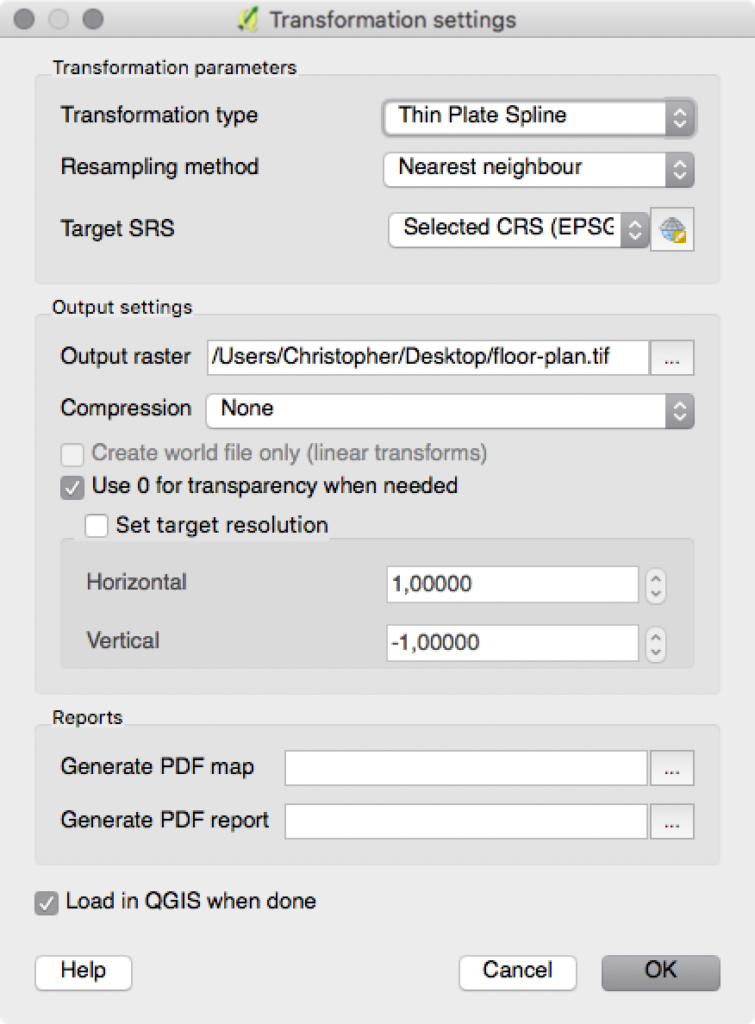
Most of that is default, but the Target SRS should be EPSG:3857. Click on. Then click the green play button (which is the Start Georeferencing button). This will take you back to the main QGIS window, except now the floor plan will overlay the outdoor map. You can right-click on the floor plan, in the layers panel, and click Properties. There, you can adjust the blend mode to something a little less jarring. I like the Lighten blend mode.
其中大多数是默认设置,但目标SRS应为EPSG:3857。 点击。 然后单击绿色的播放按钮(即开始地理配准按钮)。 除了现在平面图将覆盖室外地图之外,这将带您回到QGIS主窗口。 您可以在层面板中的平面图上单击鼠标右键,然后单击“属性”。 在这里,您可以将混合模式调整为略微震撼的模式。 我喜欢减光混合模式。
Now, we need to start drawing features on the floor plan. Click Layer → Create Layer → New Shapefile Layer. Set the Type to Polygon, pick the same SRS of EPSG:3857, and add type, name and highlight attributes to the attributes list. The defaults of “Text data” and “80” are fine for type and name attributes, but the highlight attribute needs to be set to integer. Values in the Length field don’t need to change. Click Ok and give the shape file a name.
现在,我们需要开始在平面图上绘制特征。 单击图层→创建图层→新建Shapefile图层。 将“类型”设置为“多边形”,选择与EPSG:3857相同的SRS,然后在属性列表中添加type , name和highlight属性。 类型和名称属性的默认值为“文本数据”和“ 80”,但高亮属性需要设置为整数。 长度字段中的值不需要更改。 单击确定,并为形状文件命名。
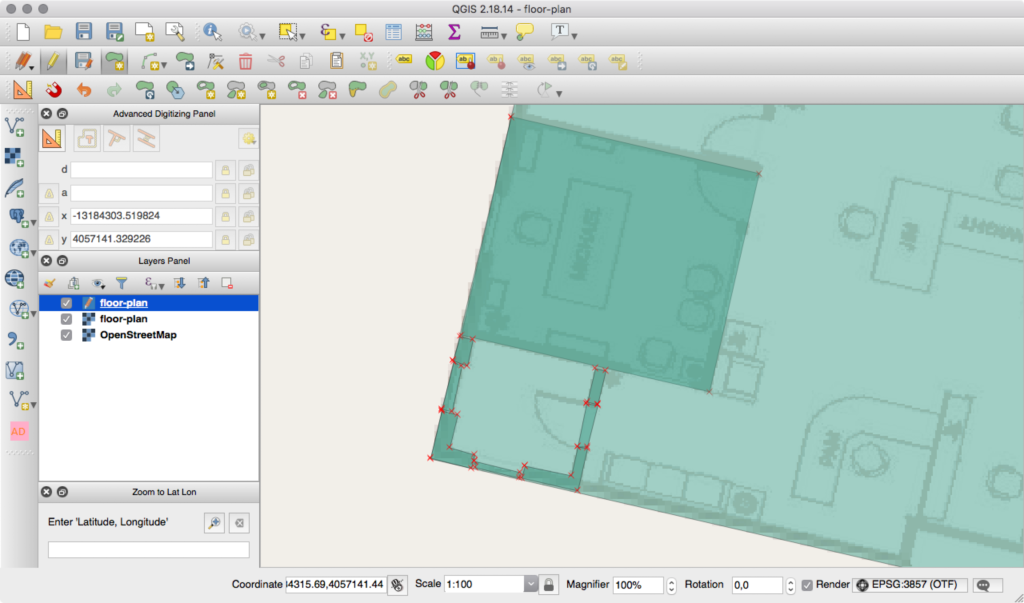
When you see it in the layer panel, double-click it and set the transparency to 50% so that you can still see the map underneath. The shapes layer needs to be the top layer, so drag it if it’s not there already. Next, click the Toggle Editing button (the pencil) and then click the Add Features button (which looks like a green blog with a yellow icon over it).
在“图层”面板中看到它时,请双击它并将透明度设置为50%,以便您仍然可以看到下面的地图。 Shapes层必须是顶层,因此如果尚不存在,请拖动它。 接下来,单击“切换编辑”按钮(铅笔),然后单击“添加功能”按钮(看起来像是绿色博客,上面带有黄色图标)。
Trace the boundary of the floor plan. When you’ve done that, right-click on the shape you’ve made and give it a type of building_outline. This is the boundary for how WRLD will render the indoor map. Click the Add Features button again, and begin to trace things like walls, windows, doors, and rooms. These shouldn’t overlap. When you’ve traced a segment, give it the corresponding type, like wall, window, door, or room. You can usually leave the “name” field empty, but if you specify a room name then WRLD will display it. If you plan on using any highlights, you can add a 1 to the room features in the highlight attribute.
跟踪平面图的边界。 完成此操作后,右键单击已制成的形状,并为其指定一种building_outline 。 这是WRLD渲染室内地图的边界。 再次单击“添加功能”按钮,并开始跟踪墙壁,窗户,门和房间等内容。 这些不应重叠。 跟踪分段后,请为其指定相应的类型,例如wall , window , door或room 。 您通常可以将“名称”字段留空,但是如果您指定房间名称,则WRLD将显示它。 如果计划使用任何高光,则可以在高highlight属性中为room功能添加1 。
It’s a little less chaotic if you draw rooms instead of the walls, windows, and doors that make them up. There’s a full list of elements you can trace (and their types) here. Keep tracing features until you’ve got as much detail as you need.
如果您绘制房间而不是墙壁,窗户和门来构成房间,那么混乱会少一些。 您可以在此处跟踪元素的完整列表(及其类型)。 不断跟踪功能,直到获得所需的详细信息为止。
Before we can import the map into WRLD, we need to make sure the feature IDs are unique. If you’ve been giving unique IDs then you’re all set. Otherwise, open the list of features by clicking Layer → Open Attribute Table and give each feature an ID. The order doesn’t matter.
在将地图导入WRLD之前,我们需要确保要素ID是唯一的。 如果您一直在提供唯一的ID,那么一切都准备就绪。 否则,通过单击图层→打开属性表来打开要素列表,并为每个要素指定一个ID。 顺序无关紧要。
Right-click on the shapefile layer and click Save As. To upload your building, you now need to update the CRS to EPSG: 4326 and export it as a geojson file, rather than a shapefile. Converting to 4326 changes the format from Pseudo-Mercator to Mercator which means that the points of your constructed floorplan are now being stored in latitude and longitude – which WRLD Indoor Map Designer uses to place your map correctly in the world when converting it into a 3D model. Save the file somewhere, and open your text editor to the same folder you saved the shape layer file into. Create a new JSON file, called main.json:
右键单击shapefile图层,然后单击另存为。 要上传建筑物,您现在需要将CRS更新为EPSG:4326,并将其导出为geojson文件而不是shapefile。 转换为4326会将格式从Pseudo-Mercator更改为Mercator,这意味着现在已存储的平面图的点以经度和纬度存储-WRLD室内地图设计器在将其转换为3D时将其正确放置在世界上模型。 将文件保存在某个位置,然后将文本编辑器打开到保存形状图层文件的文件夹。 创建一个新的JSON文件,称为main.json :
{
    "id": "the-office",
    "name": "The Office",
    "owner": "Dunder Mifflin",
    "location": {
        "type": "Point",
        "coordinates": [-118.4365886, 34.2107329]
    },
    "levels": [
        {
            "id": "the-office-1",
            "name": "1",
            "readable_name": "First floor",
            "z_order": 0,
            "filename": "floor-plan.geojson"
        }
    ]
}
This is from main.js
这是来自main.js
The id field is just something for you to recognize the map by. You can put anything there. Name is the human-readable name of the map. Owner is the name of your company (or the company claiming the building on WRLD). Location is the point on the map where the indoor map lives. That array is [longitude, latitude].
id字段只是您识别地图的依据。 您可以在这里放任何东西。 名称是人类可读的地图名称。 所有者是您公司的名称(或要求在WRLD上建房的公司)的名称。 位置是室内地图所在的地图上的点。 该数组为[longitude, latitude] 。
Then, there’s an array of levels. You can have multiple floors per building. We’ve only designed one, so that’s the one we’ve defined in the array. Put these two files in a folder and create a ZIP file from the folder. Then, head over to https://mapdesigner.wrld3d.com/indoormap/latest and start to create a map!
然后,有一系列的关卡。 每个建筑物可以有多个楼层。 我们只设计了一个,所以这就是我们在数组中定义的一个。 将这两个文件放在一个文件夹中,然后从该文件夹中创建一个ZIP文件。 然后,转到https://mapdesigner.wrld3d.com/indoormap/latest并开始创建地图!
Click New Indoor Map, and name it. Then, search for the appropriate building, using latitude and longitude. When you see the building you want, click on it and click Claim Buildings. Make sure you take the option to Download Floor Plan, as this’ll make tracing it in QGIS easier in a moment. Next, skip to the Upload Map step and upload the ZIP file you created. It’ll take a few moments to process. Once successful, you should see a button on the map to click on. Clicking on it will take you inside the building…
单击新建室内地图,然后命名。 然后,使用经度和纬度搜索合适的建筑物。 当您看到所需建筑物时,请在其上单击,然后单击“索赔建筑物”。 确保选择“下载楼层平面图”选项,因为这将使在QGIS中进行跟踪变得容易。 接下来,跳至“上传地图”步骤并上传您创建的ZIP文件。 这需要一些时间来处理。 成功后,您应该在地图上看到一个按钮可以单击。 单击它将带您进入建筑物...
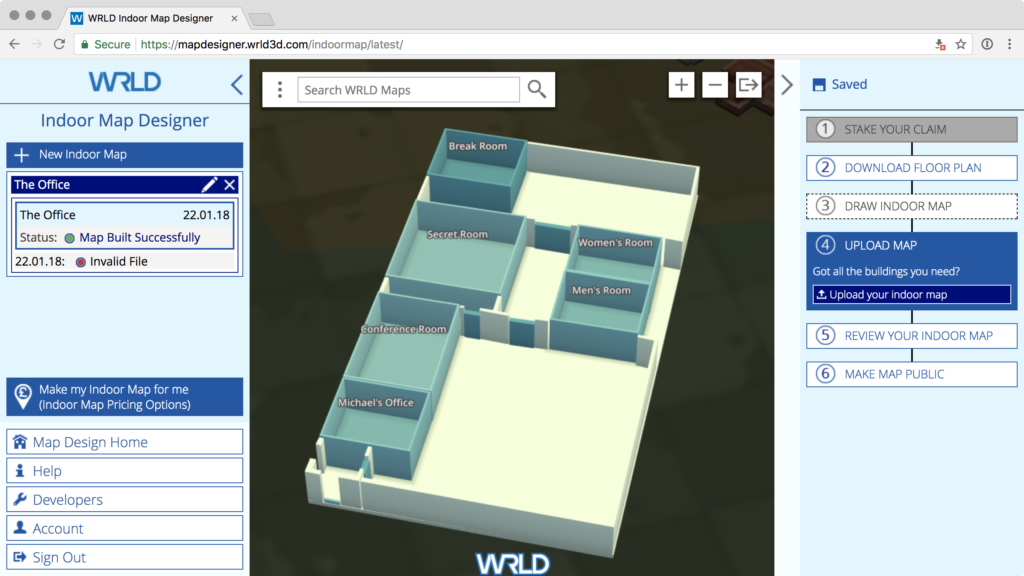
As you can see, I took a while to figure out that the location coordinates were “longitude, latitude” instead of “latitude, longitude”. When you’re happy with the indoor map, click Make map public.
如您所见,我花了一段时间才弄清楚location坐标是“经度,纬度”而不是“纬度,经度”。 当您对室内地图感到满意时,请单击“公开地图”。
There’s a longer, more detailed guide to creating these maps here. I found parts of it unhelpful, but your mileage may vary…
在此处 ,有更长,更详细的指南来创建这些地图。 我发现部分内容无济于事,但您的工作量可能会有所不同……
与室内地图互动 (Interacting with Indoor Maps)
It may take some time for your map to be approved. In the meantime, let’s look at how we can interact with indoor maps.
您的地图可能需要一些时间才能获得批准。 同时,让我们看看如何与室内地图互动。
For this part of the tutorial, we’re going to work with code hosted on CodePen. The CodePens are demonstrative and best results will be achieved using the code extracts and steps in the article. If you’d like a local setup, look for details of how to set that up in the previous tutorial.
在本教程的这一部分中,我们将使用CodePen上托管的代码。 CodePens是说明性的,使用本文中的代码摘录和步骤将获得最佳结果。 如果您希望进行本地设置,请在上一教程中查找有关设置方法的详细信息。
Let’s begin by creating a map and entering a pre-made building:
让我们从创建地图并输入预制建筑物开始:
const map = L.Wrld.map("map", "f24b71dd92ab9e38cf4aa53806ab813d", {
    center: [56.459801, -2.977928],
    zoom: 15,
    indoorsEnabled: true,
})

map.indoors.on("indoormapenter", () => {
    map.indoors.setFloor(2)
    map.setView([56.459984, -2.978238], 20)
})

map.on("initialstreamingcomplete", () => {
    map.indoors.enter("westport_house")
})
This is from CodePen
这是来自CodePen
In this example, we’re moving to the coordinates of the WRLD offices. Once the map has finished loading (via initialstreamingcomplete) then we ask the map to “go indoors”. On the indoormapenter event, we set the selected floor to 2 and zoom the map in further.
在此示例中,我们将移至WRLD办公室的坐标。 地图加载完成后(通过initialstreamingcomplete ),我们便要求地图“进入室内”。 在indoormapenter事件中,我们将所选楼层设置为2然后将地图进一步放大。
That’s going to work with the maps you’ve submitted, as well, once they’ve been approved.
一旦您批准的地图也将与您提交的地图一起使用。
We can interact with features by listening for a click event:
我们可以通过监听click事件来与功能交互:
map.indoors.on("indoorentityclick", (event) => {
    map.indoors.clearEntityHighlights()
    map.indoors.setEntityHighlights(event.ids[0], [255, 0, 0, 128])
})
This is from CodePen
这是来自CodePen
The indoorentityclick receives an event which holds the ID of the feature that we’re clicking on. We can use the clearEntityHighlights and setEntityHighlights events to toggle any custom colours on the features we want to highlight.
indoorentityclick收到一个事件,其中包含我们正在单击的功能的ID。 我们可以使用clearEntityHighlights和setEntityHighlights事件在要突出显示的功能上切换任何自定义颜色。
It’s probably time for another quote…
现在可能是另一个报价了……
I saw Wedding Crashers accidentally. I bought a ticket for “Grizzly Man” and went into the wrong theater. After an hour, I figured I was in the wrong theater, but I kept waiting. Cuz that’s the thing about bear attacks… they come when you least expect it. – Dwight… again
我无意中看到了婚礼失败者。 我买了“灰熊人”的门票,然后进了错误的剧院。 一个小时后,我以为自己在错误的剧院里,但是我一直在等待。 因为熊攻击就是这样……它们在您最不期望的时候出现。 – 德怀特…再次
创建可重复的高光图案 (Creating a Repeatable Highlight Pattern)
Let’s try an experiment. Let’s make a “record” button that records clicks we make on the map; and then replays them all back to us. We’d need a record and play button, as well as an array of clicks…
让我们尝试一个实验。 让我们做一个“记录”按钮,记录我们在地图上的点击; 然后将它们全部回放给我们。 我们需要一个录音和播放按钮,以及一系列点击…
<button id="record">record</button>
<button id="play">play</button>
This is from CodePen
这是来自CodePen
Now, let’s connect to these buttons with click events:
现在,让我们通过点击事件连接到这些按钮:
map.indoors.on("indoorentityclick", (event) => {
    map.indoors.clearEntityHighlights()
    map.indoors.setEntityHighlights(event.ids[0], [255, 0, 0, 128])

    clicks.push({
        time: new Date(),
        id: event.ids[0]
    })
})

let recording = false
let started = null
let clicks = []

const record = document.querySelector("#record")
const play = document.querySelector("#play")

record.addEventListener("click", () => {
    if (recording) {
        recording = false
        record.innerText = "record"
    } else {
        recording = true
        record.innerHTML = "stop"
        started = new Date()
        clicks = []
    }
})

play.addEventListener("click", () => {
    map.indoors.clearEntityHighlights()

    for (let click of clicks) {
        setTimeout(() => {
            map.indoors.clearEntityHighlights()
            map.indoors.setEntityHighlights(click.id, [255, 0, 0, 128])
        }, click.time.getTime() - started.getTime())
    }
})
This is from CodePen
这是来自CodePen
Let’s look at the record button event first. When clicked, if recording hasn’t yet started, we change the button’s text value to stop and we clear the clicks array. We also capture the moment at which the record button was clicked, so that we can time our events relative to it.
首先让我们看一下录制按钮事件。 单击时,如果尚未开始录制,则将按钮的文本值更改为stop然后清除clicks数组。 我们还将捕获单击“记录”按钮的时刻,以便我们可以相对于它计时事件。
If we click on it again, we can reset the button text value, and stop recording.
如果再次单击它,我们可以重置按钮文本值,并停止记录。
Then, when we click on the play button; we clear all highlighted features and start to loop through the “recorded” events. They’re in an array, so we can use a for...of loop. We set a timeout for each click event by taking the time of the click and subtracting the started time from it. All the timeouts are created at virtually the same time, but they are triggered relative to how long after the recording started they happened.
然后,当我们单击播放按钮时; 我们清除了所有突出显示的功能,并开始循环浏览“已记录”事件。 它们在数组中,因此我们可以使用for...of循环。 我们通过获取点击时间并从中减去started时间来为每个点击事件设置超时。 所有超时几乎都是在同一时间创建的,但是它们是相对于录制开始后多长时间触发的。
Finally, we need to capture the click events when features are clicked on. So, we hijack our earlier indoorentityclick event listener by adding the click events to the clicks array. Give it a go, by recording some clicks and then playing them back. It’s quite addictive…
最后,我们需要在单击功能部件时捕获单击事件。 因此,我们通过将click事件添加到clicks数组中,劫持了较早的indoorentityclick事件侦听器。 记录一些点击,然后播放,让它放手一搏。 相当上瘾……

创建时间表 (Creating a Schedule)
Let’s expand this idea to include a configurable schedule. Let’s say someone at WRLD moves around the office, during the day. Or, imagine (in fitting with our theme) that Dwight wanted to track the movements of Jim…
让我们将此想法扩展为包括可配置的计划。 假设WRLD的某人白天在办公室里走动。 或者,想象一下(符合我们的主题)德怀特想追踪吉姆的动向……
He could do that if he knew Jim’s schedule:
如果他知道吉姆的时间表,他可以这样做:
const schedule = [
    {
        "start": "08:00",
        "duration": "00:30",
        "id": "0003"
    },
    {
        "start": "08:30",
        "duration": "00:30",
        "id": "0004"
    },
    {
        "start": "09:15",
        "duration": "00:45",
        "id": "0028"
    },
    {
        "start": "10:00",
        "duration": "01:00",
        "id": "Meeting Room"
    },
    {
        "start": "12:00",
        "duration": "01:30",
        "id": "0039"
    }
];
This is from CodePen
这是来自CodePen
We can make a function that calculates the number of minutes for the time format we’re using (i.e 01:30 → 90):
我们可以创建一个函数来计算所用时间格式的分钟数(即01:30 : 01:30 → 90 ):
const timeToMinutes = (time) => {
    let holder = new Date();

    holder.setHours(0);
    holder.setMinutes(0);
    const start = holder.getTime();

    const parts = time.split(":");

    holder.setHours(parseInt(parts[0], 10));
    holder.setMinutes(parseInt(parts[1], 10));
    const end = holder.getTime();

    return (end - start) / 1000 / 60;
};

const schedule = [
    // ...
]

for (let event of schedule) {
    console.log(timeToMinutes(event.duration))
}
This is from CodePen
这是来自CodePen
This will print 30, 30, 45, 60, and 90 in order. Then we need to add these minutes to the start time, to work out when the end time is:
这将打印30 , 30 , 45 , 60 ,和90中的顺序。 然后,我们需要将这些分钟添加到开始时间,以算出结束时间是:
const timeToMinutes = (time) => {
    // ...
}

const startFromTime = (time) => {
    const parts = time.split(":");

    let holder = new Date();
    holder.setSeconds(0);
    holder.setHours(parseInt(parts[0], 10));
    holder.setMinutes(parseInt(parts[1], 10));

    return holder;
};

const endFromStartAndMinutes = (start, minutes) => {
    return new Date(start.valueOf() + (minutes * 1000 * 60));
};

const schedule = [
    // ...
]

for (let event of schedule) {
    const start = startFromTime(event.start)
    const minutes = timeToMinutes(event.duration)
    const end = endFromStartAndMinutes(start, minutes)

    console.log(start, end)
}
This is from CodePen
这是来自CodePen
…And this will log the start and end times relative to the current day. You may want the start and end times to be relative to a fixed day, so you’d need to modify startFromTime and endFromStartAndMinutes to take a day into account.
…这将记录相对于当天的开始和结束时间。 您可能希望开始时间和结束时间相对于固定日期,因此您需要修改startFromTime和endFromStartAndMinutes以将一天考虑在内。
Given these start and end times, we could code the indoor map to display the room where this staffer is right now:
给定这些开始和结束时间,我们可以对室内地图进行编码,以显示此职员现在所在的房间:
const schedule = [
    // ...
]

setInterval(() => {
    map.indoors.clearEntityHighlights();

    for (let event of schedule) {
        const start = startFromTime(event.start);
        const minutes = timeToMinutes(event.duration);
        const end = endFromStartAndMinutes(start, minutes);

        const now = new Date();

        if (now >= start && now <= end) {
            console.log("Time is now " + now.toLocaleTimeString() +
                        ", in the " + start.toLocaleTimeString() +
                        " to " + end.toLocaleTimeString() +
                        " interval. Highlighting entity " + event.id);
            map.indoors.setEntityHighlights(event.id, [255, 0, 0, 128]);
        }
    }
}, 1000);
This is from CodePen
这是来自CodePen
By comparing the current time to the start and end times of each event; we can tell which event the staffer is currently in (and highlight the feature accordingly).
通过将当前时间与每个事件的开始和结束时间进行比较; 我们可以告诉职员当前正在哪个事件(并相应地突出显示该功能)。
If you don’t see any highlighted entities, you probably don’t have any scheduled for the exact time you’re looking at the code. Try adjusting the schedule of that CodePen, and open the console to see which entity should be highlighted. I’ve also removed the record/play code from previous examples, to make it easier to see what’s going on in this demo.
如果您没有看到任何突出显示的实体,则可能是您在查看代码的确切时间没有安排任何时间。 尝试调整该CodePen的时间表,然后打开控制台以查看应突出显示的实体。 我还从前面的示例中删除了录制/播放代码,以使查看此演示中的内容变得更加容易。
Just think of how this could be expanded. You could add everyone’s schedules to create a virtual event booking system. Or, you could create an animated visualization to see if there are any conflicts. This too is another jumping-off point for an app.
试想一下如何扩展它。 您可以添加每个人的日程表以创建虚拟事件预订系统。 或者,您可以创建动画的可视化效果以查看是否存在任何冲突。 这也是应用程序的另一个起点。
摘要 (Summary)
We spent a lot of time learning the ins and outs of creating indoor maps. WRLD isn’t the only platform that understands QGIS-made maps, so it’s a good skill to learn if you want to do all kinds of mapping.
我们花了很多时间来学习制作室内地图的来龙去脉。 WRLD并不是唯一了解QGIS制作的地图的平台,因此如果要进行各种地图绘制,这是一项很好的技能。
We also looked at how QGIS-made maps are imported and used inside the WRLD platform. We can define maps with a huge amount of detail, and interact with them in real time. Once you know what to install and how to draw features, indoor mapping is pretty straightforward.
我们还研究了如何在WRLD平台内导入和使用QGIS制作的地图。 我们可以定义大量细节的地图,并与它们实时交互。 一旦知道要安装什么以及如何绘制特征,室内贴图就非常简单了。
Take some time to think of how you could use this, to model your home or office. Perhaps you could use the indoor maps, in conjunction with other Leaflet functionality, to create heat flow maps or energy use per room maps. Perhaps you could create your own office scheduling application.
花一些时间思考如何使用它来为房屋或办公室建模。 也许您可以将室内地图与其他Leaflet功能结合使用,以创建热流图或每间房间的能源使用图。 也许您可以创建自己的办公室调度应用程序。
I should mention: if you want to work on custom indoor maps but don’t feel like designing them yourself, WRLD offer an indoor mapping service, for a fee. I haven’t experimented with the higher tiers of service and functionality, but it appears WRLD are quite flexible with regards to how the 3D indoor maps are made public (for things like stadiums and airports) vs. private (for things like hospitals and schools). Following this tutorial, they’ve also told me they’re looking to simplify the documentation and workflow for indoor map making. It’s a bit detailed at the moment, but well worth the results if you ask me. Imagine if it was even easier to do…
我应该提到:如果您想处理自定义的室内地图,但又不想自己设计,WRLD提供收费的室内地图服务 。 我没有尝试过更高层的服务和功能,但是就3D室内地图的公开(对于体育场馆和机场等)还是私人(对于医院和学校等)而言,WRLD似乎非常灵活)。 在学习完本教程之后,他们还告诉我,他们正在寻求简化室内地图制作的文档和工作流程。 目前有点详细 ,但是如果您问我,结果值得。 想象一下,这样做是否更容易……
We’re at the end of our WRLD journey. It has become one of my favorite embeddable services. It’s fun to work with and can be quite detailed and flexible. What’s more, I haven’t paid a cent to use it. I hope you’ve had as much fun following these tutorials as I have had writing them. Let me know what you’ve built on Twitter. You can also contact WRLD with questions or to show them what you’ve built.
我们正处于WRLD旅行的终点。 它已成为我最喜欢的嵌入式服务之一。 使用起来很有趣,并且可以非常详细和灵活。 而且,我还没有付任何钱使用它。 我希望您在学习这些教程的过程中获得了与编写它们一样的乐趣。 让我知道你在Twitter上建立了什么。 您也可以联系WRLD询问问题或向他们展示自己的想法。
翻译自: https://www.sitepoint.com/how-to-build-an-indoor-office-map-with-wrld/


 被折叠的 条评论
为什么被折叠?
被折叠的 条评论
为什么被折叠?
 到【灌水乐园】发言


