php项目 jenkins
In the previous articles in this series, we set up Jenkins and our project and did an analysis of the first few builds. So far, we have seen interesting results come back regarding the quality of our project. In this article, we are going to take a look at some more tools and plugins which we can use for inspecting the front end assets.
在本系列的前几篇文章中,我们设置了Jenkins和我们的项目,并对前几个版本进行了分析。 到目前为止,我们已经看到有关项目质量的有趣结果。 在本文中,我们将研究更多可用于检查前端资产的工具和插件。
CSSLint (CSSLint)
So far, we have been analyzing our PHP code only. There is a good chance you also included some web interfaces within your project which are using CSS. We can analyze our CSS by using CSS Lint.
到目前为止,我们仅在分析PHP代码。 您很有可能在项目中也包含一些使用CSS的Web界面。 我们可以使用CSS Lint分析CSS 。
First we need to install CSS Lint on our Jenkins server. Since we already have NPM installed, we just have to run the command below to get CSSLint installed.
首先,我们需要在我们的Jenkins服务器上安装CSS Lint。 由于已经安装了NPM,因此只需运行以下命令即可安装CSSLint。
sudo npm install -g csslintOnce installed, we need to update our build.xml file and add a new target. You can define which parts should be checked and if it should be a warning or an error. A full overview of possible rules can be found here.
安装完成后,我们需要更新build.xml文件并添加一个新目标。 您可以定义应该检查的零件,以及应该是警告还是错误。 可能规则的完整概述可以在这里找到。
<target name="csslint" description="Run the CSSLint tool on CSS files">
	<fileset dir="${basedir}/src" id="cssfiles.raw">
	  <include name="**/*.css" />
	</fileset>
	<pathconvert pathsep=" " property="cssfiles.clean" refid="cssfiles.raw" />
	<exec executable="csslint" output="${basedir}/build/logs/csslint.xml">
	  <arg line="--warnings=box-model,floats --errors=ids,important --format=lint-xml ${cssfiles.clean}" />
	</exec>
 </target>
Don’t forget to add the target as a dependency at the ‘build’ target. You can see my full commit over here.
不要忘记将目标作为依赖项添加到“ build”目标。 您可以在这里看到我的全部承诺。
We also need to make a change in the configuration of our project on Jenkins. Make sure you go to the project view page of your project and click ‘configure’ in the left side menu. If you scroll all the way down, you will see a block named ‘report violations’ at some point. Within this table, you will notice a record saying ‘csslint’. All we have to do is to add the report file to the last input field.
我们还需要对Jenkins上的项目配置进行更改。 确保您进入项目的项目视图页面,然后单击左侧菜单中的“配置”。 如果您一直向下滚动,有时会看到一个名为“报告违规”的块。 在此表中,您会注意到一条记录“ csslint”。 我们要做的就是将报告文件添加到最后一个输入字段。
You can also configure the first 3 input fields. Those input fields tell Jenkins how it should mark your project for this given check. For instance, the 10 below the sun means that if you have between 0 and 10 issues, the report will contain a sun. If you have 11 or more issues, it will be cloudy. Through this, Jenkins tries to tell you what the status of your project is. Of course, it’s best to have a sun icon. The stormy icon marks the lowest value to indicate the project is in bad shape. The yellow ball even indicates the build is unstable. It doesn’t mean the build failed, but you should really take a closer look at your project.
您还可以配置前3个输入字段。 这些输入字段告诉Jenkins,应如何为给定的支票标记项目。 例如,太阳下的10表示如果您的问题在0到10之间,则报告将包含太阳。 如果您有11个或更多的问题,那将是阴天。 通过这种方式,Jenkins试图告诉您项目的状态。 当然,最好有一个太阳图标。 风雨如磐的图标标记为最小值,表示项目状况不佳。 黄球甚至表明构建不稳定。 这并不意味着构建会失败,但是您应该真正仔细研究一下您的项目。

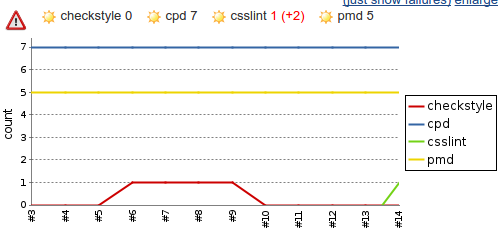
After you build your project again, the violations graph will indicate the amount of CSS Lint issues it has discovered.
再次构建项目后,违规图将显示发现CSS Lint问题的数量。

If you want to know exactly where the issues are located and what the issues are, you can click on ‘violations’ in the left side menu and scroll to CSS Lint. Here you are able to see a list of files and by clicking on a file, you can see the exact line that has an issue.
如果您想确切地知道问题所在的位置以及问题所在,可以单击左侧菜单中的“违规”,然后滚动到CSS Lint。 在这里,您可以查看文件列表,然后单击文件,可以看到出现问题的确切行。

JavaScript (JavaScript)
Besides CSS, you might also want to validate your JavaScript. For this, we can use JSHint since it can return files to Jenkins which can be read by several plugins.
除了CSS,您可能还想验证JavaScript。 为此,我们可以使用JSHint,因为它可以将文件返回给Jenkins,并且可以被多个插件读取。
JSHint is a fork of JSLint. Both can validate your JavaScript files, but I prefer JSHint over JSLint because it’s more actively maintained and more flexible
JSHint是JSLint的分支。 两者都可以验证您JavaScript文件,但是与JSLint相比,我更喜欢JSHint,因为它可以更积极地维护并且更灵活
We start off by installing JSHint on our Jenkins server.
我们首先在Jenkins服务器上安装JSHint。
sudo npm install -g jshintOnce again we are going to change our build.xml file by adding a JSHint target. Don’t forget to also change your build target. You can see my full commit over here.
再一次,我们将通过添加JSHint目标来更改build.xml文件。 别忘了还要更改构建目标。 您可以在这里看到我的全部承诺。
<target name="jshint" description="Run the JSHint tool on JavaScript files">
  <fileset dir="${basedir}/src" id="jsfiles.raw">
    <include name="**/*.js" />
  </fileset>
  <pathconvert pathsep=" " property="jsfiles.clean" refid="jsfiles.raw" />
  <exec executable="jshint" output="${basedir}/build/logs/jshint.xml">
    <arg line="--reporter=jslint ${jsfiles.clean}" />
  </exec>
 </target>
Once again we change the configuration of our project like we did with CSSLint. Note that we set the output reporter in the target to jslint in our build.xml file. This means it will output a format which is compatible with JSLint. Our violations plugin is capable of reading this format by filling in the report file in the input field behind JSlint.
我们再次像使用CSSLint一样更改项目的配置。 请注意,我们在build.xml文件中将目标中的输出报告程序设置为jslint 。 这意味着它将输出与JSLint兼容的格式。 我们的违规插件可以通过在JSlint后面的输入字段中填写报告文件来读取此格式。

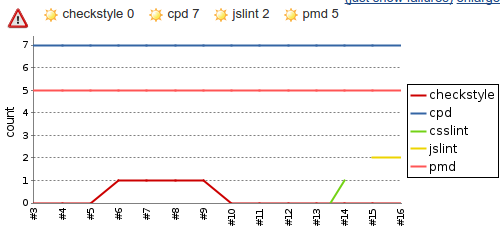
Like CSSLint, you will see the results of JSHint in the violations graph. Within the violations page, you can see the exact line of the issue and its details.
与CSSLint一样,您将在违规图表中看到JSHint的结果。 在违规页面中,您可以看到问题的确切内容及其详细信息。


开放任务 (Open tasks)
There are always cases when you can’t finish a particular feature right now or it needs some additional improvements. You will probably add a ‘@todo’ to your code to indicate this is still on the todo list. With the plugin we are going to install, you can gather these tags and get a quick overview of what’s still open.
在某些情况下,您有时无法立即完成特定功能,或者需要一些其他改进。 您可能会在代码中添加一个“ @todo”,以指示该代码仍在待办事项列表中。 使用我们将要安装的插件,您可以收集这些标签并快速浏览仍在打开的内容。
For this, you need to install the ‘task scanner plugin’. Check back in the very first article if you are uncertain how to install this plugin. After installing, head back to your project view and click ‘configure’ in the left side menu.
为此,您需要安装“任务扫描程序插件”。 如果不确定如何安装此插件,请回顾第一篇文章。 安装后,返回项目视图,然后单击左侧菜单中的“配置”。
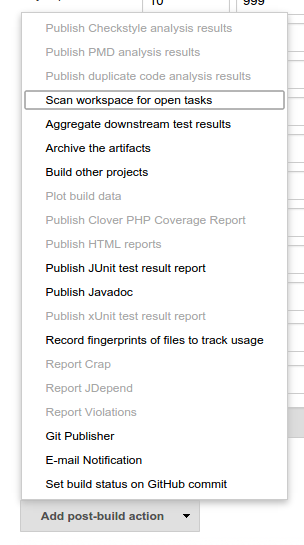
If you scroll all the way down, you will see a select box which says ‘add post build action’. Click on it and select ‘scan workspace for open tasks’
如果您一直向下滚动,则会看到一个选择框,上面写着“添加构建后动作”。 单击它,然后选择“扫描工作区以查找未完成的任务”

Between all other configuration blocks, a new block appears to configure the task scanner. First we have to fill in which directories and files we want to scan. For now I only want to scan the PHP files within the src directory, so I fill in src/**/*.php. Next I am going to pick which words are high, medium and low priority. I believe “FIXME” is a high priority, “TODO” is a medium priority and “DEPRECATED” is a low priority. Finally, I am configuring that I want to ignore the letter case, so I can be sure all words are picked up. My configuration now looks like this.
在所有其他配置块之间,将出现一个新块来配置任务扫描器。 首先,我们必须填写要扫描的目录和文件。 现在,我只想扫描src目录中PHP文件,所以我填写src/**/*.php 。 接下来,我将选择哪个词是高,中和低优先级。 我认为“ FIXME”是高优先级,“ TODO”是中优先级,“ DEPRECATED”是低优先级。 最后,我配置为忽略字母大小写,因此可以确保所有单词都被选中。 我的配置现在看起来像这样。

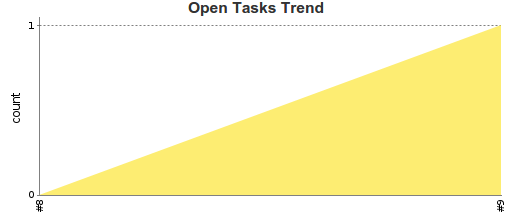
After clicking save at the bottom, we can click ‘build now’ in the left side menu to start an analysis. If we have a couple of builds, a graph will appear on the project view page which indicates the total number of open tasks.
单击底部的保存后,我们可以单击左侧菜单中的“立即构建”以开始分析。 如果我们有几个构建版本,则一个图形将出现在项目视图页面上,该图形指示未完成任务的总数。

We can click in the left side menu on ‘open tasks’ to get more information about all the tasks that are currently open. The view looks very similar to the results reported back from tools like PHP CodeSniffer and PHP MD.
我们可以在左侧菜单中单击“打开的任务”,以获取有关当前所有打开的任务的更多信息。 该视图看起来与从PHP CodeSniffer和PHP MD等工具返回的结果非常相似。

结论 (Conclusion)
The things you can do with Jenkins are countless. Do note, however, that different tools are doing the heavy lifting, Jenkins is just combining the information and creating nice reports and visualizations.
詹金斯可以做的事情不胜枚举。 请注意,但是,不同的工具正在承担繁重的任务,Jenkins只是在组合信息并创建漂亮的报告和可视化效果。
If you think we went through all the possible tools, you are wrong. The list of plugins is endless and the list of tools even more so. Perhaps you are interested in PhpDocumentor instead of PhpDox. Perhaps you are working with SASS and you want to lint the SCSS files. Lucky for you, a tool is available. Jenkins can also help you out with your Android application and iOS application.
如果您认为我们使用了所有可能的工具,那您是错的。 插件的列表是无止境的,工具的列表甚至更多。 也许您对PhpDocumentor而不是PhpDox感兴趣。 也许您正在使用SASS,并且想要整理SCSS文件。 幸运的是,您可以使用一种工具 。 Jenkins还可以为您提供Android应用程序和iOS应用程序的帮助。
Are you going to use Jenkins yourself? Are you using it already? Is anything missing you would like to see an article about or do you have some remarks? I would love to hear from you in the comments below.
您要自己使用Jenkins吗? 您已经在使用它吗? 您是否想看一篇有关文章的文章,或者您有什么要说的? 我希望在下面的评论中听到您的意见。
翻译自: https://www.sitepoint.com/useful-jenkins-plugins-php-projects/
php项目 jenkins


 626
626

 被折叠的 条评论
为什么被折叠?


