


xdebug
It’s been 15 years since Xdebug first came out. We think this is the perfect opportunity to re-introduce it to the world, and explain how and why it does what it does.
自Xdebug首次问世以来已有15年了。 我们认为,这是将其重新介绍给世界,并解释它如何以及为什么做其工作的绝好机会。

Xdebug is a PHP extension (meaning it needs to be compiled and installed into a PHP installation) which provides the developer with some features for debugging. Those include:
Xdebug是一个PHP扩展(意味着它需要编译并安装到PHP安装中),为开发人员提供了一些调试功能。 这些包括:
- stack traces – detailed output of the path the application took to reach a given error, including parameters passed to functions, in order to easily track the error down. 堆栈跟踪–应用程序到达给定错误所用路径的详细输出,包括传递给函数的参数,以便轻松地跟踪错误。
a prettier
var_dumpoutput which produces color coded information and structured views, similar to VarDumper, along with a a super-globals dumper一个漂亮的
var_dump输出,该输出产生颜色编码的信息和结构化视图,类似于VarDumper ,以及一个超级全局转储器a profiler for finding out where the bottlenecks in your code are, and the ability to visualize those performance graphs in external tools. What this results in is a graph similar to that which Blackfire produces.
分析器,以找出代码瓶颈所在的位置,以及在外部工具中可视化这些性能图的能力。 结果是类似于Blackfire生成的图形。
- a remote debugger which can be used to remotely connect Xdebug with running code and an end-client like an IDE or a browser to step through breakpoints in code and execute line by line of your application. 一个远程调试器,可用于将Xdebug与正在运行的代码远程连接,并使用最终客户端(如IDE或浏览器)逐步遍历代码中的断点并逐行执行应用程序。
- code coverage which tells you how much of your code was executed during a request. This is almost exclusively meant to help with unit tests and finding out how much of your code is test-covered. 代码覆盖率,告诉您在请求期间执行了多少代码。 这几乎完全是为了帮助进行单元测试以及找出测试覆盖了多少代码。
如何使用? (How do I use it?)
Xdebug comes with a detailed installation page which handles most if not all use cases, but if you’d like to play with the functionality presented below, we recommend using Homestead Improved which comes with the extension pre-installed and activated.
Xdebug附带了一个详细的安装页面 ,该页面可以处理大多数(如果不是全部)用例,但是如果您想使用以下功能,我们建议您使用预安装并激活该扩展程序的Homestead Improvement 。
使用现代IDE和Blackfire,甚至还需要Xdebug? (With modern IDEs and Blackfire, is there even a need for Xdebug?)
IDEs do provide good code lookup functionality, so the link format functionality’s usefulness can seem questionable. There’s also loggers of all kinds now which can handle errors and exceptions. Likewise, function traces and profiling are done really well in Blackfire. However, file link formats are just one part of Xdebug, and using Blackfire has its own hurdles – installing the extension, setting up the keys, and then paying to keep trace history. Loggers also need to be used with a lot of foresight, and aren’t very easy to add into an application later on.
IDE确实提供了良好的代码查找功能,因此链接格式功能的有用性似乎令人怀疑。 现在也有各种记录器可以处理错误和异常。 同样,在Blackfire中,功能跟踪和性能分析也做得很好。 但是,文件链接格式只是Xdebug的一部分,而使用Blackfire则有其自身的障碍-安装扩展名,设置密钥,然后付费以保留跟踪历史记录。 记录器还需要很有远见,并且以后添加到应用程序中并不是很容易。
There’s more to Xdebug than just this, though – it’s still required for proper unit testing (testing frameworks depend on it for code coverage reports), it’s far from easy to get remote break-point debugging going via other means, and it’s a tool so old and stable it’s been ironed out to near perfection.
但是,Xdebug不仅限于此-正确的单元测试仍然需要它(测试框架依赖于它的代码覆盖率报告),要通过其他方式进行远程断点调试远非易事,而且它是一个工具,它既古老又稳定,已经被完美修复。
If your current tools can handle everything it offers or you don’t need the features it offers then of course, there’s no need for Xdebug, but I’ve yet to start a single project that could be completed just as efficiently without it.
当然,如果您当前的工具可以处理它提供的所有功能,或者您不需要它提供的功能,那么就不需要Xdebug,但是我还没有启动一个项目,如果没有它,它可以同样高效地完成。
让我们尝试一下 (Let’s Try It Out)
I’ll assume you have a working Xdebug installation at this point. If not, please consider using Homestead Improved.
我假设此时您的Xdebug安装正常。 如果没有,请考虑使用Homestead Enhanced 。
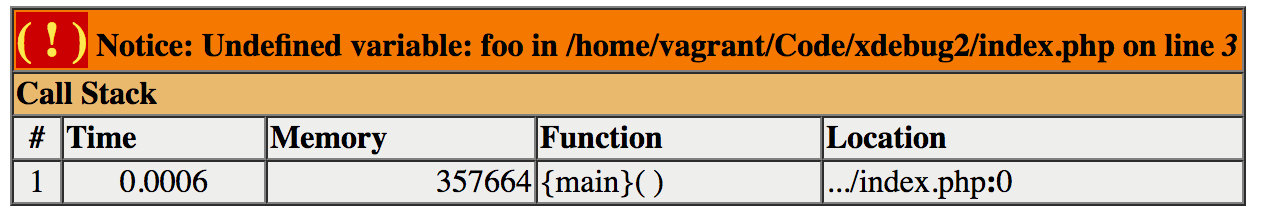
Let’s make a new project folder with a simple index.php file, and echo out a non-existent variable like $foo:
让我们用一个简单的index.php文件创建一个新的项目文件夹,并回显一个不存在的变量,例如$foo :
<?php

echo $foo;
This is what we get:
这是我们得到的:
关闭Xdebug (Turning Xdebug Off)
Screens like these are so ubiquitous these days, and such a common default, that most people don’t even realize this is already Xdebug-styled. To prove it, let’s see how it looks without Xdebug. To disable Xdebug, we edit the file /etc/php/7.1/fpm/conf.d/20-xdebug.ini in Homestead Improved, and comment out the first line:
如今,这样的屏幕无处不在,并且具有如此普遍的默认设置,以至于大多数人甚至没有意识到这已经是Xdebug风格的了。 为了证明这一点,让我们看看没有Xdebug的外观。 要禁用Xdebug,我们在Homestead Improvement中编辑文件/etc/php/7.1/fpm/conf.d/20-xdebug.ini并注释掉第一行:
;zend_extension=xdebug.so
xdebug.remote_enable = 1
xdebug.remote_connect_back = 1
xdebug.remote_port = 9000
xdebug.max_nesting_level = 512
We need to restart PHP-FPM afterwards:
之后,我们需要重新启动PHP-FPM:
sudo service php7.1-fpm restartNote: if you’re using another development environment with a different PHP installation, your Xdebug ini file might be elsewhere. Consult your system’s documentation for the exact location, or ask in the comments below.
注意:如果您在另一个开发环境中使用不同PHP安装,则Xdebug ini文件可能在其他位置。 请查阅系统文档以获取确切位置,或在以下评论中提问。

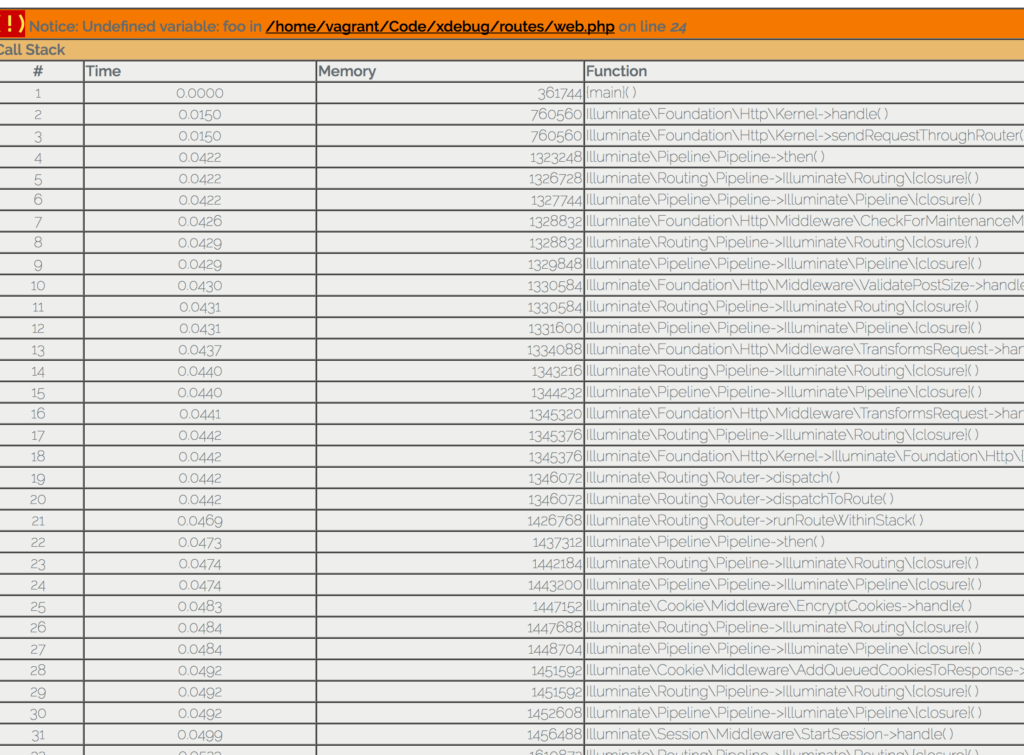
Looks quite barren, doesn’t it? It’s missing the whole call stack. Granted, this information isn’t particularly useful at this point since we’re only dealing with a single line in a single file, but we’ll look at a heavier use later on.
看起来很贫瘠,不是吗? 它缺少整个调用堆栈。 当然,此信息在这一点上并不是特别有用,因为我们只处理单个文件中的一行,但是稍后我们将研究更多的用途。
Reactivate Xdebug now by removing the comment in the previously edited file, and let’s continue. Don’t forget to restart PHP!
现在,通过删除先前编辑的文件中的注释来重新激活Xdebug,让我们继续。 不要忘记重启PHP!
文件点击率 (File Clickthroughs)
If you’re a developer who’s fixed on an IDE (like I am on PhpStorm), it would definitely be useful to be able to click on files in the stack trace and go directly to them in the IDE. A non-trivial upgrade in debugging speed, for sure. I’ll demonstrate the implementation of this feature for PhpStorm.
如果您是固定在IDE上的开发人员(例如我在PhpStorm上),那么能够单击堆栈跟踪中的文件并直接在IDE中直接访问它们绝对有用。 毫无疑问,这是调试速度的一次重要提升。 我将为PhpStorm演示此功能的实现。
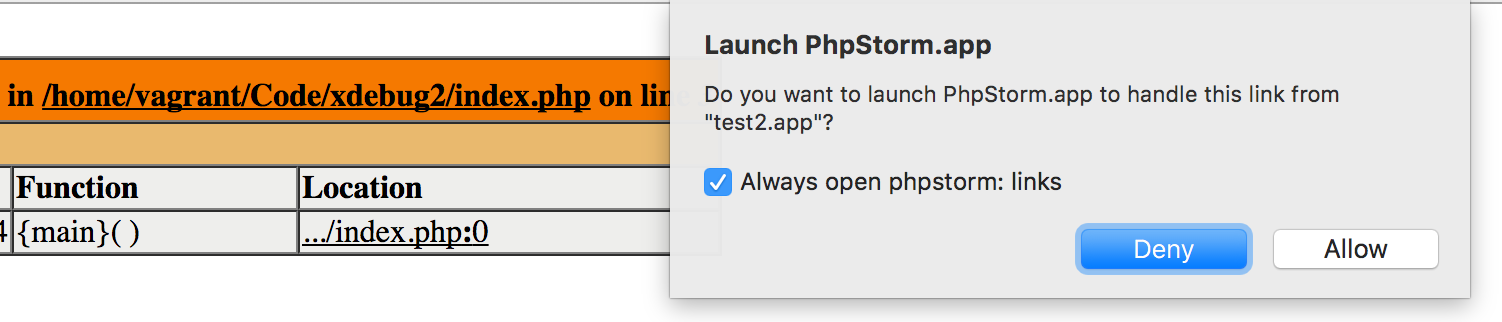
First, let’s open the 20-xdebug.ini file we edited previously, and add the following to it:
首先,让我们打开我们先前编辑的20-xdebug.ini文件,并添加以下内容:
xdebug.file_link_format = phpstorm://open?%f:%lNote that this will work in some browsers, and won’t in others. For example, Opera has problems with phpstorm:// links and will gladly crash, while Firefox and Chrome work just fine.
请注意,这将在某些浏览器中有效,而在其他浏览器中则无效。 例如,Opera的phpstorm://链接存在问题,并且会崩溃,而Firefox和Chrome可以正常运行。
If we refresh our invalid PHP page now, we’ll get clickable links which open the IDE at the precise location of the error:
如果现在刷新无效PHP页面,我们将获得可单击的链接,这些链接将在错误的确切位置打开IDE:
The process is the same for other IDEs and editors.
其他IDE和编辑器的过程相同。
Xdebug与Vagrant和PhpStorm (Xdebug with Vagrant and PhpStorm)
Why stop at this, though? Many people today develop on virtual machines, making sure no part of the PHP runtime ever touches their main machine, keeping everything fast and smooth. How does Xdebug behave in those cases? Additionally, is it even possible to do break-point debugging where you step through your code and inspect each line separately when using such complex environments?
不过,为什么要在此停下来? 如今,许多人都在虚拟机上进行开发,以确保PHP运行时中的任何部分都不会碰到其主机,从而确保一切都快速,流畅地进行。 在这种情况下,Xdebug的表现如何? 此外,在使用这种复杂环境时,甚至可以在您单步执行代码并分别检查每一行的情况下进行断点调试吗?
Luckily, Xdebug supports break-point-powered remote connections perfectly. We’ve covered the process before, so for a full gif-powered setup tutorial, please follow this guide.
幸运的是,Xdebug完美支持断点供电的远程连接。 我们之前已经介绍了该过程,因此,有关完整的gif驱动的设置教程,请遵循此指南 。
使用探查器 (Using the Profiler)
As a final quick tip, let’s inspect one of the often neglected features: the profiler. For that, we’ll need a heavy application like Laravel.
作为最后的快速技巧,让我们检查一下经常被忽略的功能之一:探查器。 为此,我们需要像Laravel这样的繁重应用程序。
composer create-project --prefer-dist laravel/laravel xdebugOnce again, we need to edit the 20-xdebug.ini file, and add the following:
再一次,我们需要编辑20-xdebug.ini文件,并添加以下内容:
xdebug.profiler_enable_trigger = 1
xdebug.profiler_output_dir = /home/vagrant/Code/
Note that we’re not using xdebug.profiler_enable = 1 because we don’t want it to stay on 100% of the time. Instead, we’ll use the trigger query param “XDEBUG_PROFILE” to selectively activate it. We’re also outputting the cachegrind profile into the main shared folder of our VM so that we can inspect it with tools on the host operating system.
请注意,我们不使用xdebug.profiler_enable = 1因为我们不希望它保持100%的时间。 相反,我们将使用触发器查询参数“ XDEBUG_PROFILE”来有选择地激活它。 我们还将cachegrind配置文件输出到我们的VM的主共享文件夹中,以便我们可以使用主机操作系统上的工具对其进行检查。
After restarting PHP, we can try it out by executing homestead.app/?XDEBUG_PROFILE (replace homestead.app with whichever vhost you picked, or the VM’s IP). Sure enough, the file is there:
重新启动PHP后,我们可以通过执行homestead.app/?XDEBUG_PROFILE (用您选择的虚拟主机或VM的IP替换homestead.app)来进行尝试。 果然,文件在那里:
Every OS will have its own cachegrind inspector tool, and on OS X one of those is qcachegrind, easily installed via Homebrew. Refer to your OS’s preferred visualizer for installation instructions. After installing it…
每个操作系统都有自己的cachegrind检查器工具,在OS X上,其中之一是qcachegrind,可通过Homebrew轻松安装。 有关安装说明,请参阅操作系统的首选可视化工具。 安装后…
brew install qcachegrind --with-graphviz… and opening the file in the viewer, we can see a nice breakdown of the execution flow:
…并在查看器中打开文件,我们可以看到执行流程的详细分解:
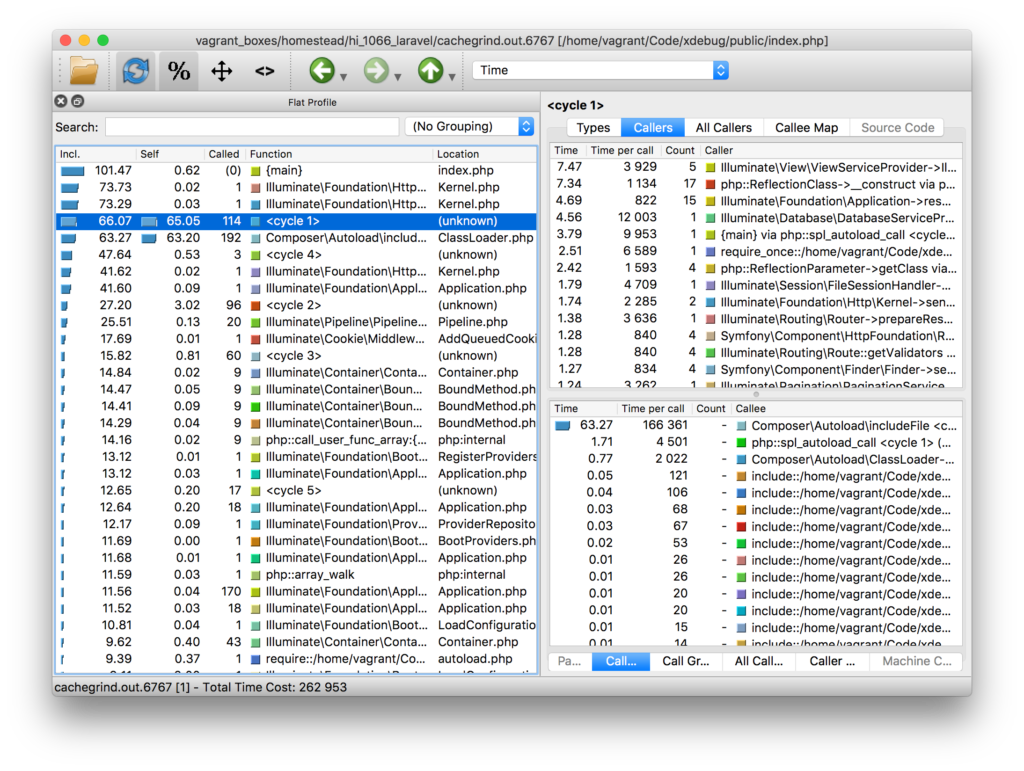
The profiler offers and immeasurable wealth of data and truly deep insight into the way your code behaves, just like Blackfire. With the profiler’s local output, however, it’s easier than ever to automate the continuous tracking of performance and execution complexity.
与Blackfire一样,探查器提供了无数的数据,并真正深入地了解了代码的行为方式。 但是,有了探查器的本地输出,自动化对性能和执行复杂性的连续跟踪比以往任何时候都更加容易。
在Laravel上强制Xdebug的渲染 (Forcing Xdebug’s Render on Laravel)
By default, Laravel has custom error reports and rendering set up. An error like the one we caused before with an undefined variable would, in Laravel, look like this:
默认情况下,Laravel具有自定义错误报告和渲染设置。 在Laravel中,类似于我们之前使用未定义变量引起的错误如下所示:
<?php

use Illuminate\Http\Request;

Route::get('/', function(Request $request){
    echo $foo;
    return view('welcome');
});
While Symfony’s error screen (which is what Laravel is using here) is configured to also play nice with Xdebug’s clickthrough (try it, you can now click on these files and their lines, too!), I really miss the memory output (Xdebug by default also outputs the memory usage at every point in time in the stacktrace). Let’s revert this to Xdebug’s screen while in development mode, so we can inspect that attribute.
虽然Symfony的错误屏幕(这是Laravel在这里使用的屏幕)配置为也可以很好地与Xdebug的点击功能配合使用(尝试一下,现在您也可以单击这些文件及其行!),但我确实错过了内存输出(Xdebug by default还会在stacktrace的每个时间点输出内存使用情况。 在开发模式下,让我们将其还原到Xdebug的屏幕上,以便我们可以检查该属性。
<?php
use Illuminate\Http\Request;

Route::get('/', function(Request $request){
    ini_set('display_errors', 1);
    restore_error_handler();
    echo $foo;
    return view('welcome');
});
You can see here we updated our default route so that it first activates the displaying of errors (the screen we saw earlier is not a shown error per-se, but a caught exception the stack trace of which was manually extracted and rendered), and then we restore the error handler to its default value, overriding Laravel’s.
您可以在此处看到我们更新了默认路由,以便它首先激活错误显示(我们先前看到的屏幕本身并不是显示的错误,而是捕获的异常,其堆栈跟踪是手动提取并呈现的),以及然后将错误处理程序恢复为默认值,覆盖Laravel的默认值。
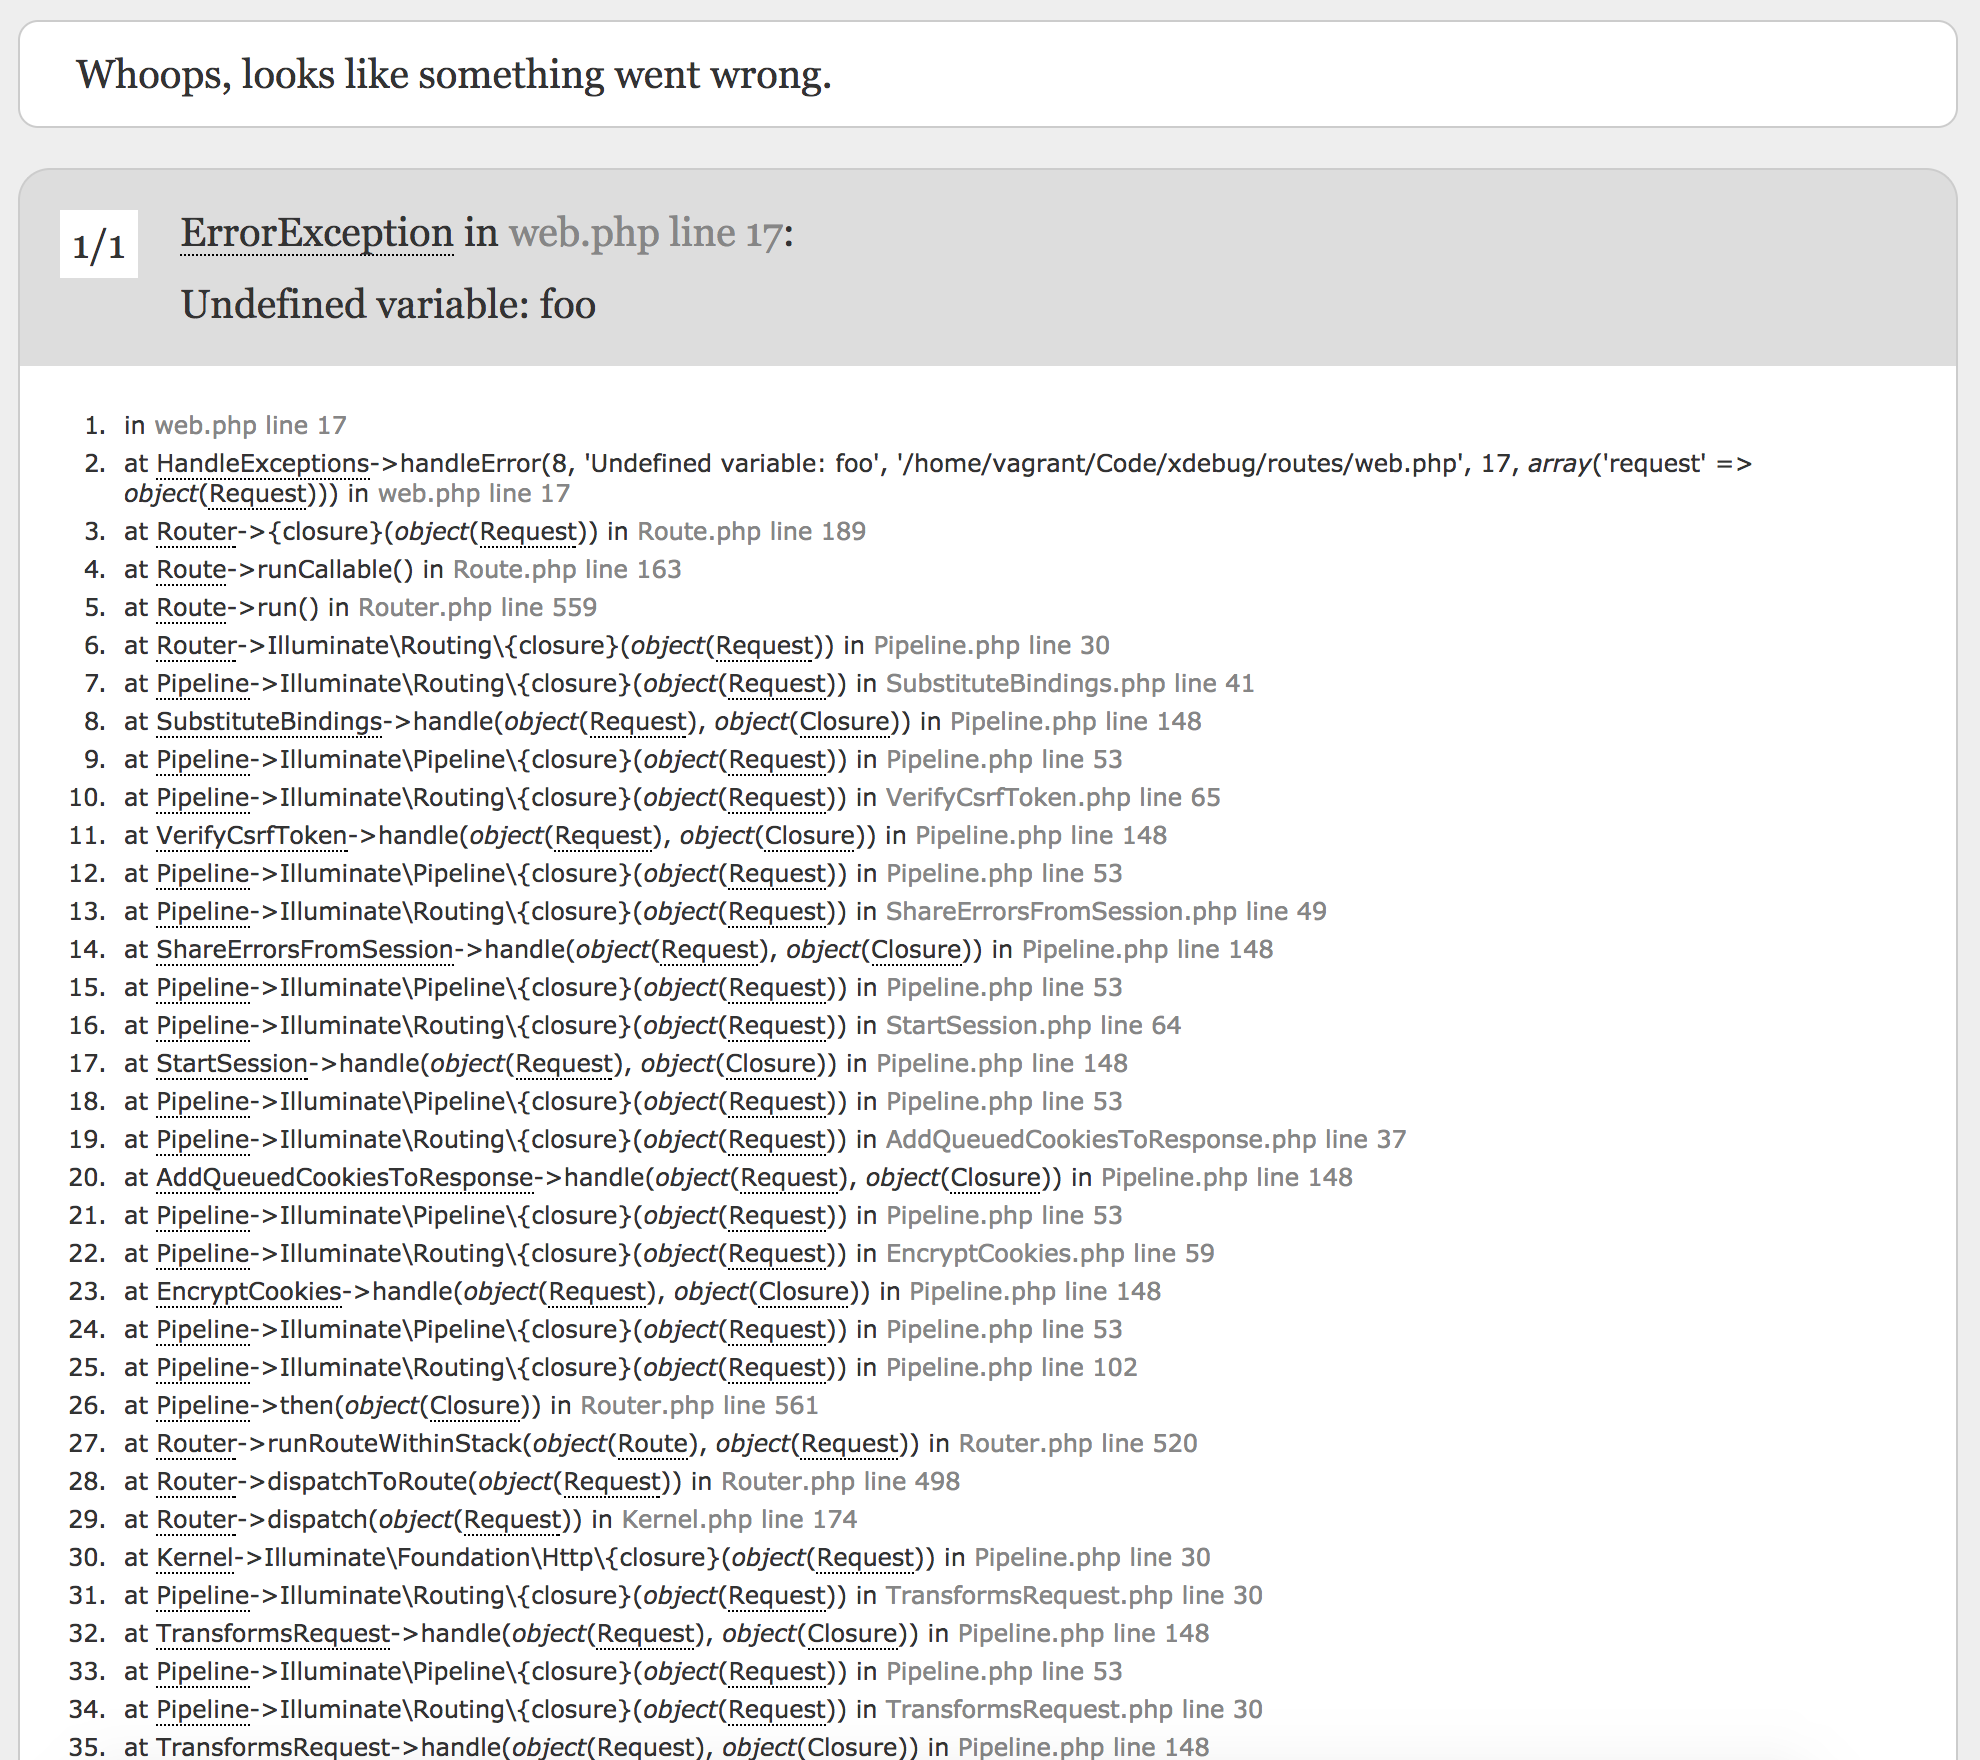
After refreshing, sure enough, our old screen is back – just look at that stack trace tower and memory consumption!
刷新之后,可以肯定的是,我们的旧屏幕又回来了–只看一下堆栈跟踪塔和内存消耗!
I encourage you to investigate further on your own – look around in the docs, play with the options, see what you can find out about your applications.
我鼓励您自己进行进一步的研究-在文档中四处浏览,使用选项,看看您可以找到有关您的应用程序的信息。
结论 (Conclusion)
Xdebug is a valuable tool for any developer’s toolbelt. It’s a powerful extension that fully lives up to the word, extending the language we work in daily to be more verbose, more user friendly, and less mysterious when errors appear.
Xdebug对于任何开发人员的工具带都是有价值的工具。 这是一个功能强大的扩展程序,完全符合单词的需要,将我们每天使用的语言扩展为更冗长,更用户友好,并且在出现错误时也更加神秘。
With 15 whole years behind it, Xdebug has set a high standard for debugging tools. I’d like to thank Derick for developing and maintaining it all this time, and I’d love it if you chose to write a tutorial or two about in-depth usage, caveats, or secret feature combinations no one’s thought of before. Let’s spread the word and help it thrive for another 15 years.
经过15年的发展,Xdebug为调试工具树立了高标准。 我要感谢Derick一直以来都在开发和维护它,如果您选择编写一两个关于深度使用,注意事项或秘密功能组合的教程,这是我以前从未想到的,我将非常感谢 。 让我们传播这个词,并帮助它成长15年。
Happy birthday, Xdebug!
生日快乐,Xdebug!
xdebug


 1384
1384

 被折叠的 条评论
为什么被折叠?
被折叠的 条评论
为什么被折叠?
 到【灌水乐园】发言


