


web应用监控 elk
WordPress is an amazing piece of engineering. There’s little wonder that more than a quarter of all CMS-based websites are using it. In reality, though, WordPress sites crash just like any other site. Bad plugins or themes causing the “WordPress screen of death”, or WordPress updates going south, are an all too frequent occurrence.
WordPress是一项了不起的工程。 毫无疑问, 超过四分之一的基于CMS的网站都在使用它 。 但实际上,WordPress网站像其他任何网站一样崩溃。 错误的插件或主题会导致“ WordPress死机”,或者WordPress更新无法实现,这太常见了。

When something does go wrong, one of the first things you’re going to want to look at are the log files. Not because you enjoy it — log files are not easy to decipher — but because they contain valuable information that can shed light on what exactly occurred.
当确实出现问题时,您首先要查看的是日志文件。 并不是因为您喜欢它-日志文件不容易破译-而是因为它们包含有价值的信息,这些信息可以阐明确切发生的情况。
In modern environments however, this task is a challenge. While WordPress admins might not ever need to hear the word “log”, the web developers and DevOps crews running the site will often need to go through lines after lines of log files to understand what went wrong.
但是,在现代环境中,此任务是一个挑战。 尽管WordPress管理员可能永远不需要听到“ log”一词,但运行该站点的Web开发人员和DevOps团队通常需要逐行查看日志文件,以了解问题所在。
“So, what’s new?” you might ask. After all, there are plenty of WordPress plugins such as WP Log Viewer that enable you to view these logs easily from the WordPress admin panel.
“那么,有什么新消息?” 你可能会问。 毕竟,有很多WordPress插件,例如WP Log Viewer,可让您从WordPress管理面板轻松查看这些日志。
While this is true, analyzing WordPress and PHP logs is simply not enough. There are also web server and database logs to sift through. To successfully query huge volumes of log messages coming in from various sources and identify correlations, a more solid solution is required.
确实如此,仅分析WordPress和PHP日志是远远不够的。 还有用于筛选的Web服务器和数据库日志。 为了成功查询来自各种来源的大量日志消息并识别相关性,需要一个更可靠的解决方案。
Enter the ELK Stack. The most popular and fastest-growing open source log analytics platform, ELK allows you to build a centralized logging system that can pull logs from as many sources as you define and then analyze and visualize this data.
输入ELK堆栈 。 ELK是最流行和增长最快的开源日志分析平台,它使您可以构建集中式日志记录系统,该系统可以从定义的任意数量的源中提取日志,然后对这些数据进行分析和可视化。
To show an example of using ELK, this article will go through the steps of establishing a pipeline of logs from your WordPress application into the Logz.io ELK Stack. You can, if you like, use any instance of the stack to perform the exact same procedures.
为了显示使用ELK的示例,本文将逐步建立从WordPress应用程序到Logz.io ELK Stack的日志管道的步骤。 如果愿意,可以使用堆栈的任何实例来执行完全相同的过程。
为WordPress应用启用日志记录 (Enabling Logging for WordPress Apps)
The first step is to configure WordPress to write logs. To do this we are going to enter some definitions in our wp-config file.
第一步是配置WordPress以写入日志。 为此,我们将在wp-config文件中输入一些定义。
First, we will change the WP_DEBUG value to true:
首先,我们将WP_DEBUG值更改为true :
define( 'WP_DEBUG', true );You’ll now start seeing PHP errors, notices and warnings, as well as WordPress debug messages, on your app’s pages.
现在,您将开始在应用程序页面上看到PHP错误,通知和警告以及WordPress调试消息。
Next, we will enable the WordPress logging feature:
接下来,我们将启用WordPress日志记录功能:
define( 'WP_DEBUG_LOG', true );This will save all of the error messages to a debug.log file located in the /wp-content/ directory of your app.
这会将所有错误消息保存到应用程序/wp-content/目录中的debug.log文件中。
If you don’t want the error messages to be displayed on your app’s pages, use WP_DEBUG_DISPLAY — this is another constant that allows you to control whether WP_DEBUG messages are shown inside the HTML of your site. To change the default behavior that displays the errors on-screen, change the value to false to hide all messages:
如果您不希望错误消息显示在应用程序的页面上,请使用WP_DEBUG_DISPLAY-这是另一个常量,它使您可以控制WP_DEBUG消息是否显示在网站HTML中。 要更改在屏幕上显示错误的默认行为,请将值更改为false以隐藏所有消息:
define( 'WP_DEBUG_DISPLAY', false );Another useful option is the SAVEQUERIES definition, which saves database queries to an array. You can then use this array to help analyze the issues:
另一个有用的选项是SAVEQUERIES定义,它将数据库查询保存到数组中。 然后,您可以使用此数组来帮助分析问题:
define( 'SAVEQUERIES', true );Each query will be saved along with information on how long the query took to execute, and the function that called it.
每个查询将与有关执行查询所需的时间以及调用该查询的函数的信息一起保存。
Save your configuration.
保存您的配置。
You’re all set! To verify the creation of the debug.log file, simulate an error (you can use the error_log() function) and then locate and open the file. If the file is not there, you have not triggered an error yet.
你们都准备好了! 要验证debug.log文件的创建,请模拟一个错误(可以使用error_log()函数),然后找到并打开该文件。 如果文件不存在,则您尚未触发错误。
Of course, using WP_DEBUG is not recommended in production, so be careful with how you use it and what definitions you are using (the SAVEQUERIES definition, for example, can slow down your site considerably).
当然,在生产中不建议使用WP_DEBUG,因此请谨慎使用它以及使用的定义(例如,SAVEQUERIES定义可能会大大降低您的站点速度)。
将日志运送到ELK (Shipping the Logs to ELK)
Now that we’ve enabled logging for our WordPress app, the next step is to take our new log file and ship it together with Apache logs to the ELK Stack for analysis. To do this, we will use Filebeat, a log shipper by Elastic that tails log files, and sends the traced data to Logstash or Elasticsearch.
现在我们已经为WordPress应用启用了日志记录,下一步是获取我们的新日志文件,并将其与Apache日志一起发送到ELK堆栈进行分析。 为此,我们将使用Filebeat,这是Elastic的日志传送器,尾随日志文件,并将跟踪的数据发送到Logstash或Elasticsearch。
安装Filebeat (Installing Filebeat)
I’m running Ubuntu 14.04, and I’m going to install Filebeat from the repository (if you’re using a different OS, here are additional installation instructions).
我正在运行Ubuntu 14.04 ,并且将从存储库中安装Filebeat(如果您使用的是其他操作系统,则这里是其他安装说明 )。
First, I’m going to download and install the Public Signing Key:
首先,我将下载并安装公共签名密钥:
curl https://packages.elasticsearch.org/GPG-KEY-elasticsearch | sudo apt-key add -Next, I’m going to save the repository definition to /etc/apt/sources.list.d/beats.list:
接下来,我将存储库定义保存到/etc/apt/sources.list.d/beats.list :
echo "deb https://packages.elastic.co/beats/apt stable main" | sudo tee -a /etc/apt/sources.list.d/beats.listFinally, I’m going to run apt-get update and install Filebeat:
最后,我将运行apt-get update并安装Filebeat:
sudo apt-get update && sudo apt-get install filebeatLogz.io uses TLS as an added security layer, so our next step before configuring the data pipeline is to download a certificate and move it to the correct location:
Logz.io使用TLS作为添加的安全层,因此在配置数据管道之前,我们的下一步是下载证书并将其移动到正确的位置:
wget http://raw.githubusercontent.com/cloudflare/cfssl_trust/master/intermediate_ca/COMODORSADomainValidationSecureServerCA.crt
sudo mkdir -p /etc/pki/tls/certs
sudo cp COMODORSADomainValidationSecureServerCA.crt /etc/pki/tls/certs/
配置文件拍 (Configuring Filebeat)
Our next step is to open the Filebeat configuration file at /etc/filebeat/filebeat.yml and configure Filebeat to track specific log files and output them to the Logz.io Logstash instance.
下一步是在/etc/filebeat/filebeat.yml中打开Filebeat配置文件, /etc/filebeat/filebeat.yml配置为跟踪特定的日志文件,并将其输出到Logz.io Logstash实例。
In the Prospectors section, we will define the files we want Filebeat to tail: in this case, our Apache log files (/var/log/apache2/*.log) as well as the WordPress debug file (/var/www/html/wordpress/wp-content/debug.log). If you’re using Nginx, alter accordingly.
在“探矿者”部分,我们将定义要Filebeat拖尾的文件:在这种情况下,我们的Apache日志文件( /var/log/apache2/*.log )以及WordPress调试文件( /var/www/html/wordpress/wp-content/debug.log )。 如果您使用的是Nginx,请进行相应的更改。
For each prospector we will define a log type (Apache, WP) — this helps to differentiate between the various log messages as they begin to pile up in our ELK system and will allow us to analyze them more easily.
对于每个探矿者,我们将定义一个日志类型(Apache,WP)-这有助于区分各种日志消息,因为它们开始堆积在我们的ELK系统中,并使我们可以更轻松地对其进行分析。
We will also add some additional Logz.io-specific fields (codec and user token) to each prospector.
我们还将为每个探矿者添加一些特定于Logz.io的其他字段(编解码器和用户令牌)。
The configuration looks as follows:
配置如下所示:
################### Filebeat Configuration Example #########################
############################# Filebeat #####################################
filebeat:
  # List of prospectors to fetch data.
  prospectors:
    # This is a text lines files harvesting definition
    -
     paths:
       - /var/www/html/wordpress/wp-content/debug.log
     fields:
       logzio_codec: plain
       token: tWMKrePSAcfaBSTPKLZeEXGCeiVMpuHb
     fields_under_root: true
     ignore_older: 24h
     document_type: WP
    -
    paths:
       - /var/log/apache2/*.log
    fields:
      logzio_codec: plain
      token: tWMKrePSAcfaBSTPKLZeEXGCeiVMpuHb
    fields_under_root: true
    ignore_older: 24h
    document_type: apache
    registry_file: /var/lib/filebeat/registry
Next, in the Output section of the configuration file, we will define the Logz.io Logstash host (listener.logz.io:5015) as the output destination for our logs, and the location of the TLS certificate used for authentication.
接下来,在配置文件的“输出”部分,我们将Logz.io Logstash主机( listener.logz.io:5015 )定义为日志的输出目标,并定义用于身份验证的TLS证书的位置。
############################# Output ########################################
# Configure what outputs to use when sending the data collected by the beat.
output:
  logstash:
    # The Logstash hosts
    hosts: ["listener.logz.io:5015"]
    tls:
      # List of root certificates for HTTPS server verifications
      Certificate_authorities: ['/etc/pki/tls/certs/COMODORSADomainValidationSecureServerCA.crt']
Now, if you are using the open source ELK stack, you can ship directly to Elasticsearch or use Logstash. The configuration for either of these outputs in this case is straightforward:
现在,如果您使用的是开源ELK堆栈,则可以直接运送到Elasticsearch或使用Logstash。 在这种情况下,这些输出之一的配置很简单:
Output:
  logstash:
    hosts: ["localhost:5044"]
  elasticsearch:
    hosts: ["localhost:9200"]
Save your Filebeat configuration.
保存您的Filebeat配置。
配置Logstash (Configuring Logstash)
Logstash, the component in the stack in charge of parsing the logs before forwarding them to Elasticsearch, can be configured to manipulate the data to make the logs more readable and easy to analyze.
Logstash是堆栈中负责在将日志转发到Elasticsearch之前对其进行解析的组件,可以将其配置为操纵数据以使日志更易读和易于分析。
In our case, we’re going to use the grok plugin to parse our WordPress logs. Now, if we’re using Logz.io, grokking is taken care of for us. But if you’re using the open source ELK, simply apply the following configuration directly to your Logstash configuration file (/etc/logstash/conf.d/xxxx.conf):
在我们的案例中,我们将使用grok插件来解析WordPress日志。 现在,如果我们使用的是Logz.io,则可以为我们打招呼。 但是,如果您使用的是开源ELK,只需将以下配置直接应用于Logstash配置文件( /etc/logstash/conf.d/xxxx.conf ):
if [type] == "WP" {
    grok {
        match => [
            "message", "\[%{MONTHDAY:day}-%{MONTH:month}-%{YEAR:year} %{TIME:time} %{WORD:zone}\] PHP %{DATA:level}\:  %{GREEDYDATA:error}"
            ]
    }
    mutate {
        add_field => [ "timestamp", "%{year}-%{month}-%{day} %{time}" ]
        remove_field => [ "zone", "month", "day", "time" ,"year"]
    }
    date {
        match => [ "timestamp" , "yyyy-MMM-dd HH:mm:ss" ]
        remove_field => [ "timestamp" ]
    }
  }
验证管道 (Verifying the Pipeline)
It’s time to make sure the log pipeline into ELK is working as expected.
现在是时候确保进入ELK的日志管道按预期工作。
First, make sure Filebeat is running:
首先,确保Filebeat正在运行:
cd /etc/init.d
./filebeat status
And if not, enter:
如果不是,请输入:
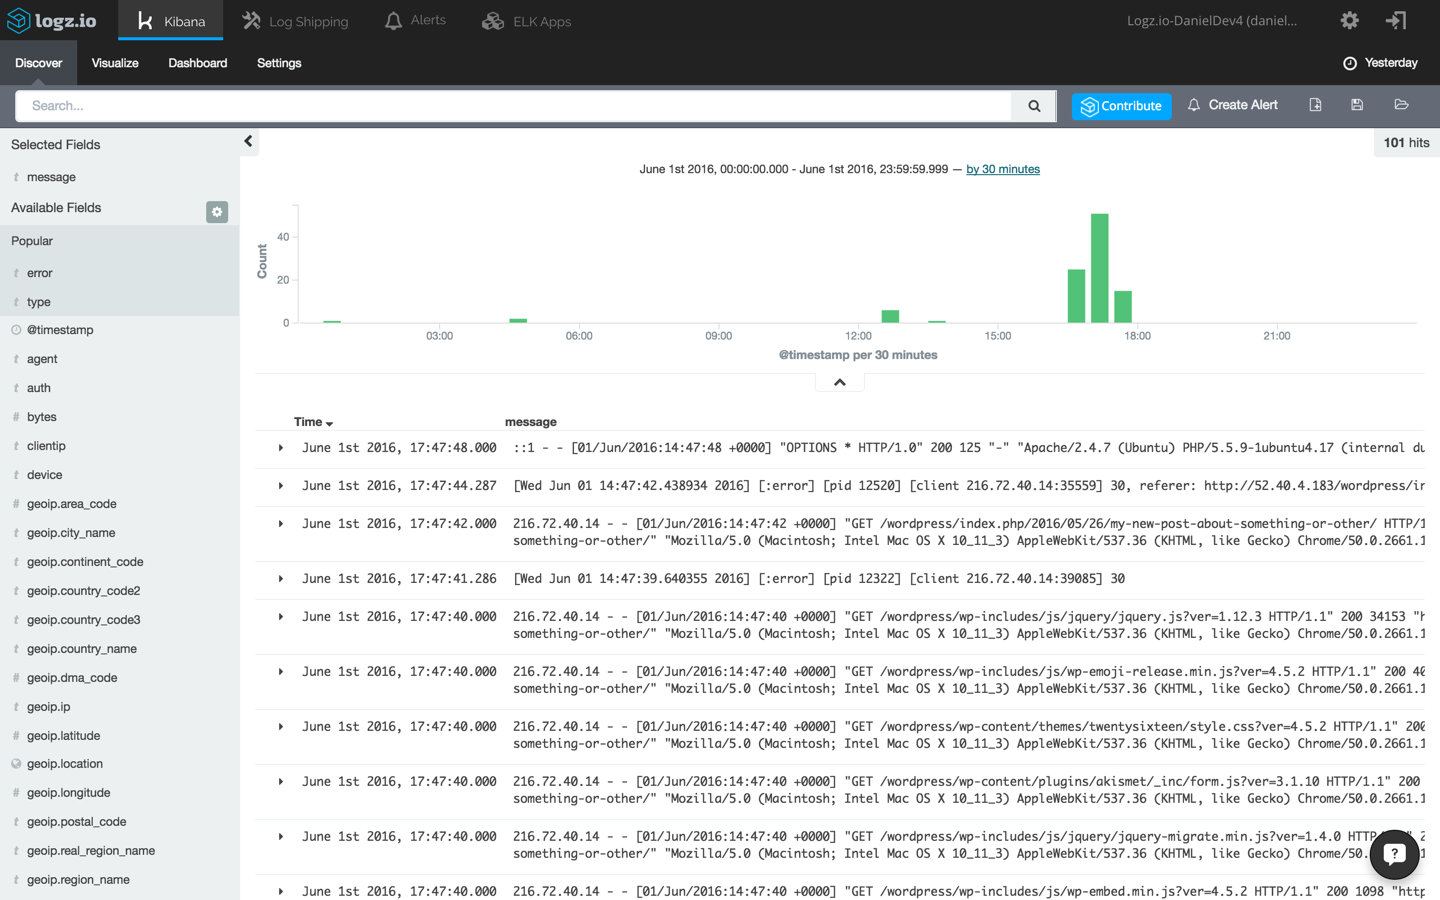
sudo ./filebeat startNext, open up Kibana (integrated into the Logz.io user interface). Apache logs and WordPress errors will begin to show up in the main display area.
接下来,打开Kibana(集成到Logz.io用户界面中)。 Apache日志和WordPress错误将开始显示在主显示区域中。
分析日志 (Analyzing the Logs)
ELK is designed for big data. As such, the platform allows you to sift through large volumes of messages being ingested by querying the storage component of the stack — Elasticsearch.
ELK专为大数据而设计。 这样,该平台允许您通过查询堆栈的存储组件Elasticsearch来筛选要吸收的大量消息。
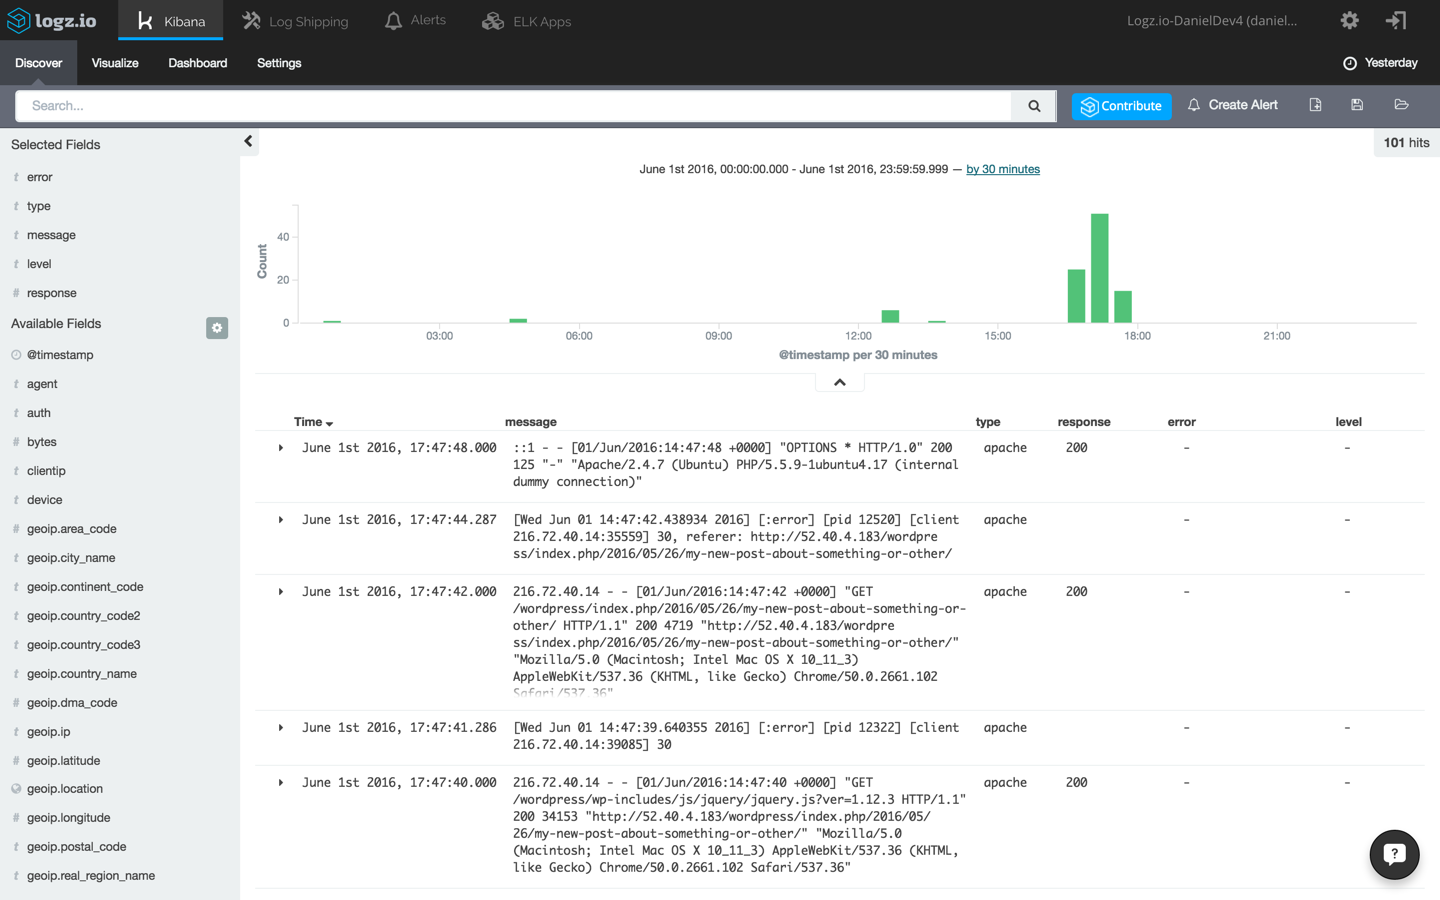
To start making sense of the data, select one of the messages in the main display area — this will give you an idea on what information is available. Remember the different type we defined for the Filebeat prospectors? To make this list of messages more understandable, select the type, response, level and error fields from the list of mapped fields on the left.
要开始理解数据,请在主显示区域中选择一条消息-这将使您了解可用的信息。 还记得我们为Filebeat探矿者定义的不同类型吗? 为了使此消息列表更易于理解,请从左侧的映射字段列表中选择type , response , level和error字段。
Now, say you’d like to filter the results to only see messages coming in from the WordPress debug.log file. There are a number of ways to do this, the easiest being entering the following field-level query in the Kibana query field at the top of the page:
现在,假设您想过滤结果以仅查看来自WordPress debug.log文件的消息。 有多种方法可以执行此操作,最简单的方法是在页面顶部的Kibana查询字段中输入以下字段级查询:
type:WP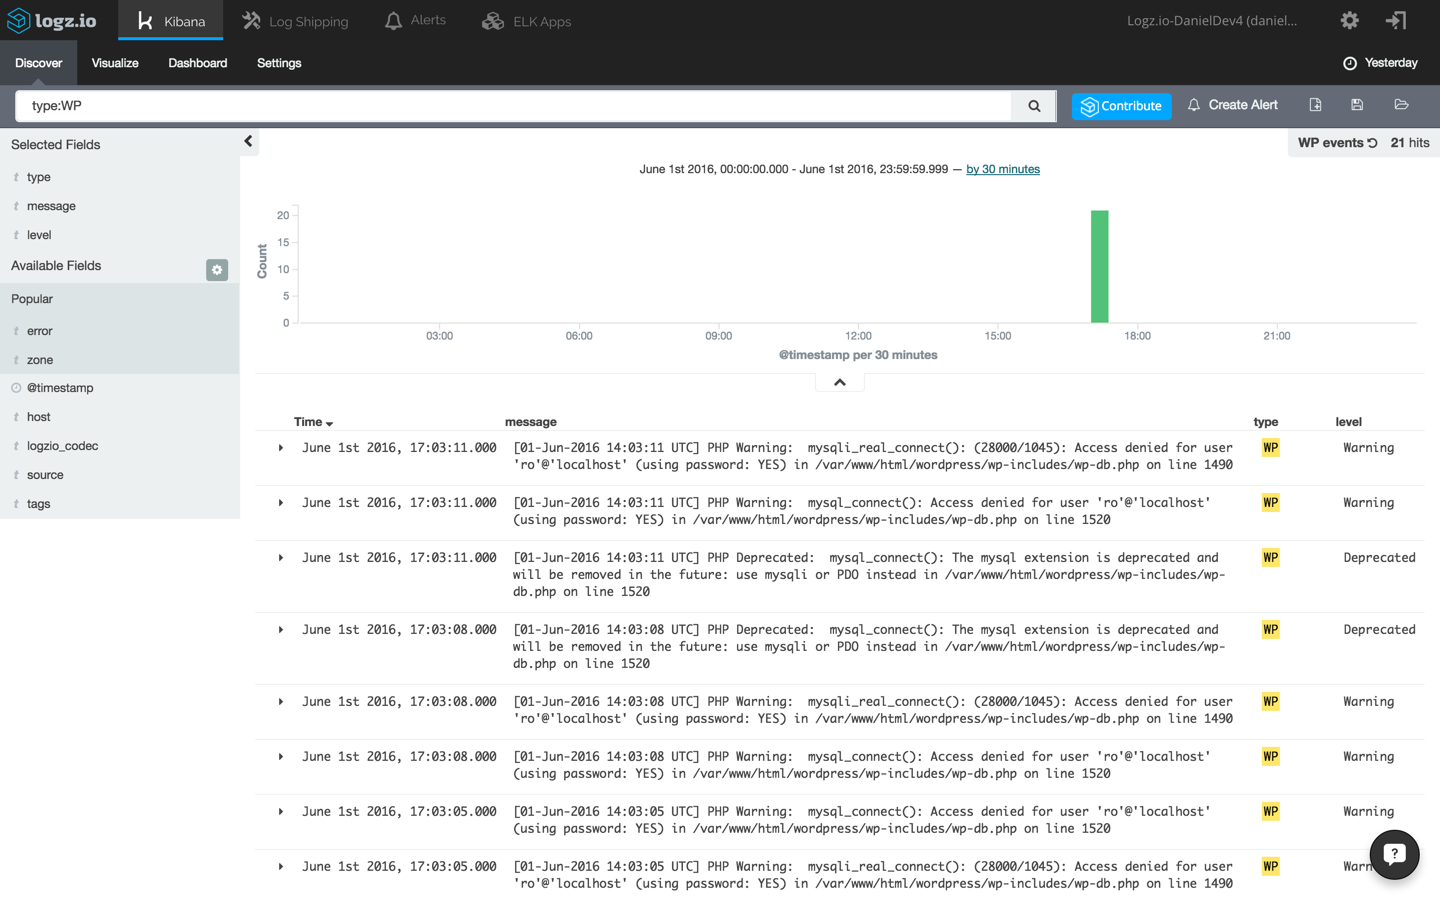
Again, open one of the messages and view the information that has been shipped into the system. Here’s an example of a database error logged by PHP into the debug.log file and forwarded into the ELK Stack:
再次,打开消息之一,并查看已传送到系统中的信息。 这是一个由PHP登录到debug.log文件并转发到ELK堆栈的数据库错误的示例:
[01-Jun-2016 14:03:11 UTC] PHP Warning: mysqli_real_connect(): (28000/1045): Access denied for user 'ro'@'localhost' (using password: YES) in /var/www/html/wordpress/wp-includes/wp-db.php on line 1490
[01-Jun-2016 14:03:11 UTC] PHP Warning: mysqli_real_connect(): (28000/1045): Access denied for user 'ro'@'localhost' (using password: YES) in /var/www/html/wordpress/wp-includes/wp-db.php on line 1490
Save the search. We will use it to create a visualization in the next step.
保存搜索。 下一步,我们将使用它来创建可视化。
可视化日志 (Visualizing the Logs)
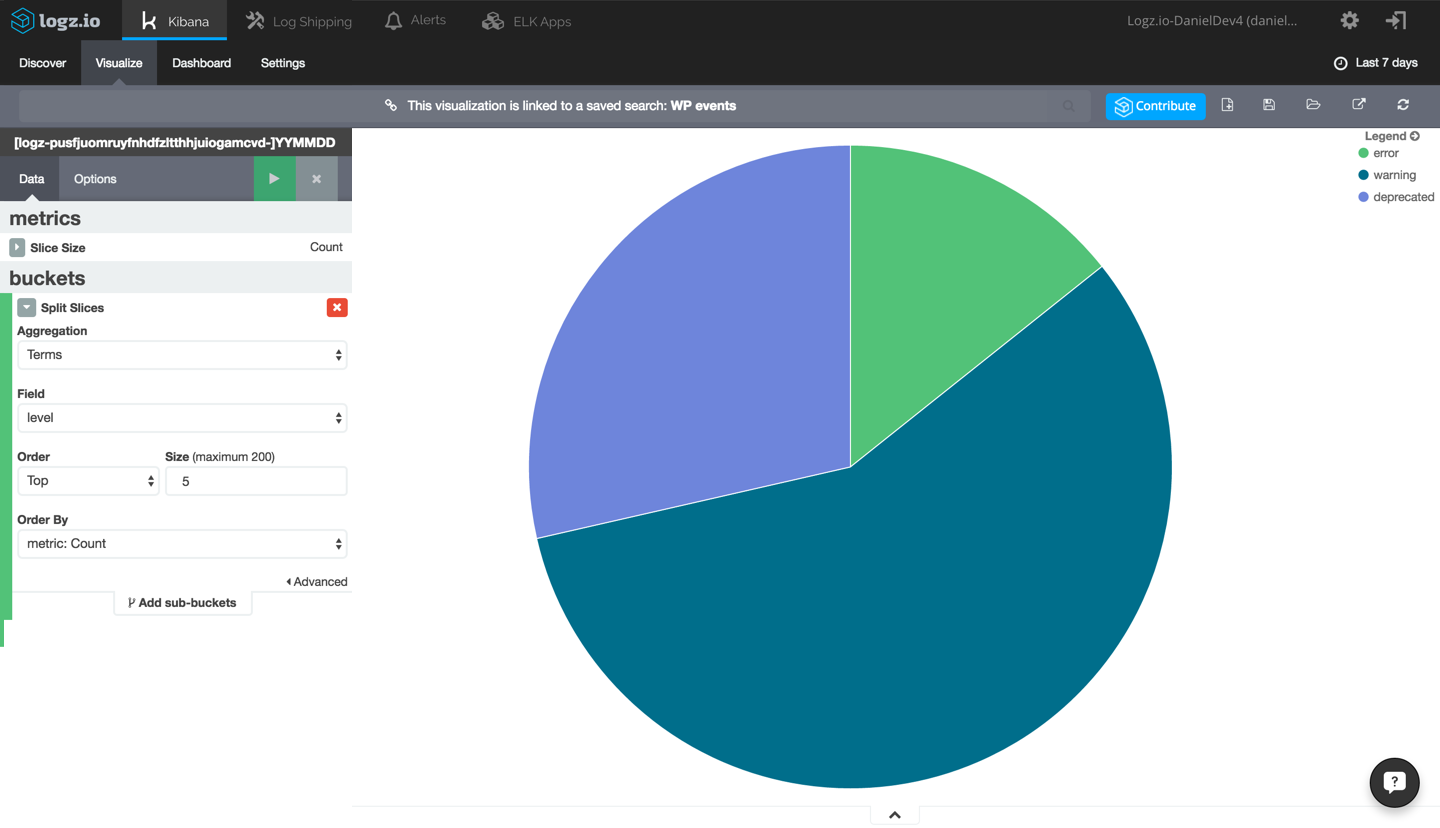
Our next step is to try and create a graphic depiction of the data by creating a new Kibana visualization. As an example, we’re going to create a piechart giving us a breakdown of the different PHP and WordPress errors logged.
我们的下一步是尝试通过创建新的Kibana可视化文件来创建数据的图形表示。 例如,我们将创建一个饼图,为我们提供记录的不同PHP和WordPress错误的细分。
Select the Visualize tab in Kibana, and from the selection of available visualizations, select the Pie Chart visualization type.
选择Kibana中的“可视化”选项卡,然后从可用的可视化中选择“饼图”可视化类型。
Next, select to create the visualization based on our saved search above, and configure it as follows:
接下来,选择以根据上面保存的搜索创建可视化,并按如下所示进行配置:
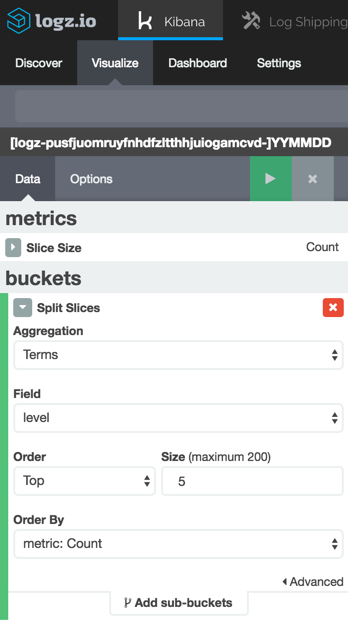
We’re using a simple term aggregation using the level field to show a count for the top 5 error types. Hit the green Play button to see a preview of the visualization:
我们正在使用一个简单的术语聚合,其中使用level字段来显示前5种错误类型的计数。 点击绿色的“播放”按钮以查看可视化效果的预览:
This is a simple example of how your WordPress log data can be visualized in Kibana. The same applies to your Apache logs and any other data source you configure to integrate with ELK, and once you have a series of visualizations for monitoring your WordPress app, you can add them up to create a dashboard giving you a general overview of your environment.
这是如何在Kibana中可视化WordPress日志数据的简单示例。 这同样适用于您的Apache日志以及您配置为与ELK集成的任何其他数据源,一旦有了一系列用于监视WordPress应用程序的可视化效果,您就可以将它们添加起来以创建仪表板,从而为您提供环境的总体概览。
编写自定义日志 (Writing Custom Logs)
Another option is to write your own logs to the log file.
另一种选择是将自己的日志写入日志文件。
Log-driven development (LDD) is a development methodology incorporated into the DevOps culture that is based on developers writing and monitoring logs as an integral part of their development process.
日志驱动开发 (LDD)是一种集成到DevOps文化中的开发方法,该方法基于开发人员在其开发过程中编写和监视日志的过程。
Using the error_log() function, you can write custom messages into the WordPress log file for future ingestion into ELK. Examples of using this function could be for monitoring when a certain line of code is read or even when a specific page is visited.
使用error_log()函数,您可以将自定义消息写入WordPress日志文件,以供将来提取到ELK中。 使用此功能的示例可能是监视何时读取特定的代码行,或者甚至何时访问特定的页面。
最后说明 (Final Note)
Being able to centralize the logging of all the components and services your app relies on is key to keeping tabs on your environment, especially if your app is running on a cloud infrastructure in which multiple services are running behind a hidden veil.
能够集中记录您的应用程序所依赖的所有组件和服务的日志,这是保持环境标签的关键,尤其是当您的应用程序运行在云基础架构上,其中多个服务在一个隐藏的面纱下运行时。
While WordPress supports various logging plugins, none offer the ability to correlate logs with additional data sources such as the web server, database, or load balancer. Centralized logging with ELK allows you to do just that — together with the ability to analyze the data and create monitoring dashboards to help you visualize it.
虽然WordPress支持各种日志记录插件,但没有一个提供将日志与其他数据源(例如Web服务器,数据库或负载平衡器)关联的功能。 使用ELK进行集中式日志记录,您可以做到这一点,同时还具有分析数据和创建监视仪表板以帮助您可视化的功能。
翻译自: https://www.sitepoint.com/monitoring-wordpress-apps-with-the-elk-stack/
web应用监控 elk


 2492
2492

 被折叠的 条评论
为什么被折叠?
被折叠的 条评论
为什么被折叠?
 到【灌水乐园】发言


