


python中错误调试
This article was originally published on Sentry. Thank you for supporting the partners who make SitePoint possible.
本文最初发表在Sentry上 。 感谢您支持使SitePoint成为可能的合作伙伴。
One of Sentry’s more powerful features comes with languages like Python. In Python, PHP, and the JVM, we’re able to introspect more deeply into the runtime and give you additional data about each frame in your call stack. At a high level, this lets you know things like calling arguments to your functions, allowing you to more easily reproduce and understand an error. Let’s dive into what this looks like, and how it works under the hood.
Sentry最强大的功能之一是Python之类的语言。 在Python,PHP和JVM中,我们能够对运行时进行更深入的反思,并为您提供有关调用堆栈中每个帧的其他数据。 从高层次上讲,这使您知道诸如调用函数的参数之类的知识,从而使您可以更轻松地重现和理解错误。 让我们深入研究一下它的外观,以及它的工作原理。
We’ll start with what a Python error might typically look like in your terminal, or in a standard logging system:
我们将从您的终端或标准记录系统中通常出现的Python错误开始:
TypeError: expected string or buffer
  File "sentry/stacktraces.py", line 309, in process_single_stacktrace
    processable_frame, processing_task)
  File "sentry/lang/native/plugin.py", line 196, in process_frame
    in_app = (in_app and not self.sym.is_internal_function(raw_frame.get('function')))
  File "sentry/lang/native/symbolizer.py", line 278, in is_internal_function
    return _internal_function_re.search(function) is not None
While this gives us an idea of the type and location of the error, it unfortunately doesn’t help us understand what is truly causing it. It’s possible that it’s passing an integer or a NoneType, but, realistically, it could be any number of things. Guessing at it will only get us so far, and we really need to know what function actually is.
尽管这使我们对错误的类型和位置有了一个了解,但不幸的是,它并没有帮助我们了解真正导致错误的原因。 可能传递整数或NoneType,但是实际上,它可以是任意数量的东西。 猜测它只会使我们走到这一步,我们确实需要知道实际上是什么function 。
An easy and often very accessible option to do this would be to add some logging. There’s a few different entry points where we could put logging, which makes it easier to implement. It also lets us ensure we specifically get the answer we want. For example, we want to figure out what the type of function is:
一个简单且通常非常易于访问的选项是添加一些日志记录。 我们可以在几个不同的入口点放置日志记录,这使得实现起来更加容易。 这也使我们可以确保我们能具体得到所需的答案。 例如,我们要弄清楚function的type是什么:
import logging
# ...
logging.debug("function is of type %s", type(function))
Another benefit of logging like this is that it could carry over to production. The consequence is generally you’re not recording DEBUG level log statements in production as the volume can be significant and not very useful. It also often requires you to plan ahead to ensure you’re logging the various failure cases that could happen and the appropriate context with each.
这样的日志记录的另一个好处是它可以延续到生产中。 结果是,通常您不会在生产中记录DEBUG级别的日志语句,因为该卷可能很重要而且不是很有用。 它还经常需要您提前计划,以确保记录下可能发生的各种故障情况以及每种情况下的适当环境。
For the sake of this tutorial, let’s assume we can’t do this in production, didn’t plan ahead for it, and, instead, are trying to debug and reproduce this in development.
为了本教程的缘故,让我们假设我们不能在生产中做到这一点,没有为它做任何提前计划,而是尝试在开发中调试和重现它。
Python调试器 (The Python Debugger)
The Python Debugger (PDB) is a tool that allows you to step through your callstack using breakpoints. The tool itself is inspired by GNU’s Debugger (GDB) and, while powerful, often can be overwhelming if you’re not familiar with it. It’s definitely an experience that will get easier with repetition, and we’re only going to go into a few high level concepts with it for our example.
Python调试器 (PDB)是一种工具,可让您使用断点逐步完成调用堆栈。 该工具本身受GNU调试器(GDB)的启发,虽然功能强大,但如果您不熟悉它,通常可能会感到不知所措。 绝对可以通过重复操作来简化这种体验,在我们的示例中,我们将只涉及一些高级概念。
So the first thing we’d want to do is instrument our code to add a breakpoint. In our example above, we could actually instrument symbolizer.py ourselves. That’s not always the case, as sometimes the exception happens in third party code. No matter where you instrument it, you’ll still be able to jump up and down the stack. Let’s start by changing that code:
因此,我们要做的第一件事是检测代码以添加断点。 在上面的示例中,我们实际上可以自己对symbolizer.py 。 并非总是如此,因为有时例外发生在第三方代码中。 无论您在何处进行检测,您仍然可以在堆栈中上下移动。 让我们从更改代码开始:
def is_internal_function(self, function):
    # add a breakpoint for PDB
    try:
        return _internal_function_re.search(function) is not None
    except Exception:
        import pdb; pdb.set_trace()
        raise
We’re limiting this to the exception, as it’s common you’ll have code that runs successfully most of the time, sometimes in a loop, and you wouldn’t want to pause execution on every single iteration.
我们将其限制为例外,因为通常会在大多数时间成功运行代码,有时会在一个循环中运行,并且您不想在每次迭代中都暂停执行。
Once we’ve hit this breakpoint (which is what set_trace() is registering), we’ll be dropped into a special shell-like environment:
一旦达到此断点( set_trace()正在注册的断点),我们将进入一个特殊的类似于shell的环境:
# ...
(Pdb)
This is the PDB console, and it works similar to the Python shell. In addition to being able to run most Python code, we’re also executing under a specific context within our call stack. That location is the entry point. Rather, it’s where you called set_trace(). In the above example, we’re right where we need to be, so we can easily grab the type of function:
这是PDB控制台,其工作方式类似于Python Shell。 除了能够运行大多数Python代码之外,我们还在调用堆栈内的特定上下文下执行。 该位置是入口点。 而是在这里调用set_trace() 。 在上面的示例中,我们就在正确的位置,因此我们可以轻松掌握function的类型:
(Pdb) type(function)
<type 'NoneType'>
Of course, we could also simply grab all locally scoped variables using one of Python’s builtins:
当然,我们也可以使用Python的内置函数之一简单地获取所有局部范围的变量:
(Pdb) locals()
{..., 'function': None, ...}
In some cases we may have to navigate up and down the stack to get to the frame where the function is executing. For example, if our set_trace() instrumentation had dropped us higher up in the stack, potentially at the top frame, we would use down to jump into the inner frames until we hit a location that had the information needed:
在某些情况下,我们可能不得不导航up和down堆去的地步,该函数执行框架。 例如,如果我们的set_trace()工具使我们在堆栈中位于较高的位置(可能位于顶部框架),则我们将down使用以跳入内部框架,直到找到具有所需信息的位置:
(Pdb) down
-> in_app = (in_app and not self.sym.is_internal_function(raw_frame.get('function')))
(Pdb) down
-> return _internal_function_re.search(function) is not None
(Pdb) type(function)
<type 'NoneType'>
So we’ve identified the problem: function is a NoneType. While that doesn’t really tell us why it’s that way, it at least gives us valuable information to speed up our test cases.
因此,我们确定了问题所在: function是一个NoneType 。 虽然这并不能真正告诉我们这样做的原因,但至少可以为我们提供宝贵的信息,以加快测试案例的速度。
生产调试 (Debugging in Production)
So PDB works great in development, but what about production? Let’s look a bit more deeply at what Python gives us to answer that question.
因此,PDB在开发中表现出色,但是生产呢? 让我们更深入地看一下Python给我们提供了什么来回答这个问题。
The great thing about the CPython runtime — that’s the standard runtime most people use — is it allows easy access to the current call stack. While some other runtimes (like PyPy) will provide similar information, it’s not guaranteed. When you hit an exception the stack is exposed via sys.exc_info(). Let’s look at what that gives us for a typical exception:
CPython运行时的妙处在于-它是大多数人使用的标准运行时-允许轻松访问当前调用堆栈。 尽管其他一些运行时(例如PyPy)将提供类似的信息,但不能保证。 当您遇到异常时,堆栈将通过sys.exc_info()公开。 让我们看一下典型例外的原因:
>>> try:
...   1 / 0
... except:
...   import sys; sys.exc_info()
...
(<type 'exceptions.ZeroDivisionError'>,
    ZeroDivisionError('integer division or modulo by zero',),
    <traceback object at 0x105da1a28>)
We’re going to avoid going too deep into this, but we’ve got a tuple of three pieces of information: the class of the exception, the actual instance of the exception, and a traceback object. The bit we care about here is the traceback object. Of note, you can also grab this information outside of exceptions using the traceback module. There’s some documentation on using these structures, but let’s just dive in ourselves to try and understand them. Within the traceback object we’ve got a bunch of information available to us, though it’s going to take a bit of work — and magic — to access:
我们将避免对此进行太深的了解,但是我们得到了由三部分组成的元组:异常的类,异常的实际实例和回溯对象。 我们在这里关心的是追溯对象。 值得注意的是,您还可以使用追溯模块在异常之外获取此信息。 有一些有关使用这些结构的文档 ,但让我们自己深入尝试并理解它们。 在回溯对象中,我们可以获取大量信息,尽管要访问它需要花费一些工作和魔术:
>>> exc_type, exc_value, tb = exc_info
>>> tb.tb_frame
<frame object at 0x105dc0e10>
Once we’ve got a frame, CPython exposes ways to get stack locals — that is all scoped variables to that executing frame. For example, look at the following code:
有了框架后,CPython将提供获取堆栈局部变量的方法-这是该执行框架的所有作用域变量。 例如,看下面的代码:
def foo(bar=None):
    foo = "bar"
    1 / 0
Let’s generate an exception with that code:
让我们用该代码生成一个异常:
try:
    foo()
except:
    exc_type, exc_value, tb = sys.exc_info()
And finally, let’s access the locals via f_locals on the <frame> object:
最后,让我们通过<frame>对象上的f_locals访问本地人:
>>> from pprint import pprint
>>> pprint(tb.tb_frame.f_locals)
{'__builtins__': <module '__builtin__' (built-in)>,
    '__doc__': None,
    '__name__': '__main__',
    '__package__': None,
    'exc_info': (<type 'exceptions.ZeroDivisionError'>,
                ZeroDivisionError('integer division or modulo by zero',),
                <traceback object at 0x105cd4fc8>),
    'foo': <function foo at 0x105cf50c8>,
    'history': '/Users/dcramer/.pythonhist',
    'os': <module 'os' from 'lib/python2.7/os.py'>,
    'pprint': <function pprint at 0x105cf52a8>,
    'print_function': _Feature((2, 6, 0, 'alpha', 2), (3, 0, 0, 'alpha', 0), 65536),
    'readline': <module 'readline' from 'lib/python2.7/lib-dynload/readline.so'>,
    'stack': [],
    'sys': <module 'sys' (built-in)>,
    'tb': <traceback object at 0x105da1a28>,
    'tb_next': None,
    'write_history': <function write_history at 0x105cf2c80>}
What we see above isn’t actually that useful. The reason being is that we’re one level up in our scope, so we’re seeing foo defined, but nothing actually relevant to the function call itself. This won’t always be true, but in our trivial example it is. To find the information we’re looking for, we’ll need to go one level deeper:
我们上面看到的实际上并不那么有用。 原因是我们是我们范围的上一级,因此我们看到定义了foo ,但实际上与函数调用本身没有任何关系。 并非总是如此,但在我们的琐碎示例中,情况确实如此。 为了找到我们想要的信息,我们需要更深一层:
>>> inner_frame = tb.tb_next.tb_frame
>>> pprint(inner_frame.f_locals)
{'bar': None, 'foo': 'bar'}
You can quickly understand how this might be useful when we go back to our original TypeError. In that case, with the above introspection, we find out that function, which is expected to be a string, is actually set to a NoneType. We know that because Sentry has captured this error for us, and automatically extracts stack locals for every frame:
当我们回到原始的TypeError时,您可以快速理解这可能有用。 在这种情况下,通过上述自省,我们发现该function (实际上是一个字符串)实际上设置为NoneType 。 我们知道这是因为Sentry为我们捕获了此错误,并自动为每个帧提取了堆栈本地变量:
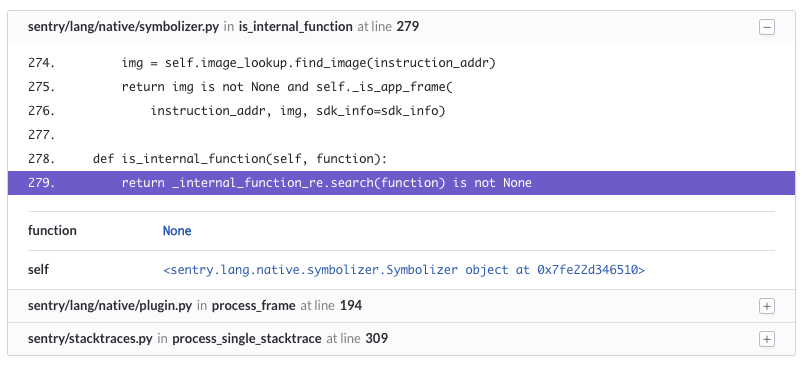
This was one of the first features we built in Sentry and, to this day, it remains as one of the most valuable debugging components we can provide. While we’re not able to always give you the details needed to reproduce an exception, in our experience it’s very rare that we actually need to manually instrument something to understand the context and, ultimately, resolve the issue.
这是我们在Sentry中构建的首批功能之一,到目前为止,它仍然是我们可以提供的最有价值的调试组件之一。 虽然我们无法始终为您提供重现异常所需的详细信息,但根据我们的经验,我们实际上很少需要手动进行操作以了解上下文并最终解决问题。
If you’re curious about the full implementation, which also utilizes other various components form Python’s traceback structure, you can always take a look at our Python SDK’s source code on GitHub. In PHP and the JVM, the approach is slightly different due to the runtimes and, if you’re interested, you’ll also find those repositories on Sentry’s GitHub. If you’re using Sentry, we’ll generally automatically instrument things for you, though the JVM requires a little bit of configuration (docs coming soon).
如果您对完整的实现感到好奇,该实现还利用了Python的回溯结构中的其他各种组件,则可以随时在GitHub上查看我们的Python SDK的源代码 。 在PHP和JVM中,由于运行时的原因,该方法略有不同,并且,如果您感兴趣,还可以在Sentry的GitHub上找到这些存储库。 如果您使用的是Sentry,尽管JVM需要一些配置(文档即将发布),我们通常会自动为您检测事物。
python中错误调试


 被折叠的 条评论
为什么被折叠?
被折叠的 条评论
为什么被折叠?
 到【灌水乐园】发言


