
Microsoft PowerPoint provides built-in tools for creating and arranging different types of flowcharts. Here’s how they work.
Microsoft PowerPoint提供了用于创建和安排不同类型的流程图的内置工具。 这是他们的工作方式。
在PowerPoint中制作流程图 (Making a Flowchart in PowerPoint)
Since you’re going to be working with shapes, you might find it helpful to have PowerPoint show a grid you can use to size and line up objects.
由于您将要使用形状,因此让PowerPoint显示可用于调整大小和排列对象的网格可能会有所帮助。
To show the grid, check the box next to “Gridlines” in the “Show” section of the “View” tab.
要显示网格,请在“视图”选项卡的“显示”部分中选中“网格线”旁边的框。
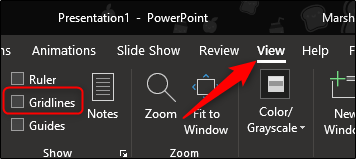
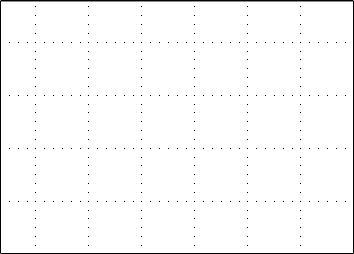
Gridlines will now appear on your slides.
现在,网格线将出现在您的幻灯片上。
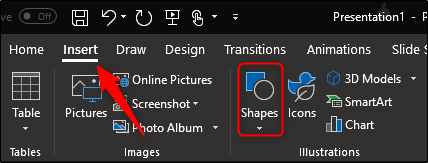
Next, select “Shapes” in the “Illustrations” section of the “Insert” tab.
接下来,在“插入”选项卡的“插图”部分中选择“形状”。
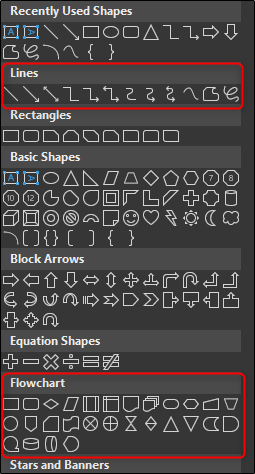
This will bring down a menu with many different shapes to choose from. We will primarily be focusing on the shapes in the “Flowchart” section near the bottom and the connectors in the “Lines” group near the top.
这将调出具有许多不同形状的菜单。 我们将主要关注底部附近的“流程图”部分中的形状以及顶部附近的“线”组中的连接器。
Before we continue, it’s important to understand the intended purpose of the shapes. You may want to consider reading this comprehensive list that details the meaning of flowchart shapes, but here’s a quick overview of the basics:
在继续之前,重要的是要了解形状的预期目的。 您可能需要考虑阅读这份详尽的清单,其中详细列出了流程图形状的含义 ,但这是对基础知识的快速概述:
Rectangle: This shape is used for process steps.
矩形:此形状用于处理步骤。
Diamond: The diamond is used to show decision points.
钻石:钻石用于显示决策点。
Oval: The oval is used as the terminator shape, indicating start and end points of a process.
椭圆:椭圆用作终止符形状,指示过程的起点和终点。
Additionally, you can hover over the shape to see an information box stating the shape’s purpose.
此外,您可以将鼠标悬停在形状上,以查看一个说明形状用途的信息框。
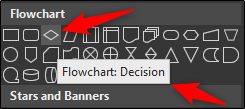
Let’s go ahead and insert our first shape. Back at the shapes menu, select the shape you’d like to insert in the flowchart. Since this is our first shape to insert in the flowchart, we’ll use the oval shape to indicate the starting point.
让我们继续并插入我们的第一个形状。 返回形状菜单,选择要在流程图中插入的形状。 由于这是我们要在流程图中插入的第一个形状,因此我们将使用椭圆形指示起点。

Once you select the shape, you’ll notice your mouse turns into a crosshair. To draw your shape, just click and drag.
选择形状后,您会注意到鼠标变成了十字准线。 要绘制形状,只需单击并拖动。
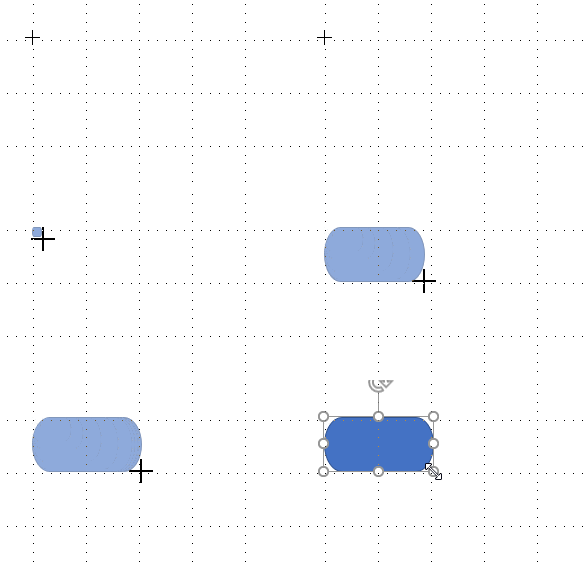
Afterward, you’ll notice a new “Format” tab appears where you can format your shape, the outline, color, and more.
之后,您会注意到一个新的“格式”选项卡出现,您可以在其中格式化形状,轮廓,颜色等。

To insert text inside the shape, click the shape and start typing.
要在形状内插入文本,请单击形状并开始输入。
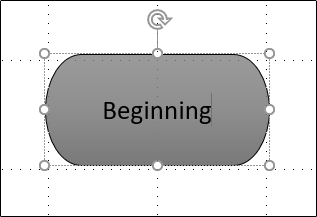
Let’s insert another shape and then connect the two shapes. We’ll insert a rectangle to indicate another part of the process. Repeat the above steps to insert the shape.
让我们插入另一个形状,然后将两个形状连接起来。 我们将插入一个矩形以指示过程的另一部分。 重复上述步骤以插入形状。
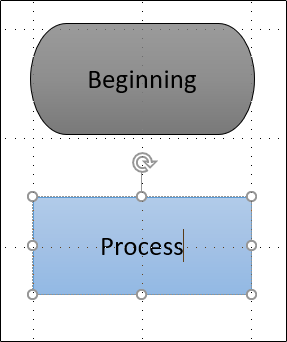
To connect the two shapes, head back to the shape menu, and select the connector you would like to use. We’ll use a simple line arrow for this example.
要连接两个形状,请返回形状菜单,然后选择要使用的连接器。 在此示例中,我们将使用简单的箭头。
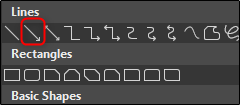
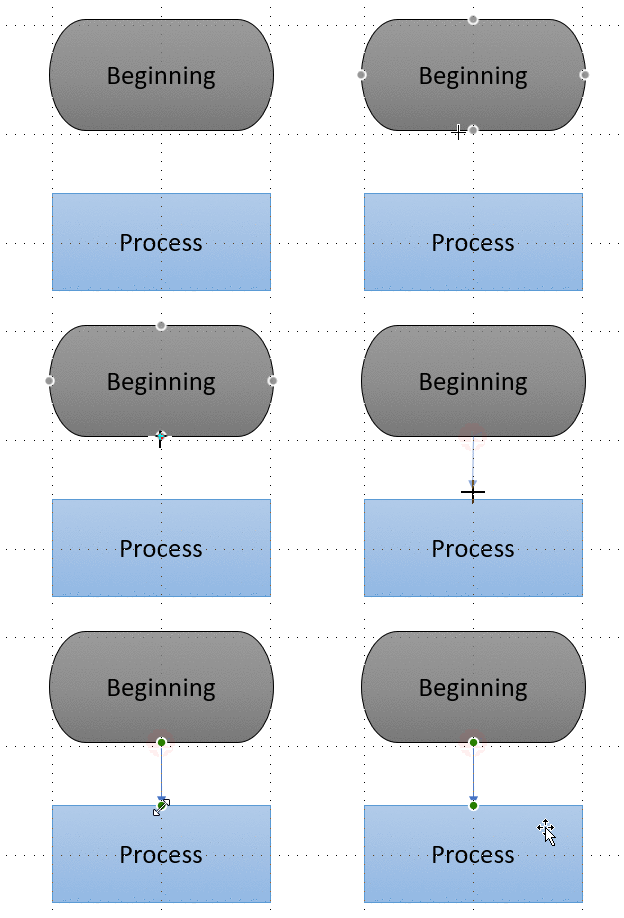
Once you select the arrow, click the center handle on the first shape and then, while still holding down your mouse button, drag to the center handle on the next shape.
选择箭头后,单击第一个形状的中心手柄,然后在按住鼠标键的同时拖动到下一个形状的中心手柄。
Like the other shapes, you can also format the arrow with different line widths, colors, and so on.
与其他形状一样,您也可以使用不同的线宽,颜色等设置箭头的格式。

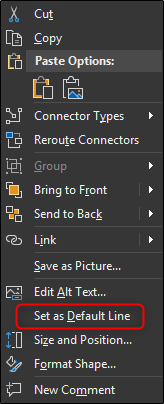
As a tip, if you plan on using the same line format for the entirety of the flowchart, right-click the line after you’ve formatted it and select “Set as Default Line.” You may also do this for any shapes you insert, as well.
提示:如果计划在整个流程图中使用相同的行格式,请在格式化后右键单击该行,然后选择“设置为默认行”。 您也可以对插入的任何形状执行此操作。
The beauty of using the connector arrows is that they become tied to the handles on the shapes. When you move the shapes around on your slide, the arrows adjust accordingly.
使用连接器箭头的好处在于,它们与形状上的手柄绑定在一起。 当您在幻灯片上移动形状时,箭头会相应调整。
翻译自: https://www.howtogeek.com/399626/how-to-make-a-flowchart-in-powerpoint/


 被折叠的 条评论
为什么被折叠?


