


 本文介绍了SNMP(简单网络管理协议)的基础知识,包括如何配置设备,读取和绘制OID信息,以及如何利用SNMP工具监视网络设备。文章列举了Solarwinds的“带宽监视器”、Plixer的“Flowalyzer”和SNMP4tPC的GetIF等工具,并提供了在不同设备(如DD-WRT、Fortigate、Juniper、NetAPP和Windows)上启用SNMP的步骤。

dsp怪胎

Have you ever needed to know what a remote device thinks the value of a metric is? HTG explains what the Simple Network Management Protocol (SNMP) is and how can you use it to monitor network devices.
您是否曾经需要知道远程设备认为度量标准的价值是什么? HTG解释了什么是简单网络管理协议(SNMP),以及如何使用它来监视网络设备。
Image by istargazer
图片由istargazer
总览 (Overview)
The Simple Network Management protocol (SNMP) was created to give a common protocol foundation that network administrators can expect their device’s manufacturers will use to expose different aspects of the product. Information such as CPU load, routing tables, and network traffic statistics, among many others, can all be accessed remotely with SNMP. One can also use SNMP to set configurations on devices that support it, but that is beyond the scope of this guide.
创建简单网络管理协议(SNMP)的目的是为通用协议奠定基础,网络管理员可以期望其设备的制造商使用它们来暴露产品的不同方面。 诸如CPU负载,路由表和网络流量统计之类的信息都可以通过SNMP进行远程访问。 也可以使用SNMP在支持它的设备上设置配置,但这超出了本指南的范围。
The read in/out from SNMP is done using a “Community” string. As the administrator, it is your job to set this string. Some examples on how to do this follow below.
SNMP的读/写使用“ Community ”字符串完成。 作为管理员,设置此字符串是您的工作。 下面是一些有关如何执行此操作的示例。
Once connected to the device, you need to “pull” it for information using OIDs. Different OIDs give different pieces of information, and while in this guide we will be focusing on network traffic, you are encouraged to explore this world further. We will explain how to get the “mysterious” OIDs below.
连接到设备后,您需要使用OID将其“拉出”以获取信息。 不同的OID提供不同的信息,尽管在本指南中我们将重点关注网络流量,但建议您进一步探索这个世界。 我们将在下面说明如何获取“神秘的” OID。
作者的闲逛 (Author’s ramblings)
I’ve started using this nifty way of viewing the router’s info, way back in the first days of my DD-WRT studies. Nowadays, if i don’t have it? I just feel blind. I simply cannot stress how valuable it is, when a user complains about the network speed, to be able to glance over what the border router says is the utilization and quickly resolve the issue.
在DD-WRT研究的第一天,我就开始使用这种漂亮的方式来查看路由器的信息。 如今,如果我没有它? 我只是感到盲目。 当用户抱怨网络速度时,我无法强调边界路由器所说的利用率并Swift解决问题,这是多么有价值。
读取/绘制SNMP信息(OID) (Reading/graphing SNMP information (OIDs))
For instant gratification’s sake, the how to read the SNMP information is placed first in the article, as most people won’t need the configuration part over and over…
出于即时满足的考虑,本文首先介绍了如何读取SNMP信息,因为大多数人不会一遍又一遍地需要配置部分…
Alright, so you’ve configured the device for SNMP (if not, see some example how tos below), but how do you know what OIDs to read, and for that matter, how do you actually do it? There are numerous commercial and free programs to achieve this exact goal. We will focus on a couple of free ones you can use hassle free for graphing or browsing the entire OIDs name space.
好了,因此您已经为设备配置了SNMP(如果没有,请参见下面的示例,说明如何操作),但是如何知道要读取的OID,以及如何实际执行此操作? 有许多商业和免费程序可以实现此确切目标。 我们将重点介绍几个免费的工具,您可以使用它们轻松地绘制或浏览整个OID名称空间。
“Bandwith Monitor” from Solarwinds (Graphing)
Solarwinds的 “带显示器” (图形)
One can’t really talk about “network monitoring” without running into Solarwinds, as its one of the major players in this field. We will not go into the plethora of networking products Solarwinds offers, but rather focus on a free utility called “FREE Real-Time Bandwidth Monitor“.
作为该领域的主要参与者之一,如果不碰到Solarwinds ,就无法真正谈论“网络监控”。 我们不会讨论Solarwinds提供的过多网络产品,而是专注于名为“ FREE Real-Time Bandwidth Monitor ”的免费实用程序。
This utility has two drawbacks:
该实用程序有两个缺点:
- It is aimed to show network bandwidth, so is not suited for retrieving other SNMP information. 它旨在显示网络带宽,因此不适合检索其他SNMP信息。
- It doesn’t give an option to save/open configuration files. 它没有提供保存/打开配置文件的选项。
If the above limitations are an issue, read on to one of the other options.
如果上述限制是一个问题,请继续阅读其他选项之一。
Download and install using the regular “Next” -> “Next” -> “Finish” procedure and open the program.
使用常规的“下一步”->“下一步”->“完成”过程下载并安装并打开程序。
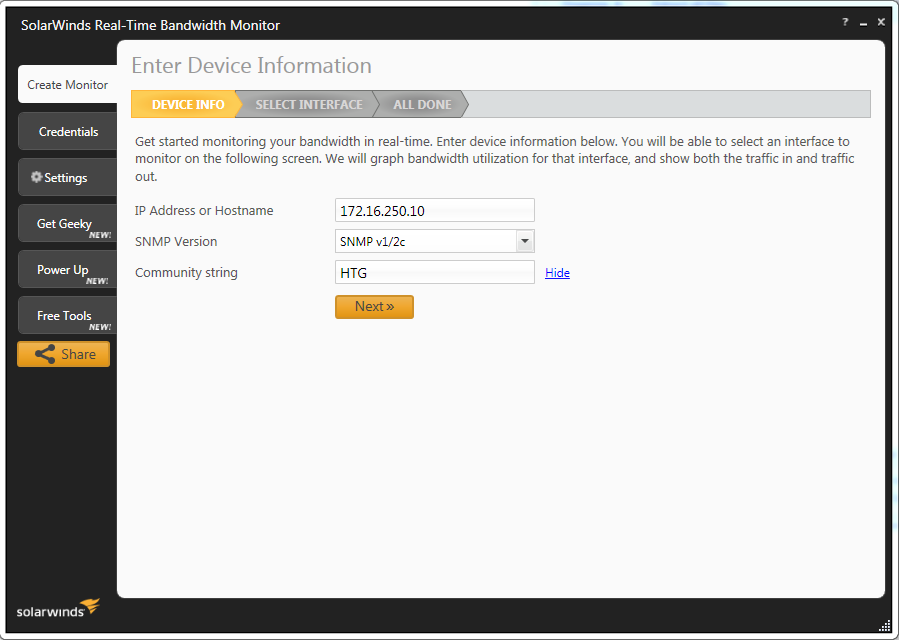
You should be presented with a wizard as shown below. Fill in the target device’s “IP” and “community” information and click “Next”.
应该显示一个向导,如下所示。 填写目标设备的“ IP”和“社区”信息,然后单击“下一步”。
The program will “pull” the device for it’s interfaces and show them in a friendly formatted, colorized, and name enumerated list.
该程序将“拉出”设备的接口,并以友好的格式,颜色和名称枚举列表显示它们。
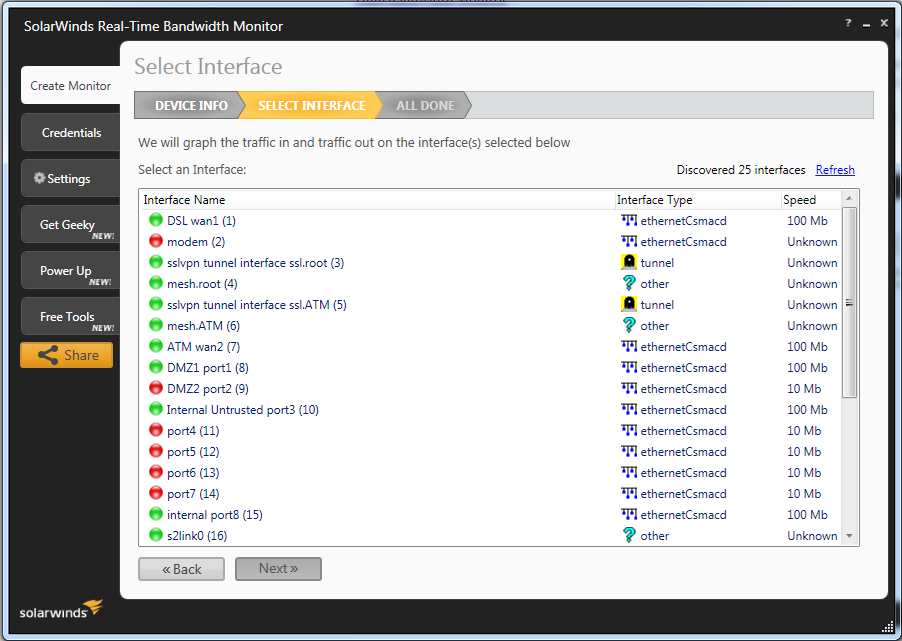
Choose the interfaces you wish to monitor (multiple selection is possible with CTRL) and click “Next”.
选择您要监视的接口(使用CTRL可以选择多个),然后单击“下一步”。
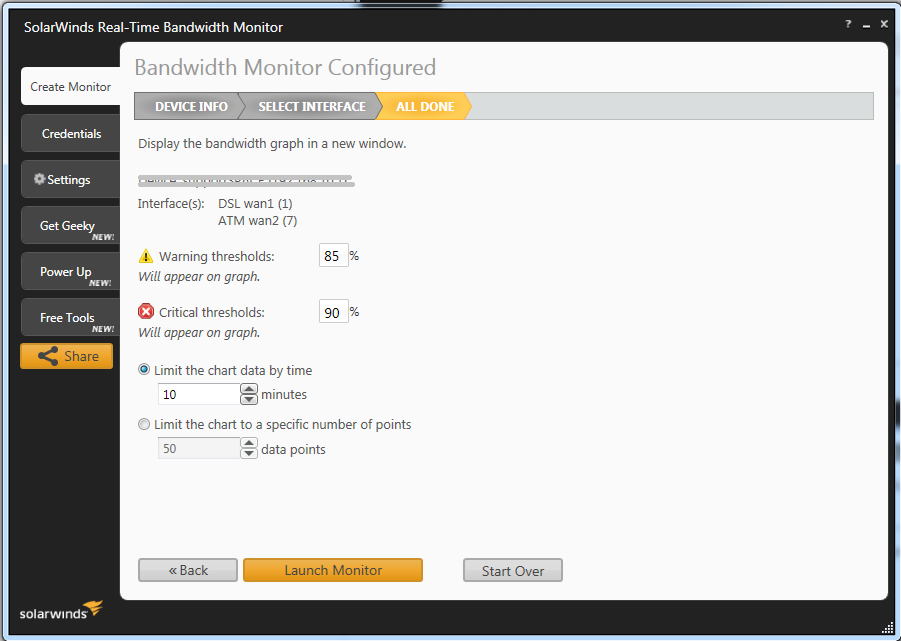
In the example above, we’ve selected two interfaces called “DSL wan1” & “ATM wan2”. You can accept the default settings and click “Launch Monitor”.
在上面的示例中,我们选择了两个接口,分别称为“ DSL wan1”和“ ATM wan2”。 您可以接受默认设置,然后单击“启动监视器”。
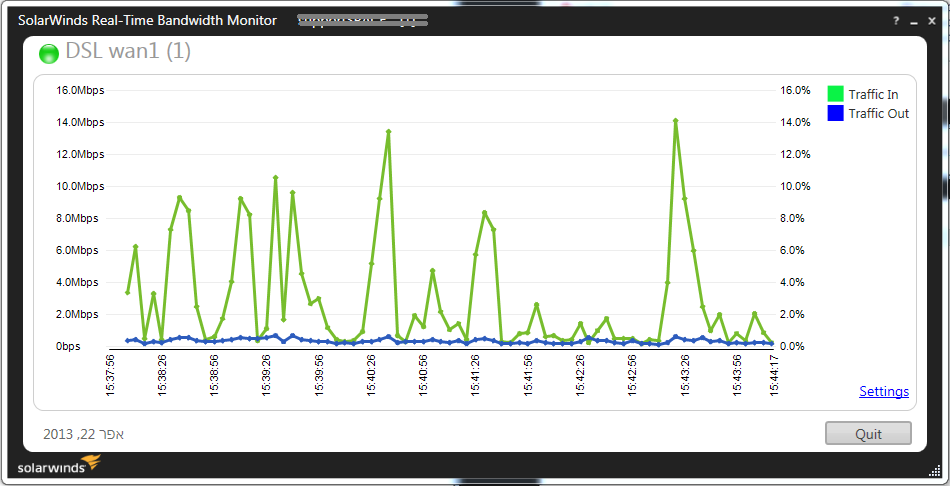
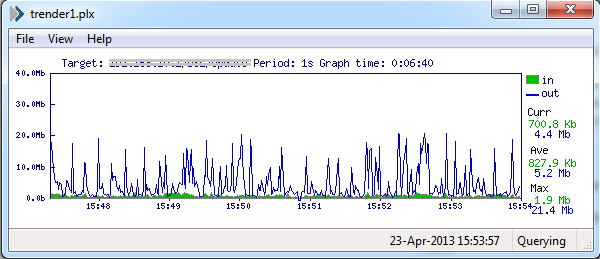
Graph windows as the above one, should open up and start to show traffic information with a 5 second (configurable) refresh interval.
上面的图形窗口应打开并以5秒钟(可配置)的刷新间隔开始显示交通信息。
Note about the refresh interval: The real advantage of this program is that, of all the programs I’ve come across, this was the only one that tells you if your refresh interval is too short. During the past week, I’ve had the distinct “pleasure” of debugging a problem with SNMP readouts, as it seems some devices can’t (or simply won’t) update their statistics more then X times/sec (7 for Juniper devices). This program was the only one that told me that my refresh interval was too quick, which explained why I was getting wonky results.
关于刷新间隔的注意事项:该程序的真正优点是,在我遇到的所有程序中,这是唯一一个告诉您刷新间隔是否太短的程序。 在过去的一周中,我特别高兴地调试了SNMP读数问题,因为似乎有些设备无法(或根本不会)以超过X次/秒的速度更新其统计信息(Juniper为7次)设备)。 该程序是唯一一个告诉我刷新间隔太快的程序,这解释了为什么我得到不稳定的结果。
Unless you still need to enable SNMP on the target device (see below), you are DONE. Rejoice and be on your merry way :)
除非仍然需要在目标设备上启用SNMP(请参见下文),否则您已完成。 欢喜并以自己快乐的方式:)
Plixer的“ Flowalyzer”( 绘图) (“Flowalyzer” from Plixer (Graphing))
This free utility, called Flowalyzer, is very simple to operate. It looks like Plixer took the well known STG utility (explained below) and wrapped it into something a bit more user friendly. It also features the “translate from OIDs to names list” functionality. The advantage of this utility in comparison to the Solarwinds one is that it is possible to extract the OIDs in their numeric form.
这个名为Flowalyzer的免费实用程序非常易于操作。 看起来Plixer采取了众所周知的STG实用程序 (如下所述)并将其包装到更加用户友好的内容中。 它还具有“从OID转换到名称列表”功能。 与Solarwinds相比,此实用程序的优点是可以提取数字形式的OID。
With that said, it has two severe drawbacks:
话虽如此,它有两个严重的缺点 :
I’ve found that the program is not suited for prolonged monitoring periods, as it will inexplicably & randomly crash.
我发现该程序不适合长时间监视,因为它将莫名其妙地随机崩溃 。
While it has the advantage of being able to save its configuration into files and then invoke them by associating the program to the suffix, it is also extremely touchy about where the files are saved. I have found that if the directory tree holding the saved files contains “spaces”, when trying to invoke them, the program will error out.
尽管它的优点是能够将其配置保存到文件中,然后通过将程序与后缀相关联来调用它们,但它对于文件的保存位置也非常敏感。 我发现如果保存文件的目录树包含“空格”,则在尝试调用它们时,该程序将出错。
In summation, use this program to obtain the OIDs and “feed them to the STG program” and/or “get the Hell out of Dodge”.
总而言之,请使用该程序获取OID并将其“喂入STG程序”和/或“摆脱地狱之地”。
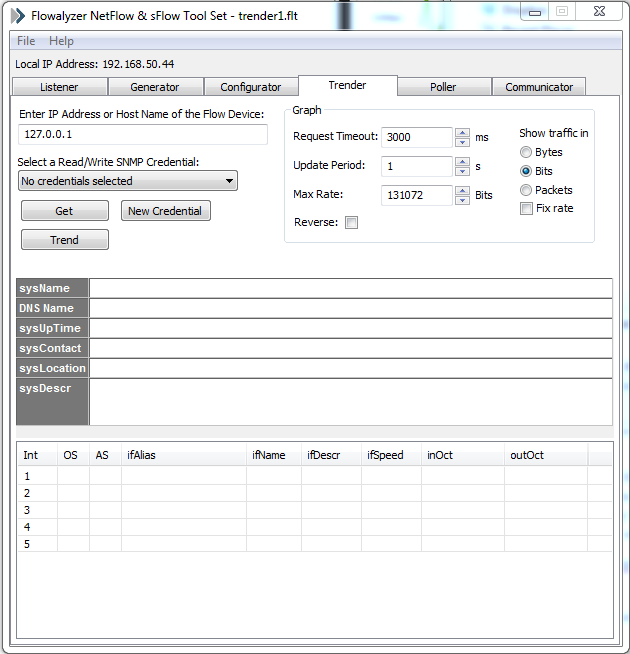
When you open the program, you’ll be greeted with the below window.
当您打开程序时,将出现以下窗口。
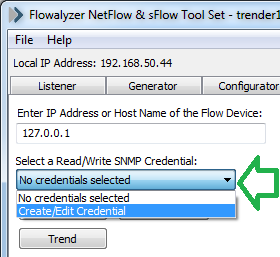
Click on the “Select a R/W SNMP Credential” dropdown list and click on “Create/Edit”.
单击“选择R / W SNMP凭据”下拉列表,然后单击“创建/编辑”。
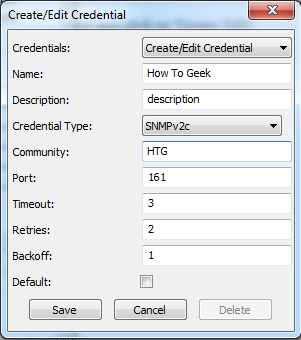
Fill in the information required for your target devices (mainly the community string) and save.
填写目标设备所需的信息(主要是社区字符串)并保存。
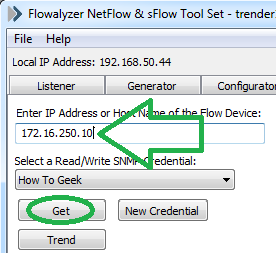
Fill the IP of the target device and click on “Get”.
填写目标设备的IP,然后单击“获取”。
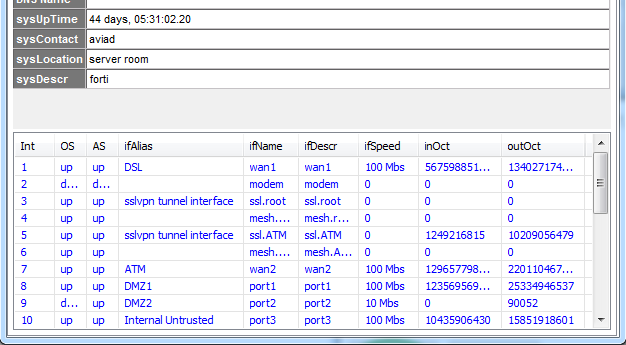
Once you do that, the bottom half of the program window should populate with information pulled from the device like the below picture.
完成此操作后,程序窗口的下半部分将填充从设备中拉出的信息,如下图所示。
Clicking on one of the lines should pop-up a monitor window like the one below.
单击其中一行,将弹出一个监视窗口,如下所示。
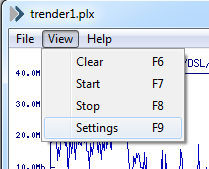
To obtain the long sought after OID, click on “View” -> “Settings”.
要获得渴望已久的OID,请单击“查看”->“设置”。
In the next window, one can see the OIDs for the incoming/outgoing traffic.
在下一个窗口中,您可以看到传入/传出流量的OID。
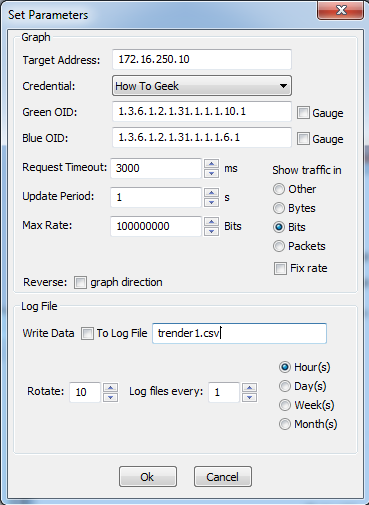
You got the OIDs, yay!!
您有OID,是的!
Simple Traffic Monitor (STG) from Leonid Mikhailov (Graphing)
Leonid Mikhailov的简单交通监控器(STG)( 图形)
This free utility is by far the oldest of the options, but it works flawlessly for literally years and can keep its configuration in shareable files. The only drawback is that you need to obtain the OIDs by other means.
到目前为止,这个免费实用程序是最古老的选项,但实际上它可以完美运行数年,并且可以将其配置保留在可共享文件中。 唯一的缺点是您需要通过其他方式获取OID。
Download the program either from us (to avoid hotlinking) or the author.
从我们(避免热链接)或作者 那里下载程序。
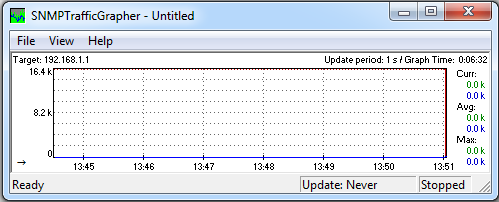
Extract the zip file to a location of your choosing and run it. You will be presented with a blank window.
将zip文件解压缩到您选择的位置并运行它。 您将看到一个空白窗口。
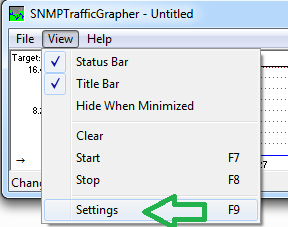
Click on “View” -> “Settings”.
单击“查看”->“设置”。
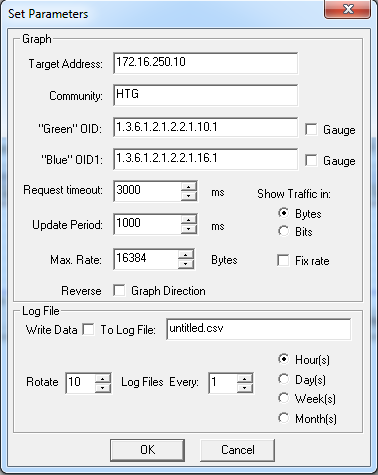
In the next window, you need to input the OIDs as you got them from some other method (at least two in this guide).
在下一个窗口中,您需要输入从其他方法获得的OID(本指南中至少有两个)。
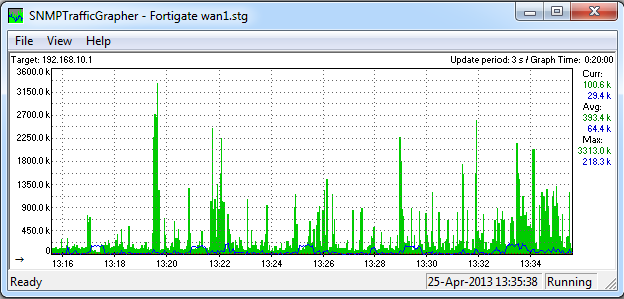
If all went well, the main window should fill with information and look like the below.
如果一切顺利,则主窗口应填充信息,如下所示。
SNMP4tPC的GetIF(浏览OID树) (GetIF by SNMP4tPC (Browsing the OIDs tree))
This program is old, and while newer options are available, due to the fact that it is free, it gets the job done, and is the one that got me started, honor demands I pay homage to it.
该程序是旧的,并且有可用的较新选项,由于它是免费的,因此可以完成工作,并且是使我入门的一个程序,荣誉要求我向它表示敬意。
Using this program or one like it will enable you to extract more information than “just” the device’s interface information. With that said, we will be using the interface’s example just to make the follow through more readable.
使用此程序或类似的程序,您将可以提取比“仅”设备的接口信息更多的信息。 话虽如此,我们将使用接口的示例来使后续操作更具可读性。
Download the program either from us (to avoid hotlinking) or the author.
从我们(避免热链接)或作者 那里下载程序。
Install using the regular “Next” -> “Next” -> “Finish” procedure and open the program.
使用常规的“下一步”->“下一步”->“完成”过程进行安装,然后打开程序。
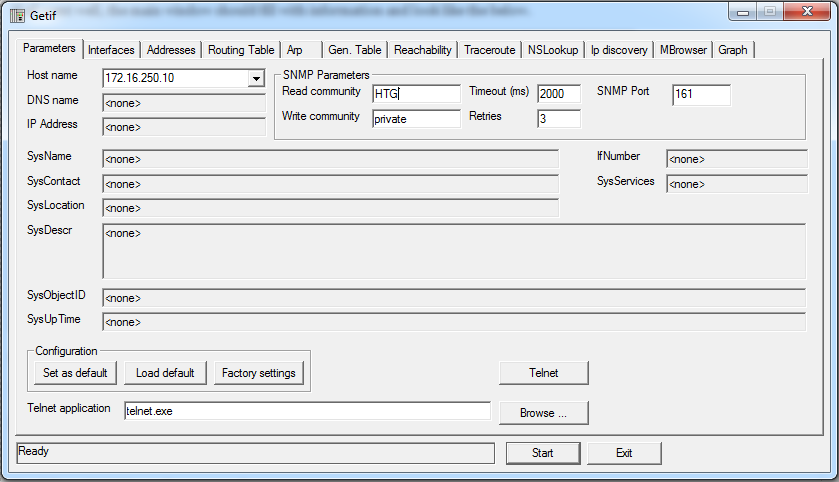
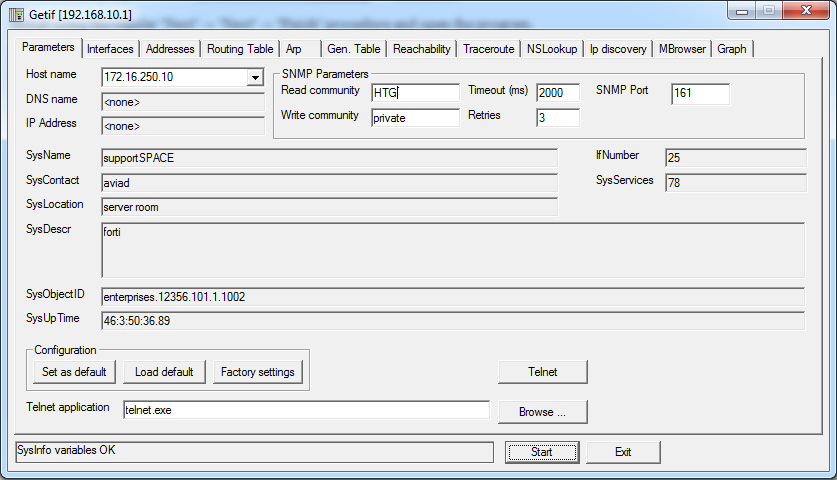
Fill in the information for the target device and click “Start”.
填写目标设备的信息,然后单击“开始”。
To walk the OIDs tree, go to the “MBrowser” tab.
要遍历OID树,请转到“ MBrowser”选项卡。
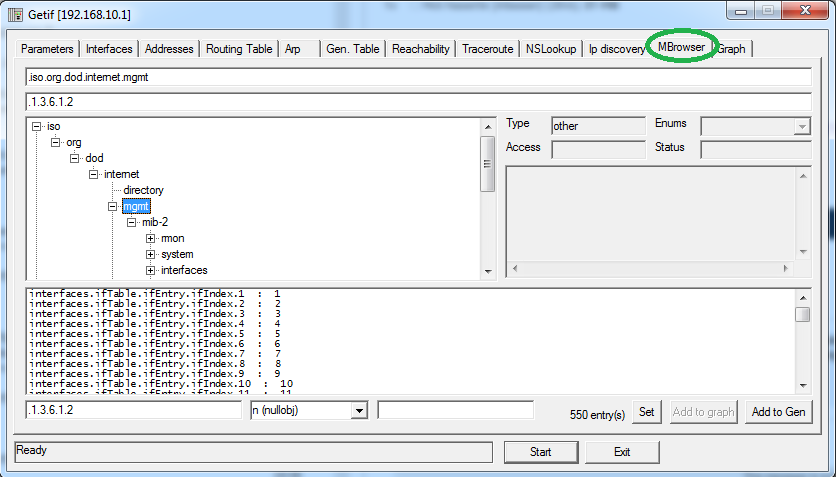
Once you see a segment that you want to read, select it and click on “Start”.
看到要阅读的片段后,将其选中并单击“开始”。
For example, to obtain the same “interface” information we got using the programs above, browse to: iso -> org -> dod -> internet -> mgmt -> mib-2 -> interfaces -> ifTable -> ifEntry ->ifDescr and click “Start”
例如,要获得与上述程序相同的“接口”信息,请浏览至:iso-> org-> dod-> internet-> mgmt-> mib-2-> interfaces-> ifTable-> ifEntry-> ifDescr,然后单击“开始”
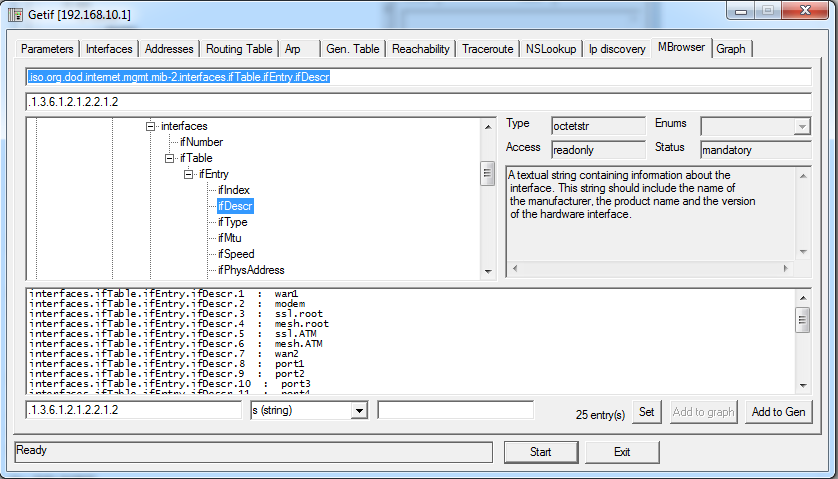
The bottom half of the window now shows the “Names” given to the interfaces on the target device. To get the “traffic OIDs”, note the number of the interface (in our example, wan2=interface7) and continue to the “ifInOctets” & “ifOutOctets” subtrees.
现在,窗口的下半部分显示为目标设备上的接口指定的“名称”。 要获取“流量OID”,请注意接口的编号(在我们的示例中为wan2 = interface7),然后继续“ ifInOctets”和“ ifOutOctets”子树。
They are located at: iso -> org ->dod ->internet ->mgmt.mib-2 -> interfaces -> ifTable -> ifEntry -> ifInOctets.
它们位于:iso-> org-> dod->互联网-> mgmt.mib-2->接口-> ifTable-> ifEntry-> ifInOctets。
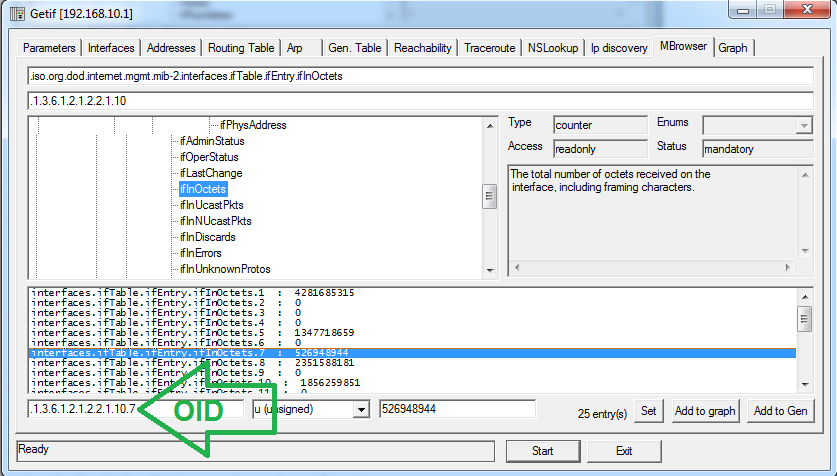
Click on the Interface you want to monitor traffic for and note the OID from the bottom left part of the window.
单击要监视其流量的接口,并从窗口左下方注意OID。
You are now ready to take the OIDs you’ve collected to one of the monitoring programs above.
现在,您可以将已收集的OID带到上述监视程序之一。
在目标设备上启用SNMP (Enabling SNMP on the target device)
Almost every self respecting device that can be networked supports exposing its information in this way. With that said, not every device does, and you may need to consult your device’s documentation to find out how to do this. Below are some examples I have in my close vicinity, but this is by no means an exhaustive list.
几乎每个可以联网的自尊设备都以这种方式支持公开其信息。 如此说来,并非所有设备都可以,并且您可能需要查阅设备的文档以了解如何执行此操作。 以下是我附近的一些示例,但这绝不是详尽的清单。
On DD-WRT
在DD-WRT上
In the WebGUI, go to “Services” and scroll down the page to find the “SNMP” radio button.
在WebGUI中,转到“服务”并向下滚动页面以找到“ SNMP”单选按钮。
Select the “Enabled” radio button and save the configuration.
选择“启用”单选按钮并保存配置。
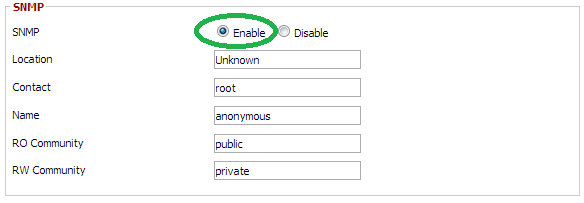
Once enabled, you will be presented with the details that you may change. It is important that you note what “RO community” you are using. The default is “public”, but you may change this to any other value that you wish. Save and apply the changes.
启用后,系统将为您提供可能更改的详细信息。 请务必注意您正在使用的“ RO社区”。 默认值为“ public”,但您可以将其更改为所需的任何其他值。 保存并应用更改。
On Fortigate (FortiOS)
在Fortigate(FortiOS)上
Assuming a fairly recent version of FortiOS (v4 and above), in the main window expand the “Config” pane and select “SNMP”.
假设使用的是FortiOS的最新版本(v4及更高版本),请在主窗口中展开“配置”窗格,然后选择“ SNMP”。
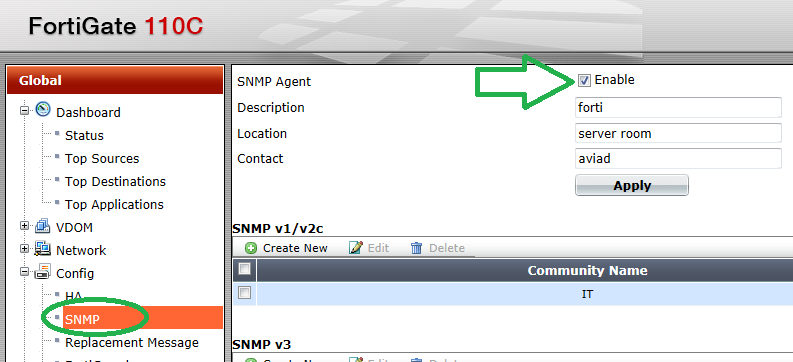
Note: The above screenshot has been taken from a v5 FortiOS.
注意:上面的屏幕截图来自v5 FortiOS。
To create a new “SNMP v1/v2c” community, click on “Create New”.
要创建一个新的“ SNMP v1 / v2c”社区,请单击“新建”。
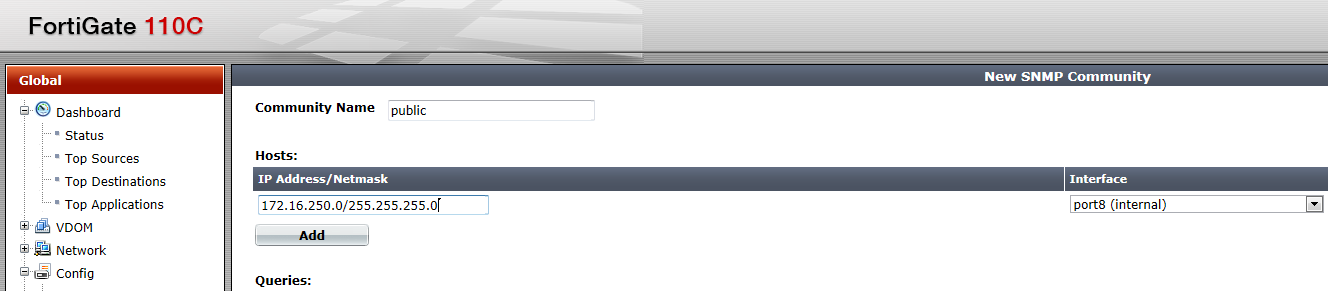
Fill in the information such as “community name”, the range of IPs that are allowed to access it, and from what “interface”. Once done, Click “OK” at the bottom of the page to save your settings.
填写信息,例如“社区名称”,允许访问的IP范围以及“接口”的名称。 完成后,单击页面底部的“确定”以保存您的设置。
You also need to enable the interface you want to read the information from, for SNMP traffic. To do this, go to “Config” -> “Network”.
您还需要启用要从中读取信息的接口,以进行SNMP通信。 为此,请转到“配置”->“网络”。
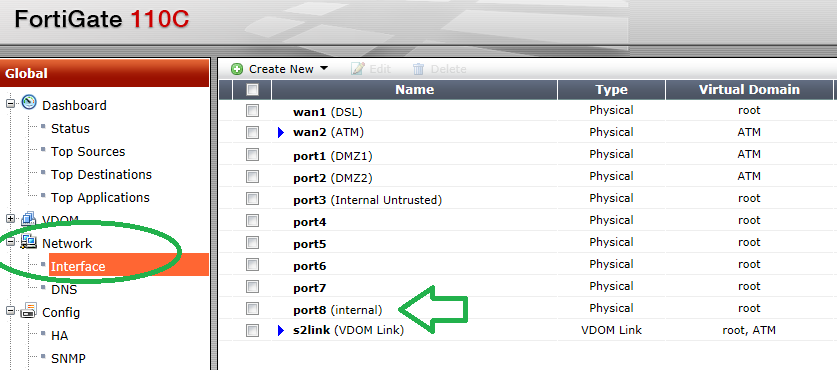
In this example we used “port8”, so we will edit that interface.
在此示例中,我们使用“ port8”,因此我们将编辑该接口。
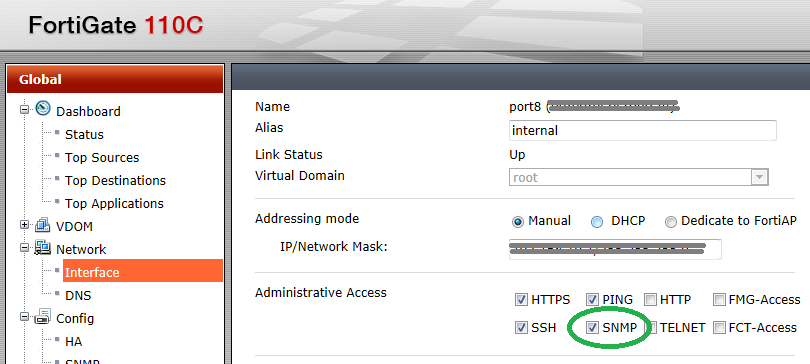
Check the “SNMP” checkbox and click “OK” at the bottom of the page.
选中“ SNMP”复选框,然后单击页面底部的“确定”。
Note: The interface you are trying to read SNMP from must be in the “management Vdom” if VDOMs are enabled on your device. Changing the management Vdom is out of the scope of this guide.
注意:如果设备上启用了VDOM,则您尝试从中读取SNMP的接口必须位于“管理Vdom”中。 更改管理Vdom不在本指南的范围之内。
On Juniper (JunOS)
在瞻博网络(JunOS)
In the WebGUI, go to “Configure” -> “Services” -> “SNMP”.
在WebGUI中,转到“配置”->“服务”->“ SNMP”。
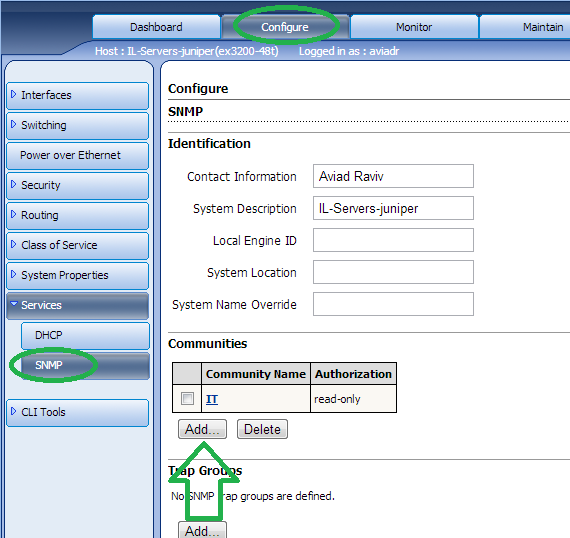
Click on “Add”.
点击“添加”。
Fill in the “Community name” of your choice and select the “Authorization” type.
填写您选择的“社区名称”,然后选择“授权”类型。
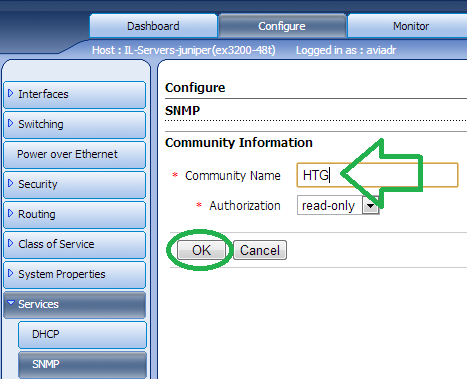
Save and Commit your changes for them to take affect.
保存并提交更改,以使更改生效。
On NetAPP
在NetAPP上
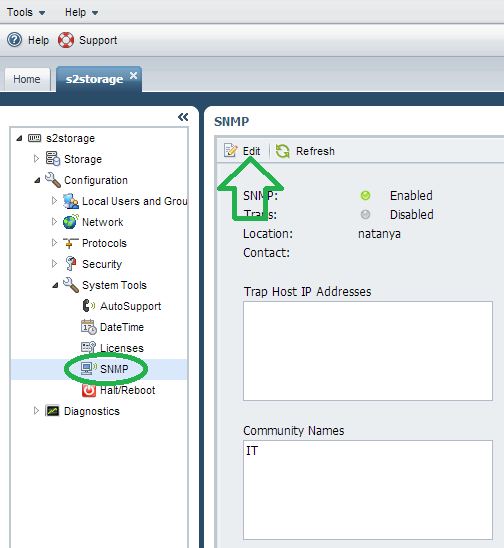
Open the “NetApp OnCommand System Manager” and log into your storage device. Under “Configuration” -> “System Tools”, click on “SNMP” and then “Edit”.
打开“ NetApp OnCommand系统管理器”并登录到您的存储设备。 在“配置”->“系统工具”下,单击“ SNMP”,然后单击“编辑”。
Click “Add”.
点击“添加”。
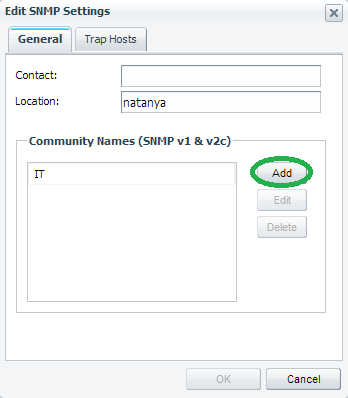
This will enable you to add a new “Community” string as shown below.
这将使您能够添加一个新的“ Community”字符串,如下所示。
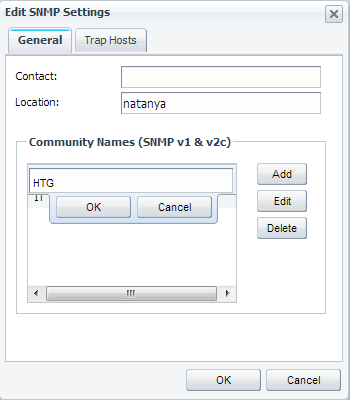
Fill in the desired name and click “OK” all the way back.
填写所需的名称,然后一直单击“确定”。
On Windows
在Windows上
It is possible to activate SNMP on windows, it is just rarely used or even talked about (looking right at you, MS certifications…). You will need to install the service first.
可以在Windows上激活SNMP,但很少使用或谈论它(正对您看,MS认证…)。 您将需要先安装该服务。
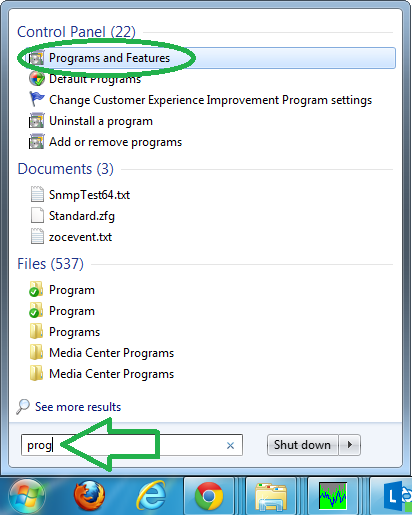
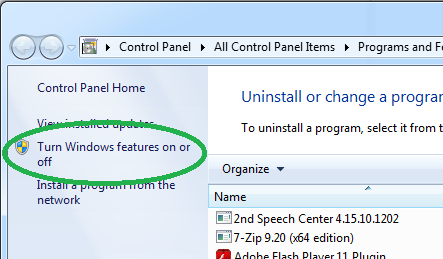
Install the service by going to “Programs and Features”.
通过转到“程序和功能”来安装服务。
Go into “Turning Windows features on or off”.
进入“打开或关闭Windows功能”。
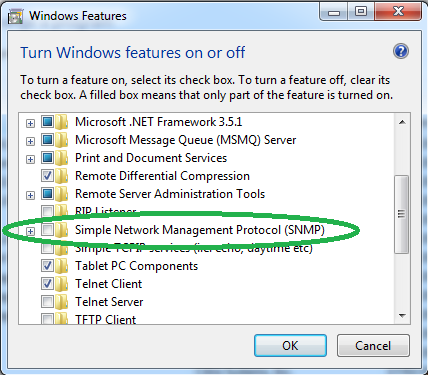
Scroll to find the “Simple Network Management Protocol (SNMP)”. Check its checkbox and click “OK” for it to be installed.
滚动查找“简单网络管理协议(SNMP)”。 选中其复选框,然后单击“确定”以进行安装。
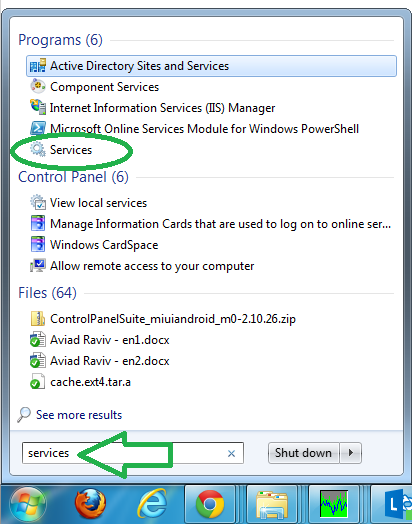
Once installed, configure the community string by opening “Services”.
安装后,通过打开“服务”来配置社区字符串。
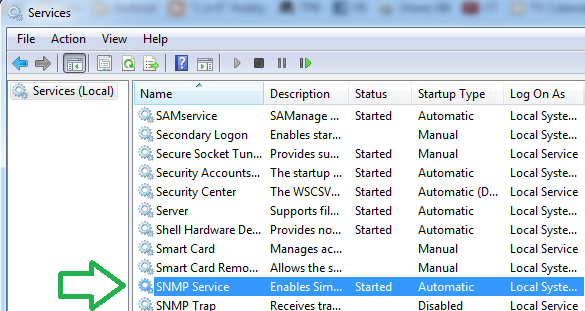
Scroll to find the service and go into its properties.
滚动查找服务,然后进入其属性。
Go to the “Security” tab.
转到“安全性”标签。
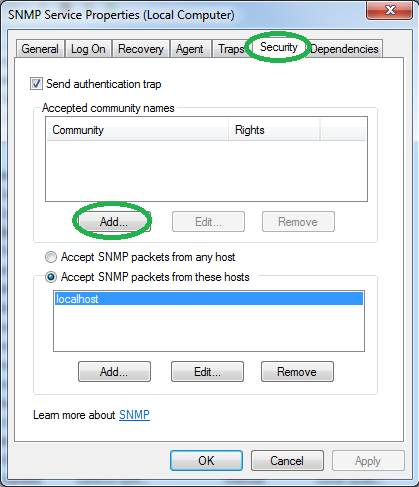
To add a community, click on “Add”.
要添加社区,请单击“添加”。
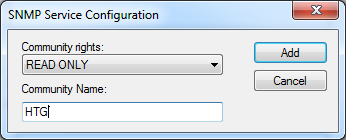
Fill in the desired community name and click “Add” and OK for the settings to take affect.
填写所需的社区名称,然后单击“添加”,然后单击“确定”以使设置生效。
Note: You may need to change other properties to enable remote machines to get the readout, but that is beyond the scope of this guide.
注意:您可能需要更改其他属性,以使远程计算机能够获取读数,但这超出了本指南的范围。
That’s it, you should be all set to graph your network’s information, and you are encouraged to explore what the SNMP protocol can offer you beyond the scope of this guide, such as: using MIBs and traps. Just remember the summarizing quote from below…
就是这样,您应该全都可以绘制网络信息的图表,并且鼓励您探索SNMP协议可以为您提供的内容,例如,使用MIB和traps 。 只要记住下面的摘要语录...
We are all the sum of our tears. Too little and the ground is not fertile, and nothing can grow there. Too much, the best of us is washed away. (Babylon 5 g’kar)
我们都是眼泪的总和。 太少了,地面不肥沃,那里什么也不能生长。 太多了,我们最好的一面被冲走了。 (巴比伦5 g'kar )
dsp怪胎


 1万+
1万+

 被折叠的 条评论
为什么被折叠?
被折叠的 条评论
为什么被折叠?
 到【灌水乐园】发言


