


Data trends change over time. As such, you may need to edit or remove data from a chart in a Microsoft PowerPoint presentation to reflect those changes. Doing so is a reasonably straightforward process. Here’s how to do it.
数据趋势随时间变化。 因此,您可能需要在Microsoft PowerPoint演示文稿中的图表中编辑或删除数据以反映这些更改。 这样做是一个相当简单的过程。 这是操作方法。
从PowerPoint图表中编辑和删除数据 (Editing and Removing Data from a PowerPoint Chart)
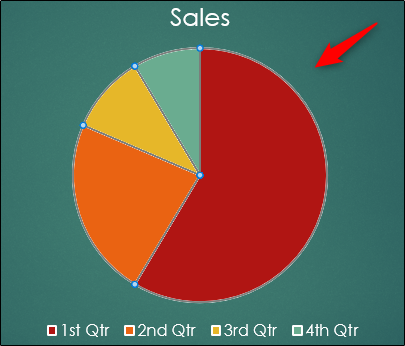
Open PowerPoint and head over to the slide that contains the chart or graph. Once there, select the chart.
打开PowerPoint,然后转到包含图表或图形的幻灯片。 到达那里后,选择图表。
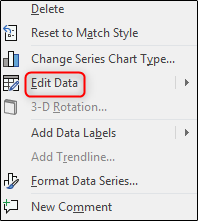
Now, right-click the chart. From the context menu that appears, select the “Edit Data” command.
现在,右键单击图表。 从出现的上下文菜单中,选择“编辑数据”命令。
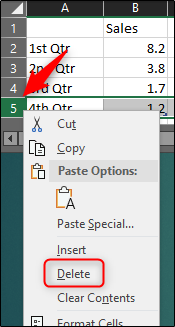
A small spreadsheet will appear. Here, you can select the cell that contains the data you would like to edit and then type whatever new value you want in your chart.
将出现一个小的电子表格。 在这里,您可以选择包含要编辑的数据的单元格,然后在图表中键入所需的任何新值。
The graphic will adjust accordingly. If you want to completely remove data from the chart, select the row that contains the data, right-click the row header, and then select the “Delete” command from the context menu.
图形将相应调整。 如果要从图表中完全删除数据,请选择包含数据的行,右键单击行标题,然后从上下文菜单中选择“删除”命令。
The data will then be removed from the chart.
然后,数据将从图表中删除。
翻译自: https://www.howtogeek.com/414498/how-to-remove-data-from-a-chart-in-powerpoint/


 1743
1743

 被折叠的 条评论
为什么被折叠?
被折叠的 条评论
为什么被折叠?
 到【灌水乐园】发言


