


Visual Studio Code is an open source Code Editor headed by Microsoft that borrows a lot from Visual Studio.
Visual Studio Code是一个由Microsoft领导的开源代码编辑器,它从Visual Studio中借鉴了很多东西。

It has been in development for a while, and has really matured as an editor that many developers are switching to it.
它已经开发了一段时间,并且作为一个编辑器已经真正成熟,许多开发人员都开始使用它。
It comes with a couple of feature, to mention a few
它带有一些功能,仅举几例
- Git/Github integration Git / Github集成
- Awesome Intellisense 很棒的智能感知
- Awesome set of plugins 很棒的插件集
- Awesome debugging tools 很棒的调试工具
We'll focus on Visual Studio Code's debugging ability for nodejs applications in this artilce.
在本文中,我们将重点介绍Visual Studio Code对Node.js应用程序的调试功能。
调试工具 ( DEBUGGING TOOLS )
To see debugging in action, we'll first debug a small piece of javascript, just to get familiarized with the Visual Studio Code debugging tools.
为了看到实际的调试效果,我们将首先调试一小段javascript,以熟悉Visual Studio Code调试工具。
Create an isolated directory, say vscode_debug, then inside it create a new file index.js
创建一个隔离目录,例如vscode_debug ,然后在其中创建一个新文件index.js
vscode_debug/index.js
vscode_debug / index.js
let program = {
  name: 'vscode',
  language: 'typescript'
}

let otherProperties = {
  sourceCode: 'https://github.com/Microsoft/vscode',
  license:  'MIT'
}

// Add properties to targetObjects
function combine(targetObject, otherObject) {
  Object.assign(targetObject, otherObject)
}

combine(program, otherProperties)
We'll look at the effect of Object.assign on a given object.
我们将研究Object.assign对给定对象的影响。
We'll add a breakpoint at the line with combine(program, otherProperties), by clicking just before the line number.
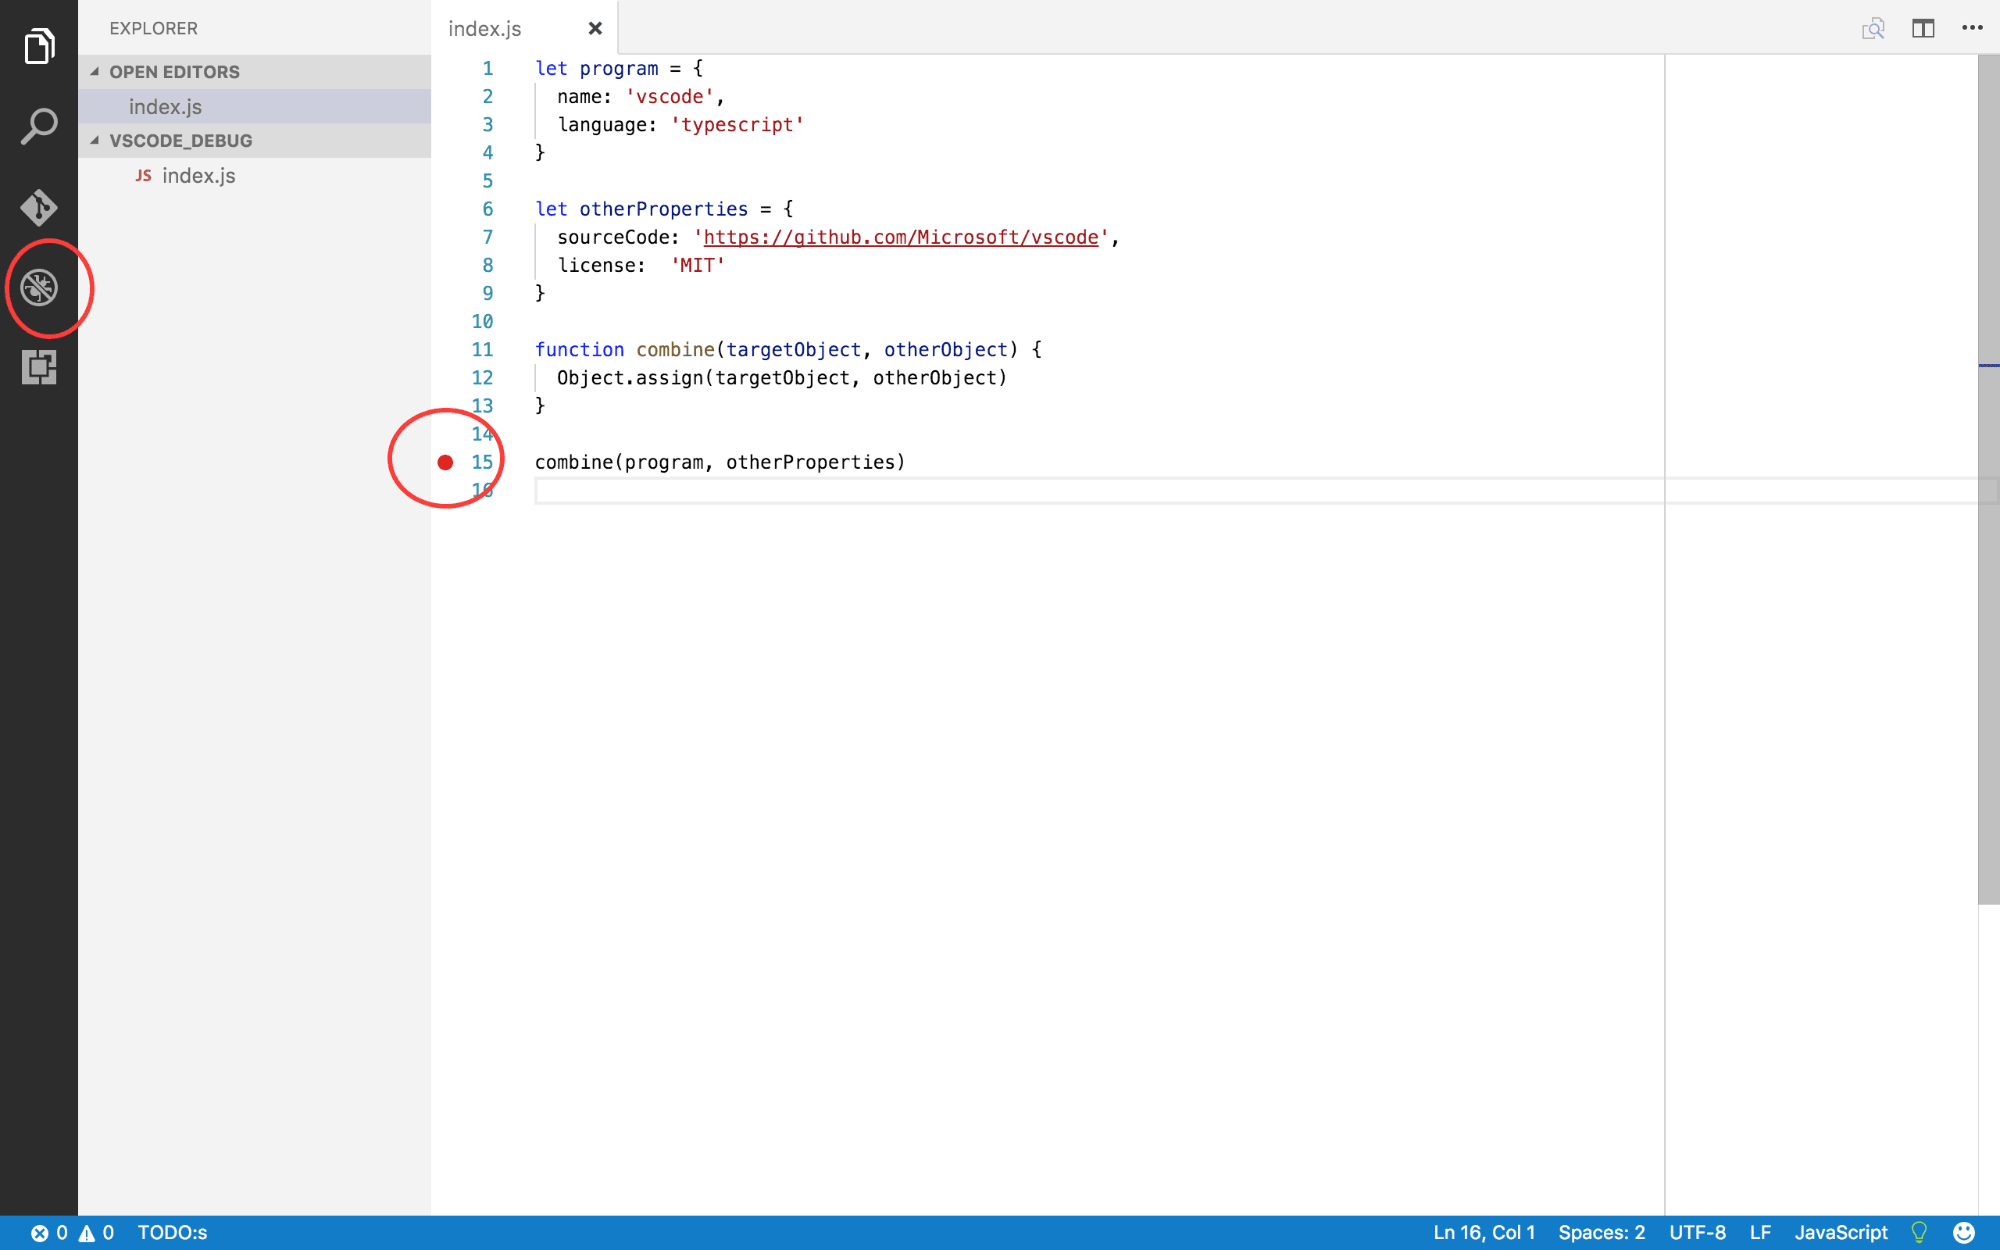
我们将通过在行号之前单击,在带有combine(program, otherProperties)的行上添加一个断点。
Then, on the left pane, click on the debug icon as annotated above. The view below should be shown.

然后,在左窗格中,单击上面注释的调试图标。 应该显示下面的视图。
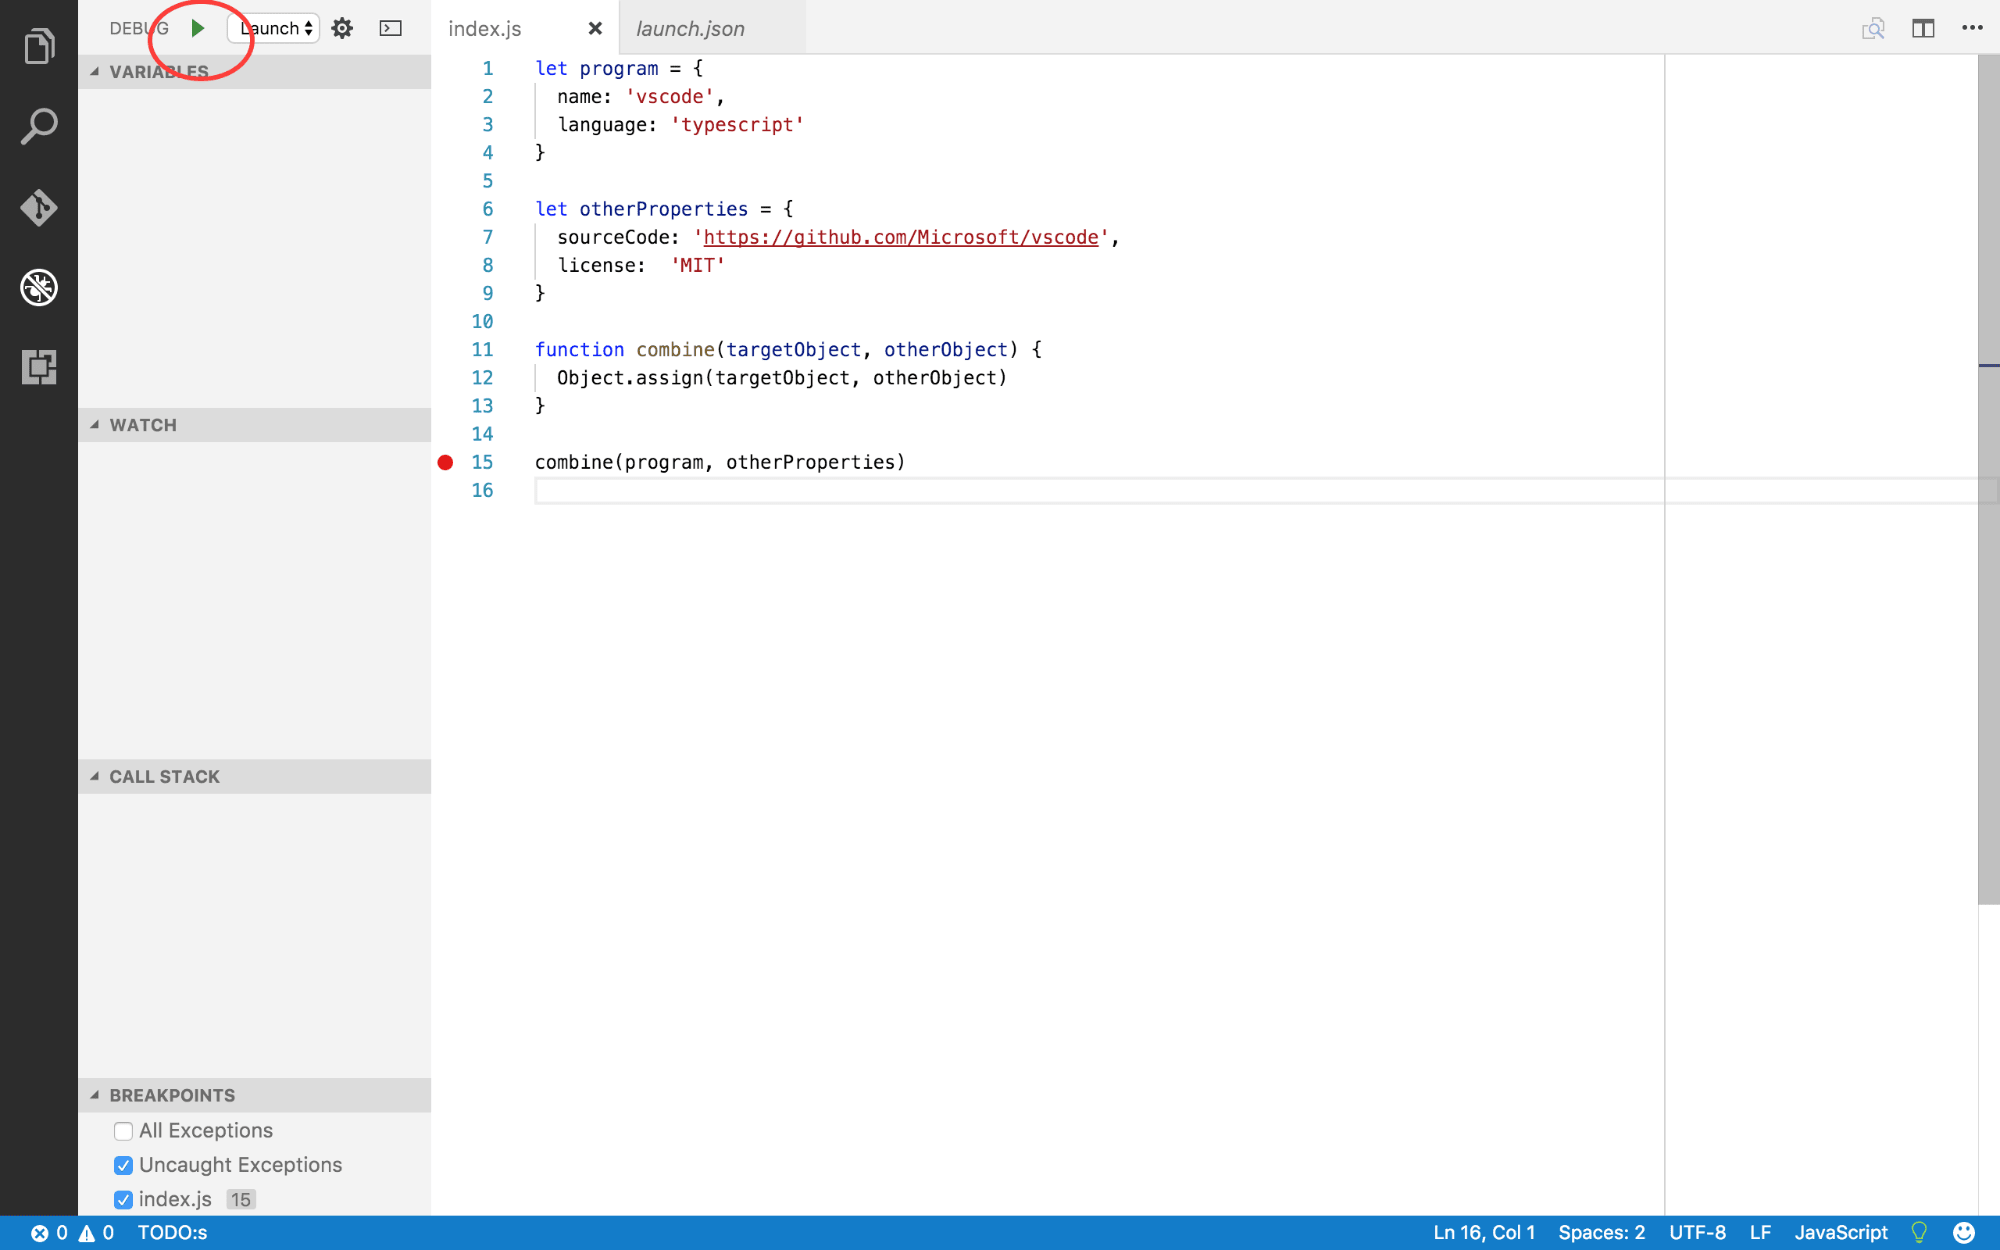
We have 4 sections of the left pane, which are populated during debug mode in VS Code.
我们在左窗格中有4个部分,这些部分在VS Code的调试模式下填充。
- variables - this is where all the variables in our debugging context and ther values will be displayed. We'll look at this in detail shortly. 变量 -这是我们调试上下文中所有变量的显示位置。 我们将在稍后详细讨论。
- Watch - This will enable us to list variables, or exressions and watch them change state as we debug our code. 监视 -这将使我们能够列出变量或扩展名,并在调试代码时监视它们的状态更改。
- Call Stack - This is simply a stack of the functions called when the app is running up to the point where we want to start our debugging. 调用堆栈 -这只是应用程序运行到我们要开始调试时所调用的函数的堆栈。
- Break Points - This lists all the breakpoints we put in our applications. In this case for instance, it has selected the
index.jsfile and pointed to line 15. 断点 -这列出了我们放入应用程序中的所有断点。 例如,在这种情况下,它选择了index.js文件并指向第15行。
To configure VS Code debugging, we need to create a launch.json file that VS Code uses for debugging. In the screenshot above, I've annotated a gear-like button at the top, when you click on it, a pop up will show. Select Node.js
要配置VS Code调试,我们需要创建一个launch.json文件,VS Code launch.json文件用于调试。 在上面的屏幕截图中,我在顶部标注了一个齿轮状的按钮,当您单击它时,将显示一个弹出窗口。 选择Node.js
A file launch.json is created. The important property to look at in the created file is the first child of configurations, and the property is program. Make sure the file written there is the one that we created. In our case index.js
创建文件launch.json 。 在创建的文件中要查看的重要属性是configurations的第一个子项,而该属性是program 。 确保写入的文件是我们创建的文件。 在我们的例子中index.js
vscode_debug/.vscode/launch.json
vscode_debug / .vscode / launch.json
{
  "version": "0.2.0",
  "configurations": [
    {
      ...
      "program": "${workspaceRoot}/index.js",
      ...
      ...
  ]
}
That's all the set up we need. Now click on the run button.
这就是我们所需的全部设置。 现在单击run button 。
When we click on the run button, a few things change

当我们点击运行按钮时,一些事情发生了变化
At the top of the Visual Studio code IDE, a set of buttons appear.
在Visual Studio代码IDE的顶部,出现了一组按钮。
The first button with a run icon is called continue and is used to resume exectution until the next breakpoint, in case you have more than one breakpoint.
第一个带有run图标的按钮称为“ continue ,用于在下一个断点之前恢复执行,以防您有多个断点。
The next button, with a bent forward arrow, is called step over and is used to go to the next line in execution. In case it gets to a function like it is right now, it will not take the debugger into the function as expected, but will evaluate the function, return the result and continue.
具有向前弯曲箭头的下一个按钮称为step over ,用于执行中的下一行。 如果它到达当前的功能,它将不会像预期的那样将调试器带入功能,而是会评估功能,返回结果并继续。
If we need to get into a function call, we use the third button pointing down, with a dot. It's called the step into button. This is what we'll use next.
如果需要进入函数调用,则使用第三个指向下方的按钮,并带有一个点。 称为step into按钮。 这就是我们接下来要使用的。
The final button, upward pointing arrow, step out is used to get out of function calls, or other nested scope that the debugger may be in.
最终按钮(向上箭头, step out )用于退出函数调用或调试器可能位于的其他嵌套作用域。
If you look on the left pane, under variables, all the variables available in our execution context are listed there. If you've worked with nodejs before, __dirname, __filename, module and exports may be familiar, you can see their values here.
如果你看一下在左侧窗格的变量 ,都在我们的执行上下文提供的变量被列出。 如果您以前使用过__dirname , __filename可能熟悉__dirname , __filename , module和exports ,您可以在此处查看其值。
Our function, combine is also listed there as a funtion. Other local variables, program and otherProperties are laso listed there. You can expand them to see their values.
我们的功能, combine也作为功能列出。 其他本地变量, program和otherProperties属性也在此处列出。 您可以展开它们以查看其值。
The callstack shows the function calls made up to when the breakpoint is reached. You can see the top most one is an anonymous function, immediately we get into the function, it should check the name and update it.
调用堆栈显示直到断点为止的函数调用。 您可以看到最上面的一个是匿名函数,当我们进入该函数后,它应该检查名称并更新它。
The watch is pretty interesting. While we can examine the values changing under variables, hover over the title of watch and click on the plus button. Then type in program.
 The program variable and its value is listed there. The cool thing with watch is that you could put in expressions too.
手表很有趣。 尽管我们可以检查变量下的更改值,但将鼠标悬停在监视标题上方,然后单击加号按钮。 然后输入program 。
Now let's click on the step into button (arrow pointing directly downwards).
现在,让我们单击step into按钮的step into (箭头直接指向下方)。
When you click first, the call stack will identify the name of the combine function and update. We then click again to get into the function, then one final time to exit the function. Notice the value of program in the watch list has changed. This is also true for the value under the variables section.

当您第一次单击时, 调用堆栈将标识合并功能的名称并进行更新。 然后,我们再次单击以进入该功能,最后一次退出该功能。 请注意监视列表中program的值已更改。 对于变量部分下的值也是如此。
调试Express App ( Debugging an Express App )
Now that we have a basic understanding of how debugging works in Visual Studio Code, let's do a real word thing. We will work with an express app.
现在,我们对调试在Visual Studio Code中的工作方式有了基本的了解,让我们做一个真正的词吧。 我们将使用Express应用程序。
建立 (Setup)
Install the express generator, if you don't already have it.
如果尚未安装Express Generator ,请安装它。
$npm install express-generator -gNext generate an express app. We'll call it actors. All it will do is return actors stage names, and make a call to the github api, to see if there's a repo with the stage names.
接下来生成一个快速应用程序。 我们称它为演员 。 它要做的就是返回actor的舞台名称,并调用github api,以查看是否有带有该舞台名称的回购。
$ express actors
$cd actors
$ npm install
$ npm start
This should straight forward for an express app. It will start an express app and opening http://localhost:3000 should show express app runnning in the browser.
对于一个快速应用程序,这应该很简单。 它将启动一个快速应用程序,打开http://localhost:3000应该会在浏览器中显示快速应用程序运行。
We'll add another route in the users route to return the actors.
我们将在用户路线中添加另一条路线以返回参与者。
routes/users.js
路线/users.js
var express = require('express');
var router = express.Router();

/* GET users listing. */
router.get('/', function(req, res, next) {
  res.send('respond with a resource');
});

router.get('/:id', function(req, res) {
  // List of actors
  const actors = [
    {
      id: 1,
      name: 'Heisenberg'
    },
    {
      id: 2,
      name: 'Pinkman'
    },
    {
      id: 3,
      name: 'Gus'
    }
  ]

  // Get actor based on passed id
  const actor = actors.filter(actor => actor.id == req.params.id)

  // Send back actor as response
  res.send(actor)
})

module.exports = router;
If you run npm start, and go to your browser http://localhost:3000/users/1 (change id), you should see the respective actors.
如果运行npm start,并转到浏览器http://localhost:3000/users/1 (更改ID),则应看到相应的参与者。
调试可能的错误 (Debugging a possible error)
Suppose you pass in http://localhost:3000/users/ganga, or even an id greater that 3, you'll get an empty array.
假设您传入http://localhost:3000/users/ganga ,甚至是一个大于3的id,您将得到一个空数组。
Even though this seems pretty obvious, let's examine it. Click on the debug icon on the left pane, then, on the gear-like icon, then choose node.js to create a Launch.json file
即使这看起来很明显,让我们对其进行检查。 单击左窗格上的调试图标,然后单击齿轮状图标,然后选择node.js创建Launch.json文件。
It should detect that you are running an express app from the package.json, so the program paramter should be "program": "${workspaceRoot}/bin/www",.
它应该从package.json中检测到您正在运行Express应用程序,因此程序参数应为"program": "${workspaceRoot}/bin/www",
Next set up a breakpoint in routes/users.js just where we define the actor variable.

接下来,在route / users.js中定义我们的actor变量的地方设置一个断点。
Next click on the run button, and then open http://localhost:3000/users/ganga in the browser, then come back to Visual Studio Code.
 Under the
接下来单击run按钮,然后在浏览器中打开http://localhost:3000/users/ganga ,然后返回到Visual Studio Code。 变量下 , 参与者是未定义的。 我已经扩展了req变量及其params属性。 我们可以看到id的值就是我们在URL中传递的值。
If you've ever wondered what an express request, or response entails, this is your chance to get digging.
如果您想知道明确的要求或回应是什么,这是您挖掘的机会。
Click on step over, the bent arrow button, we can see that the actor is an empty array.

单击step over ,弯曲的箭头按钮,我们可以看到actor是一个空数组。
You can click on the continue button to stop debugging.
您可以单击continue按钮以停止调试。
While this example is very simple, we see that debugging works across even the imported/required files in a node environment, since in this case, the users route is required in the app.js file.
尽管此示例非常简单,但我们看到在节点环境中调试甚至可以跨导入/所需的文件进行,因为在这种情况下, app.js文件中需要用户路由。
异步呼叫 (Asyncronous calls)
We'll add one last route, to see the effect on asyncronous calls.
我们将添加最后一条路由,以查看对异步调用的影响。
Let's add axios to make calls to other apis.
让我们添加axios来调用其他api。
$npm install --save axiosNext we'll modify api, to look for actors github profiles.
接下来,我们将修改api,以查找参与者github档案。
routes/users.js
路线/users.js
var express = require('express');
var router = express.Router();
var axios = require('axios')

/* GET users listing. */
router.get('/', function(req, res, next) {
  res.send('respond with a resource');
});

router.get('/:id', function(req, res) {
  const actors = [
    {
      id: 1,
      name: 'Heisenberg'
    },
    {
      id: 2,
      name: 'Pinkman'
    },
    {
      id: 3,
      name: 'Gus'
    }
  ]

  const actor = actors.filter(actor => actor.id == req.params.id)

  // Get actor github profiles asyncronously from github
  axios.get('https://api.github.com/users/'  + actor[0].name)
    .then(githubProfile => {
      res.send(githubProfile)
    })
    .catch(error => {
      res.send(error)
    })
})
module.exports = router;
We've simply added a request call to the github api to get an actors github profile. Stop the debugger if it was running and run npm start, then head over to http://localhost:3000/users/1.
我们仅向github api添加了一个请求调用,以获取actor的github档案。 如果调试器正在运行,请停止它,然后运行npm start ,然后转到http://localhost:3000/users/1 。
¯\(ツ)/¯, It's an empty object. Let's see what's going on.
¯\ (ツ) /¯,这是一个空对象。 让我们看看发生了什么。
Adding a breakpoint to the response of the axios request, and clicking the run button next to debug, then visiting http://localhost:3000/users/1, we can clearly see the mistake we made.
 This githubProfile is a response, and it has a data property. Our bug is that, we needed to pass in the
res.send(githubProfile.data).
在axios请求的响应中添加一个断点,然后单击debug旁边的run按钮,然后访问http://localhost:3000/users/1 ,我们可以清楚地看到我们犯的错误。 data属性传递给响应。 因此,简单的解决方法是res.send(githubProfile.data) 。
Visiting http://localhost:/3000/users/1, should display the user details.
访问http://localhost:/3000/users/1 ,应显示用户详细信息。
结论 ( Conclusion )
Visual Studio Code debugging for NodeJS can go way deeper than what we've discussed here. It also comes with support for plugins, such as Chrome Debugger, which enhance it's debugging features.
NodeJS的Visual Studio Code调试比我们这里讨论的要深入。 它还带有对插件的支持,例如Chrome Debugger ,可增强其调试功能。
翻译自: https://scotch.io/tutorials/debug-a-node-app-inside-of-visual-studio-code


 1万+
1万+

 被折叠的 条评论
为什么被折叠?
被折叠的 条评论
为什么被折叠?
 到【灌水乐园】发言


