


介绍 ( Introduction )
Debugging JavaScript code can sometimes be a little time consuming. If you are just beginning JavaScript you may find yourself using alert() or window.alert() a couple of times, and if you've been writing JavaScript for a little while, you may find yourself using console.log() a number of times.
调试JavaScript代码有时可能会花费一些时间。 如果您刚刚开始使用JavaScript,则可能会几次使用alert()或window.alert() ,并且如果您已经编写JavaScript了一段时间,则可能会发现使用console.log()有很多的时间。
While these two approaches may work, they usually involve a lot of writing and deleting code, going back and forth between your browser and your editor of choice. Worst case scenario, you may ship your code with them, and consequently share information you may not want to share to users. Most linters however, like eslint, will warn you when you have console.log() statements in your code.
尽管这两种方法可能都有效,但它们通常涉及大量的编写和删除代码,在浏览器和所选编辑器之间来回切换。 最坏的情况是,您可能将代码与它们一起交付,因此可能会共享您不想共享给用户的信息。 但是,当代码中包含console.log()语句时,大多数linter (如eslint )都会警告您。
Chrome DevTools ( Chrome DevTools )
Google Chrome Browser comes with tools (dev tools) that can help us in debugging JavaScript code, among other things. To quickly name a few.
Google Chrome浏览器附带了一些工具(开发工具),这些工具可以帮助我们调试JavaScript代码等。 快速列举几个。
1. Editing CSS - You can select an element in the browser, e.g a div, right click on it and select `inspect element`. This opens the dev tools and gives you an option to edit the css on the far right.
2. Testing performance - The Chrome Dev Tools has a section called network, in which you can see how long it takes to load your application, especially how long assets take to load. You could also test your application in a bandwidth of your choice (3G, GPRS or EDGE). This is called throttling.
3. Debugging JavaScript - Chrome Dev Tools enables you debug JavaScript code. This is what we will talk about in this article.
调试 ( Debugging )
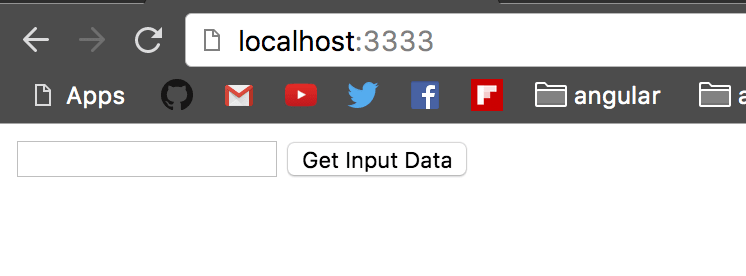
Make sure you have google chrome installed in your computer. Let's create a simple web page that takes the value of an input and prints the value a span on click of a button. We have two files:- index.html and app.js
确保您的计算机中安装了google chrome。 让我们创建一个简单的网页,该网页接受输入的值,并在单击按钮时显示该值的跨度。 我们有两个文件: -index.html和app.js
<!-- index.html -->
<html lang="en">
<head>
  <meta charset="UTF-8">
  <title>Chrome Dev Tools</title>
  <script src="app.js"></script>
</head>
<body>
  <input type="text" id="name">
  <button onclick="getData()">Get Input Data</button><br/>
  <span id="dataSpan"></span>
</body>
</html>
//app.js
function getData() {
// Get value of input
var data = document.getElementById('name').value;
// Get dataSpan DOM element
var out = document.getElementById('dataSpan');
// Assign the value of data into dataSpan html
out.innerHTML = data;
}The JavaScript function getData() simply gets the value of the input named name, then gets the dom element named dataSpan, then adds the value from the input into the span.
JavaScript函数getData()只是获取名为name的输入的值,然后获取名为dataSpan的dom元素,然后将输入中的值添加到span中。
You can open the index.html file directly in your browser, or if you have nodejs installed simply install httpster with npm install -g httpster then run httpster in the root directory of this project. A simple server will be spin with your app hosted at http://localhost:3333.
你可以在浏览器中直接打开index.html文件,或者如果你有的NodeJS装只需安装httpster与npm install -g httpster然后运行httpster在这个项目中的根目录。 一个简单的服务器将与您的应用托管在http:// localhost:3333一起旋转。
使用Chrome Dev Tools Breakpoints进行调试 (A taste of debugging with Chrome Dev Tools Breakpoints)
Suppose we wanted to know the value of var data before we put it into the dataSpan, the old way would be to do a alert(data) just after defining it, or console.log(data), then run the app in the browser and see the result.
假设我们想在将var data放入dataSpan之前知道var data的值,旧方法是在定义后立即执行alert(data)或console.log(data) ,然后在浏览器中运行应用程序并查看结果。
function getData() {
 // Get value of input
  var data = document.getElementById('name').value;

  // check the value of data
  // alert(data);
  console.log(data);

   // Get dataSpan DOM element
  var out = document.getElementById('dataSpan');

  // Assign the value of data into dataSpan html
  out.innerHTML = data;
}
We'll instead use Chrome Dev Tools to check the value using breakpoints. A breakpoint is a section/line of our code where we want the execution to stop so that we can carefully inspect the execution. With the app running in the browser, open Chrome Dev Tools by clicking on the menu at the top right corner, then More Tools > Developer Tools
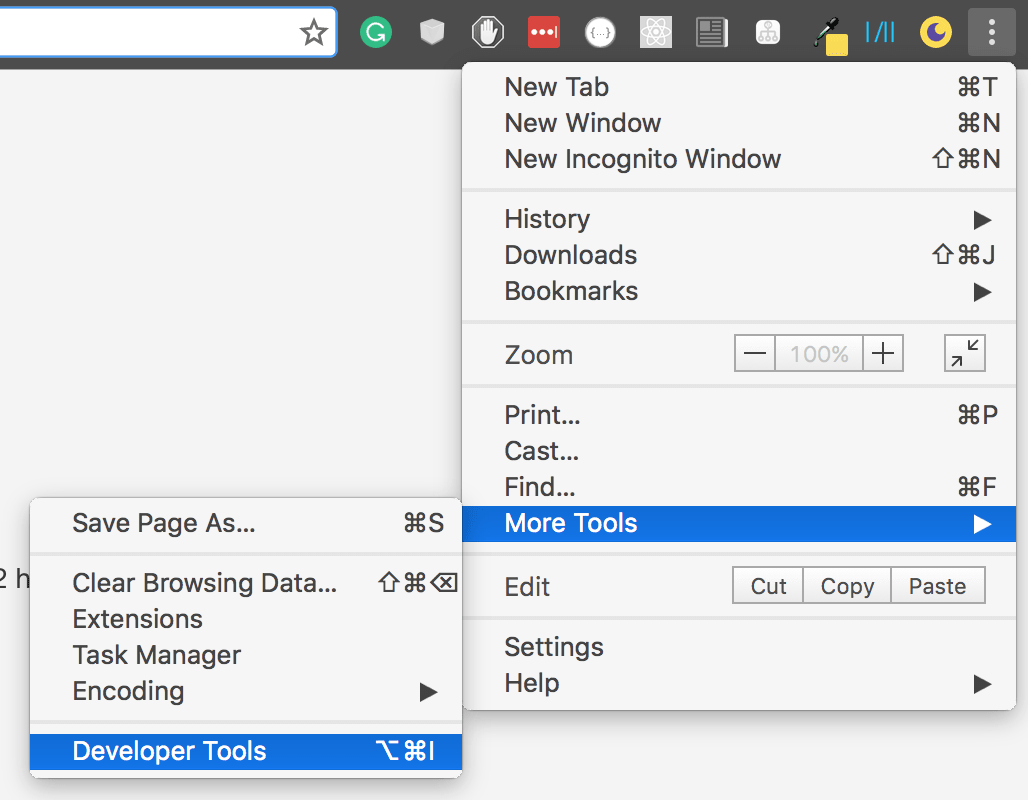
相反,我们将使用Chrome Dev Tools通过断点检查值。 断点是代码的一部分/行,我们希望在其中停止执行,以便我们可以仔细检查执行情况。 在浏览器中运行应用程序的情况下,点击右上角的菜单,然后依次点击更多工具>开发者工具 ,打开Chrome 开发工具
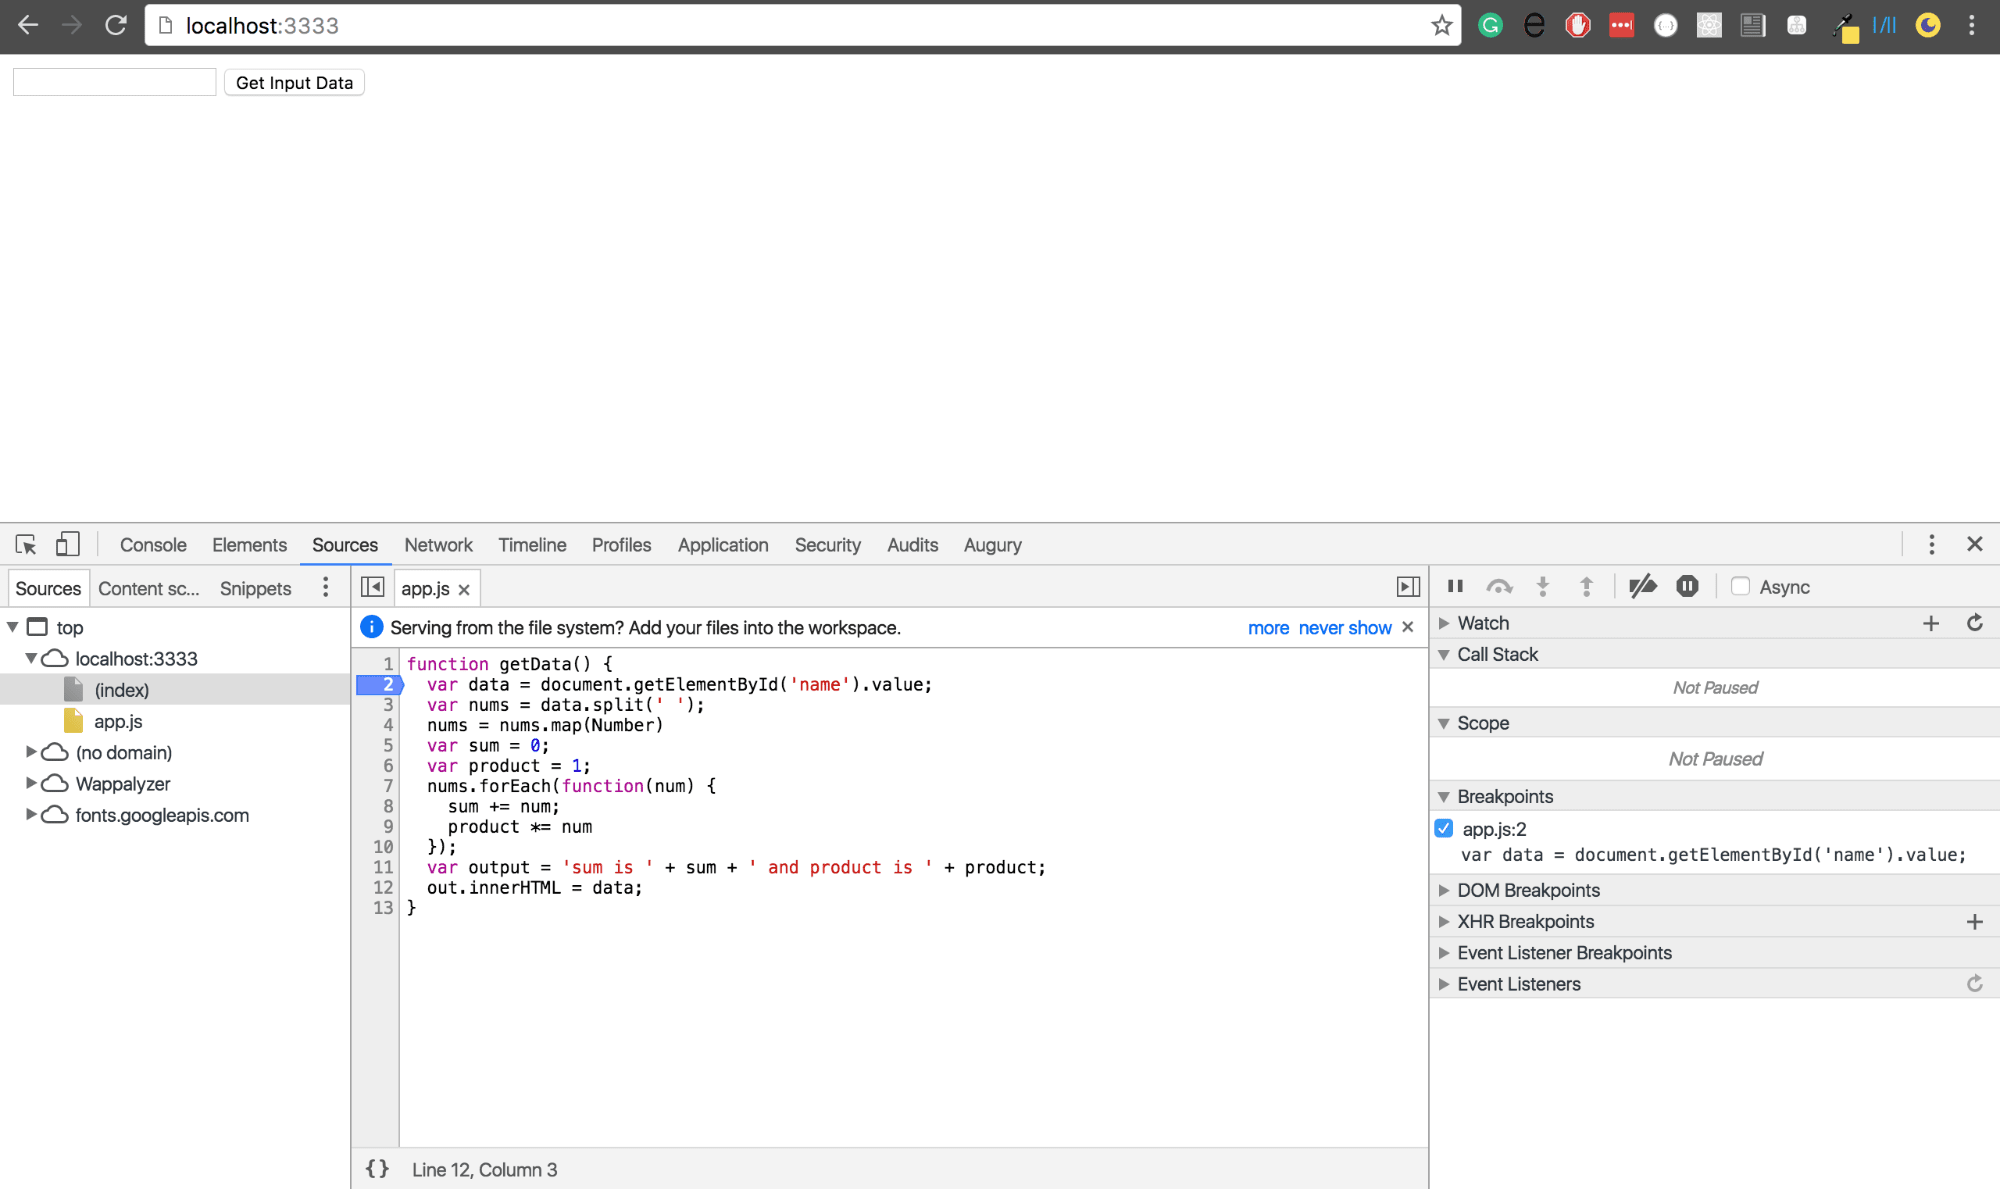
This opens up Chrome Dev Tools at the bottom of the browser. Select the Sources tab/panel. On the left panel, click on app.js, the JavaScript file that we wrote.
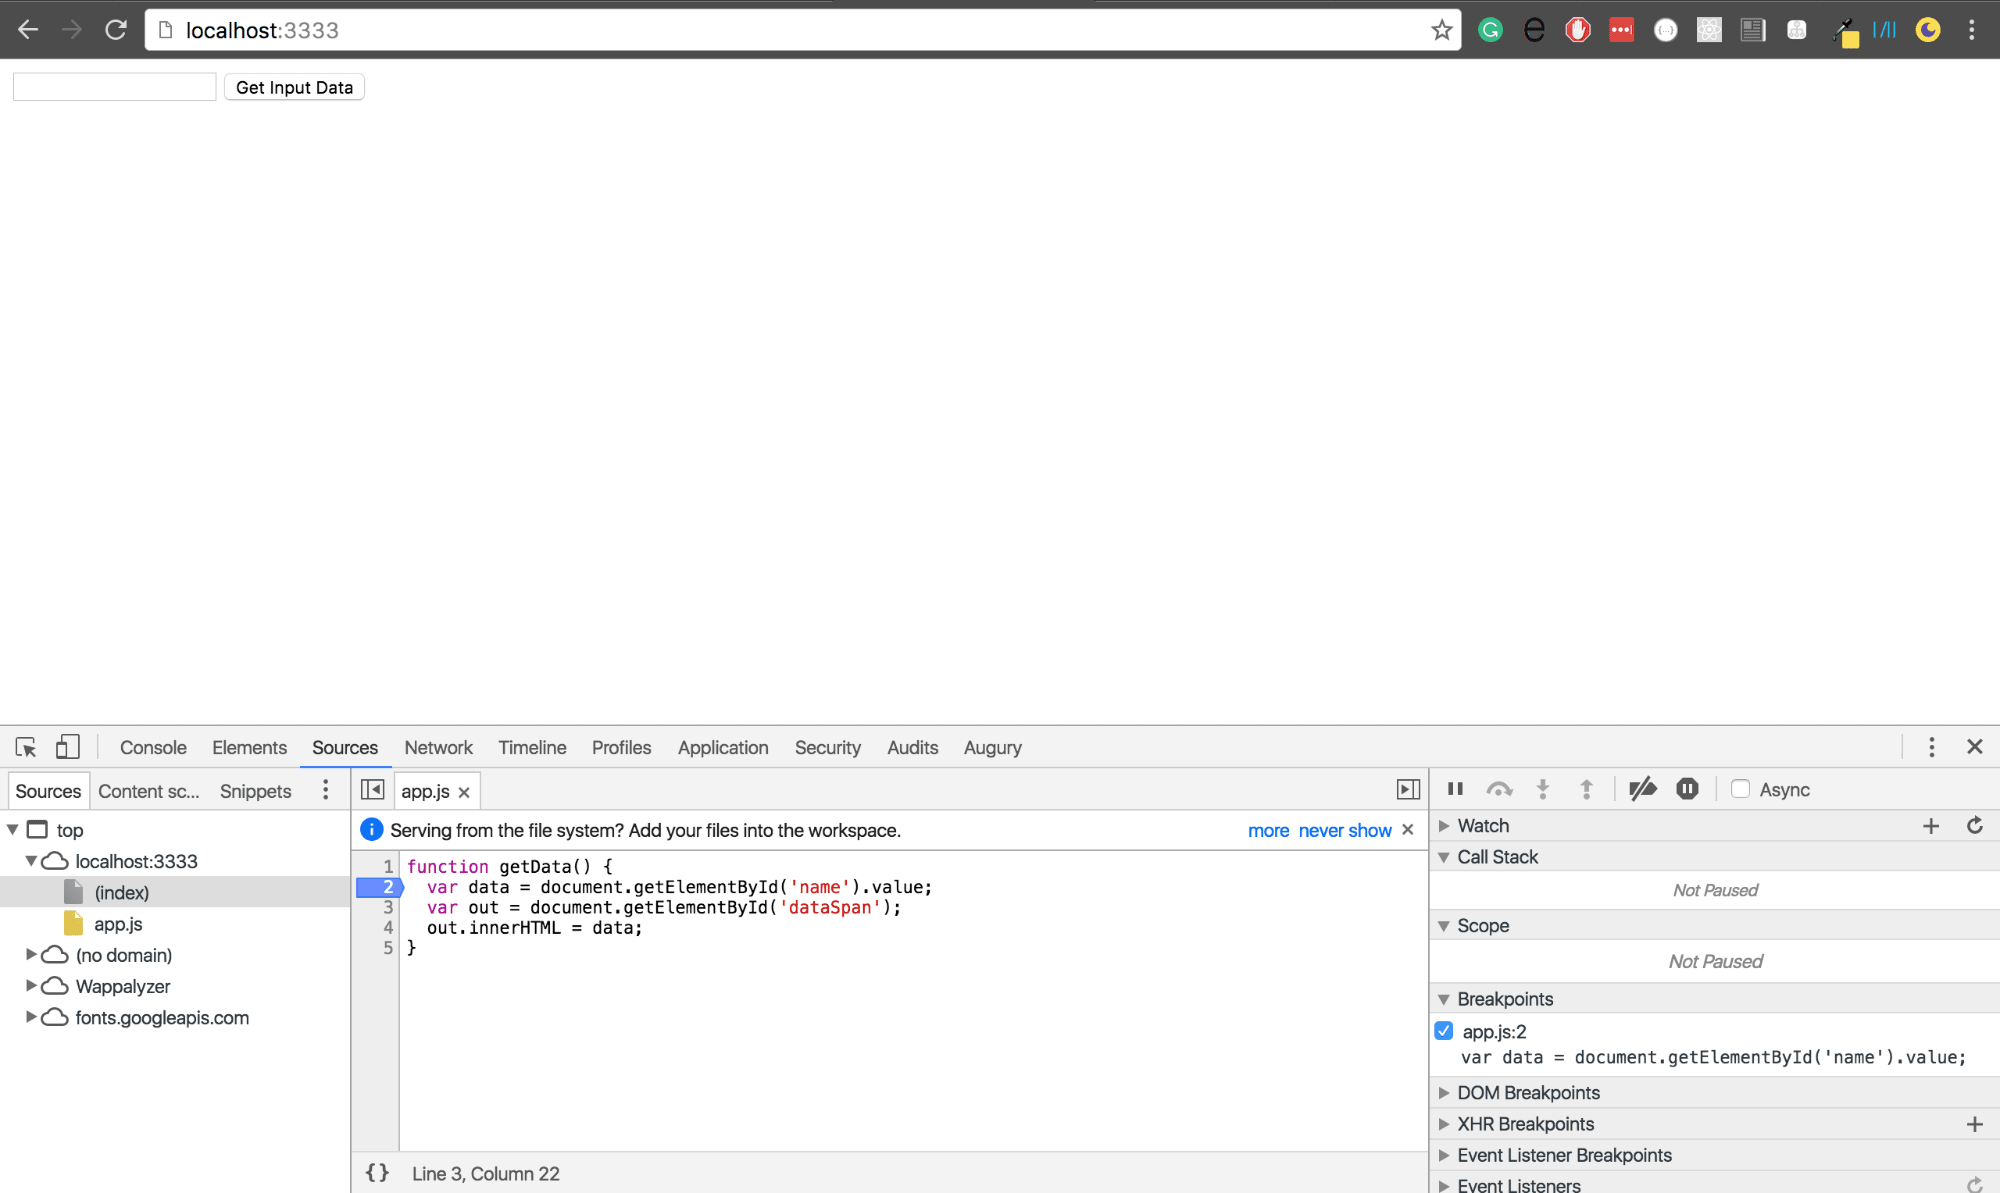
这将在浏览器底部打开Chrome开发工具。 选择“ 源”选项卡/面板。 在左侧面板上,单击我们编写JavaScript文件app.js。
Click on the line number in the middle section with the code var data = document.getElementById('name').value;. It should change color, in my case it's blue. Notice also that on the far right, the section under Breakpoints changes and includes the name of the file we have selected.
单击中间部分的代码为var data = document.getElementById('name').value;的行号var data = document.getElementById('name').value; 。 它应该改变颜色,在我的情况下是蓝色。 还要注意,在最右边,“ 断点”下的部分会更改并包括我们选择的文件的名称。
By clicking this line number, we have set a breakpoint on our code at that particular line of code. This means that when the function is run, its execution is supposed to stop where the breakpoint is. We should then be able to execute the code line by line, seeing changes made to our variables.
通过单击此行号,我们在该特定代码行的代码上设置了一个断点。 这意味着当函数运行时,应该在断点所在的位置停止执行。 然后,我们应该能够逐行执行代码,并查看对我们的变量所做的更改。
Enter hello world in the input field and click the button.
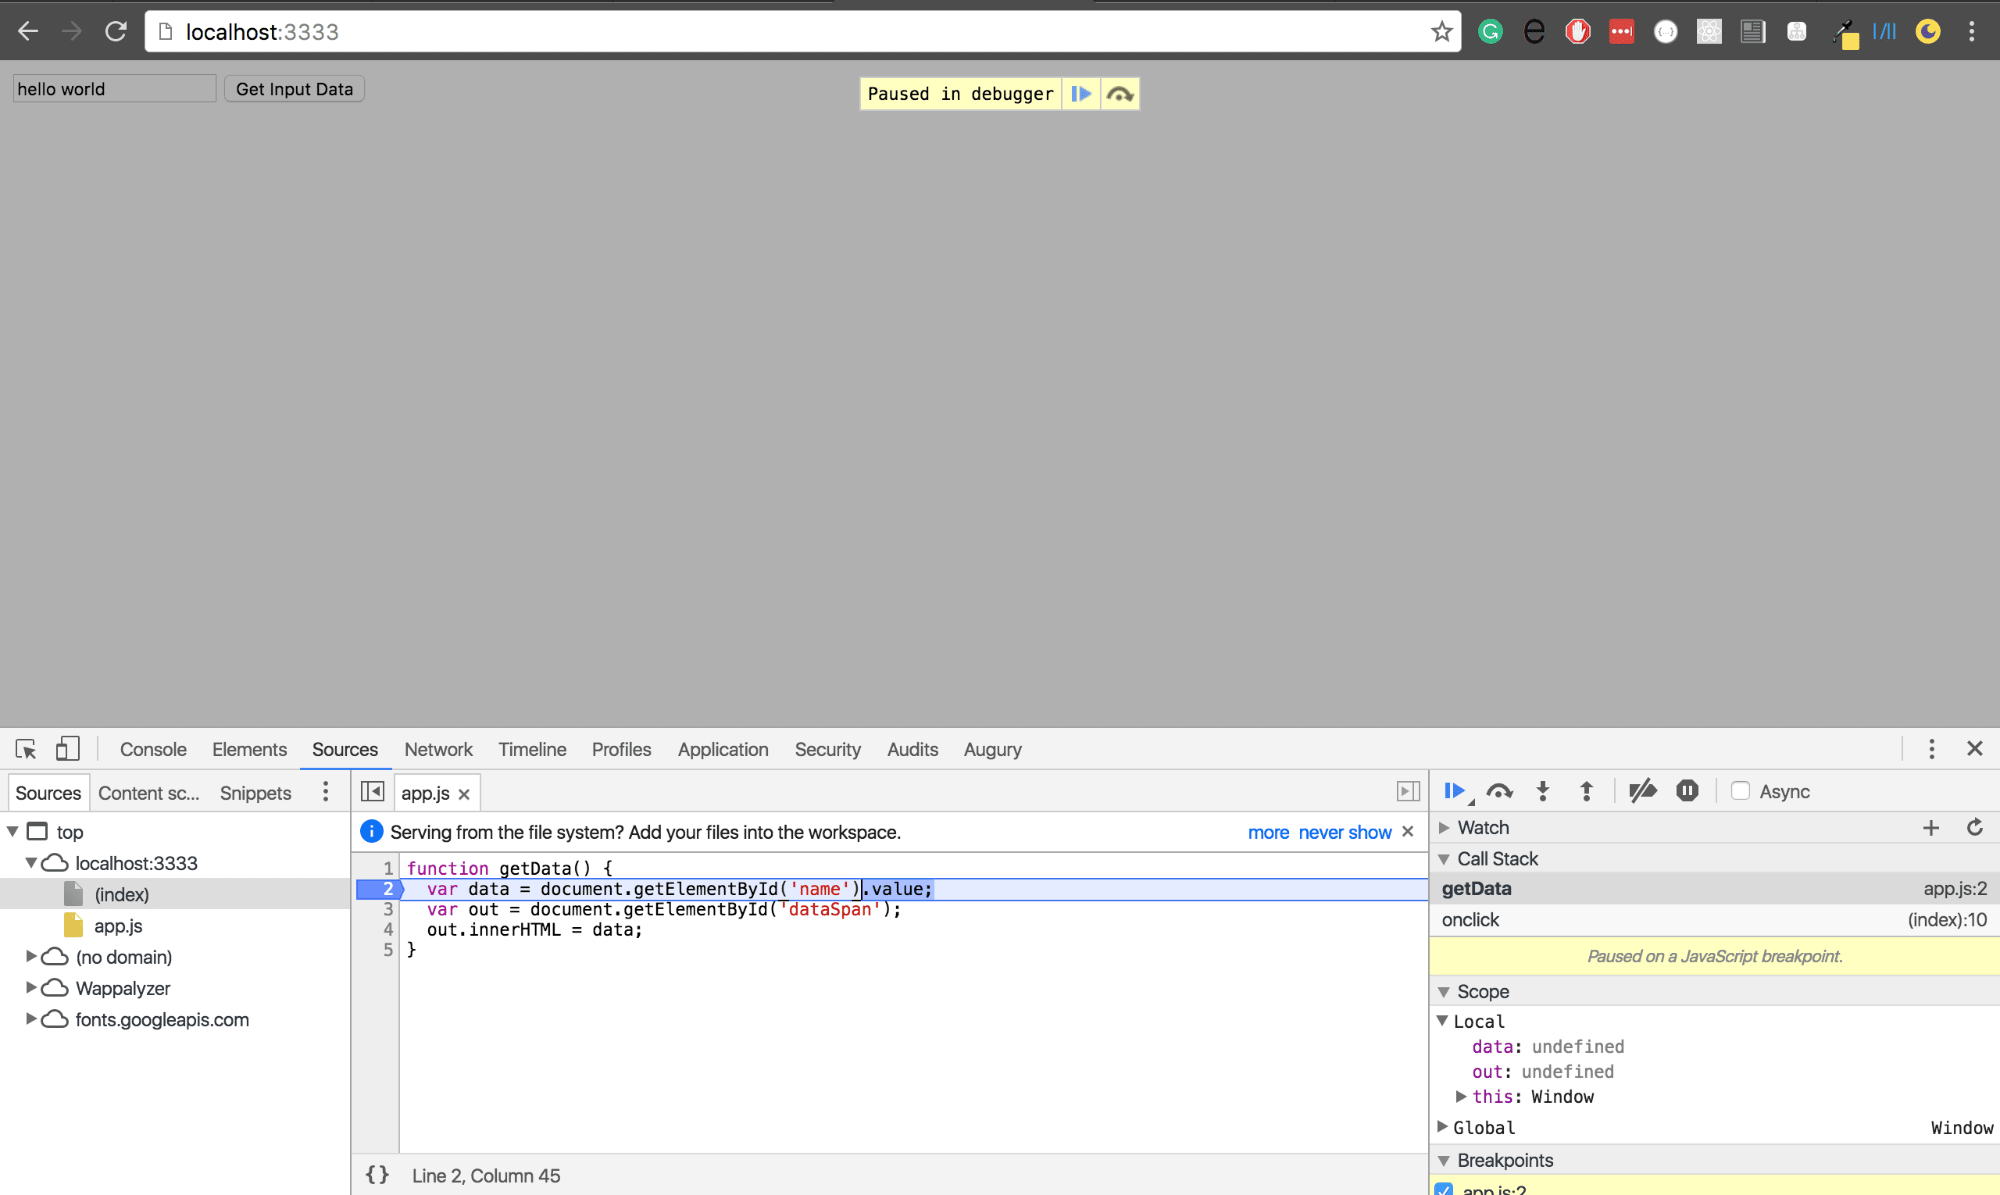
在输入字段中输入hello world ,然后单击按钮。
Notice a few things:
注意几件事:
- The **dataSpan** remained unchanged, which means the code that puts in data into that span tag has not run.
- The next execution line has been selected in the middle section of the Chrome Dev Tools
- There is an overlay in the browser with a section written **Paused in debugger** and two buttons afterwards.
    - The first button is for resuming the script execution. Clicking it will continue the execution of the script and exit the debugger.
    - The next button with a bent arrow pointing downwards is for stepping over the next function call. If we click it, the currently selected line will be executed, and the next line will be selected.
- On the far right of the dev tools, `getData` and `onclick` have been added to the **Call Stack** section. The CallStack holds a list of functions that have been called to run our code up to the point we have the breakpoint. Since we clicked the button, the  `onclick` event was raised, which in turn called the `getData` function.
- The **Scope** section on the far right also has the following section added.
    - **Local** which defines our local scope variable. These are variables which we have defined in our code. So we have `data`, `out` and `this`. `this` is present since we are running JavaScript in the browser, and it refers to the [window object](https://developer.mozilla.org/en-US/docs/Web/API/Window). Notice that at this point during execution, both `data` and `out` are `undefined` since we haven't assinged them values yet.
走进来,走出去,走过来 ( Stepping in, Stepping Out, Stepping Over )
Stepping in, stepping out and stepping over are common when debugging code using breakpoints. In the bottom right section of the Chrome Dev Tools, you will see a section that will enable you do any of the above actions.
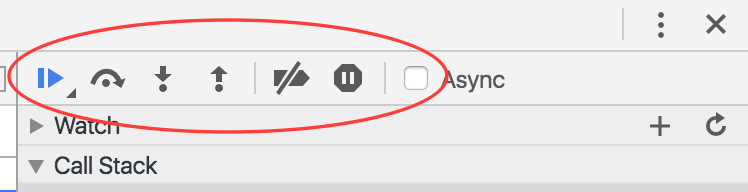 The first button with a play-pause-like sign is for resuming execution. It will continue executing our script to the end, unless we have another breakpoint. If this is the case, it will stop at the next breakpoint.
使用断点调试代码时插手 , 走出去和跨过很常见。 在Chrome开发者工具的右下部分,您会看到一个部分,可以执行上述任何操作。
- **Stepping Over** - The next button with a bent arrow pointing downwards and a dot is for *stepping over the next function call*. This is what you will use most of the time. It simply executes the current line, and stops at the next line.
- **Stepping Into ** - The next button with a downward pointing arrow is for *stepping into the next function call*. This takes the debugger into a function, if that line calls a certain function. E.g if `var x = getData()`, clicking step into the next function call will take the debugger into the `getData` function.
- **Stepping Out ** - The next button with an upward facing arrow is for *stepping out of the current function*. In our above example of `getData()`, clicking this will exit the function immediately and get us back to where it was called.
Click on Step Over next function call.
 The selected line with the breakpoint is executed and the debugger selects the next. On the far right, in the
data changes to
hello world, which is the text we typed into the input box
name. This is just a representation of our variables at this line of code. Pressing
Step over next function call again, the currently selected line is executed and next line is selected.
out in the Local scope changes to a dom element. You can click on the arrow beside it to expand it and view it's properties. Clicking on
Step Over next function call again will add the
hello world text to the
dataSpan in the browser window.
单击“ 跳过下一个函数调用” 。
执行带有断点的所选行,然后调试器选择下一行。 在最右边的“
data更改为“
hello world ,这是我们在输入框
name中键入的文本。 这只是这行代码中变量的表示。 再次按“
跳过下一个功能” ,将执行当前选择的行并选择下一行。
out的值更改为dom元素。 您可以单击箭头旁边的箭头将其展开并查看其属性。 再次单击“
跳过下一个”函数调用 ,将在浏览器窗口的
dataSpan中添加
hello world文本。
多一点调试 ( A little more debugging )
Say we wanted to perform a complex JavaScript function, which definitely needs debugging. For instance, we want users to input space separated numbers in the input field, and we will return both the sum and the product of the numbers.
假设我们要执行一个复杂JavaScript函数,这肯定需要调试。 例如,我们希望用户在输入字段中输入以空格分隔的数字,然后我们将返回数字的总和和乘积。
//app.js
function getData() {
  // Get space separated values from input
  var data = document.getElementById('name').value;

  // Get dataSpan DOM element
  var out = document.getElementById('dataSpan');

  // Convert data into an array of string
  var nums = data.split(' ');

  // Convert nums into an array of numbers
  nums = nums.map(Number)

  // Instantiate sum and product
  var sum = 0;
  var product = 1;

  // Calculate sum and product
  nums.forEach(function(num) {
    sum += num;
    product *= num
  });

  //Set text of dataspan to the result of sum and product
  var output = 'sum is ' + sum + ' and product is ' + product;
  out.innerHTML = data;
}
We've changed the app.js to look like above. Open the file in the browser and let's debug it.
 We've set the breakpoint on the line with
var data = document.getElementById('name').value; by clicking on the line number. Enter
23 24 e in the input. I've included the
e to induce an error since we can't add/mutlipy numbers and alphabets.
我们将app.js更改为上面的样子。 在浏览器中打开文件,然后进行调试。 var data = document.getElementById('name').value;设置断点var data = document.getElementById('name').value; 通过单击行号。 在输入中输入23 24 e 。 由于我们无法添加/替换数字和字母,因此我添加了e来引发错误。
Click on the Step Over next function call button
单击“ 跳过下一个函数调用”按钮
- `var data` is assigned `23 24 e`. And updated in the *Scope* section under Local, and beside the line of code in the middle section of the Chrome Dev Tools.
- Clicking *Step Over next function call* again, splits the string data into an array of strings using the built in [split](http://developer.mozilla.org/en-US/docs/Web/JavaScript/Reference/Global_Objects/String/split) function of JavaScript. Notice that the *Scope* variable `nums` is now an array of strings.
- Clicking *Step Over next function call* twice to initialize the sum and the product. They are updated in the scope variables `sum` and `product`.
-  *Step Over next function call* again, this runs the simple map function to convert all array elements into numbers.
A long version of the function would be
该功能的长版将是
nums= nums.map(function(value) {
        return Number(value);
    });
You can read more about the array map function.
您可以阅读有关数组映射功能的更多信息。
- By now, the scope on the right shows `nums` as an array of numbers. However, the last value is a `NaN` (NotANumber), since we tried to convert the letter 'e' into Number. We immediately can tell the our code has a bug. Let's continue to see what happens.
- Clicking *Step Over next function call* again, *Whoa* the bug persists, as it has affected both the sum and the product of our numbers.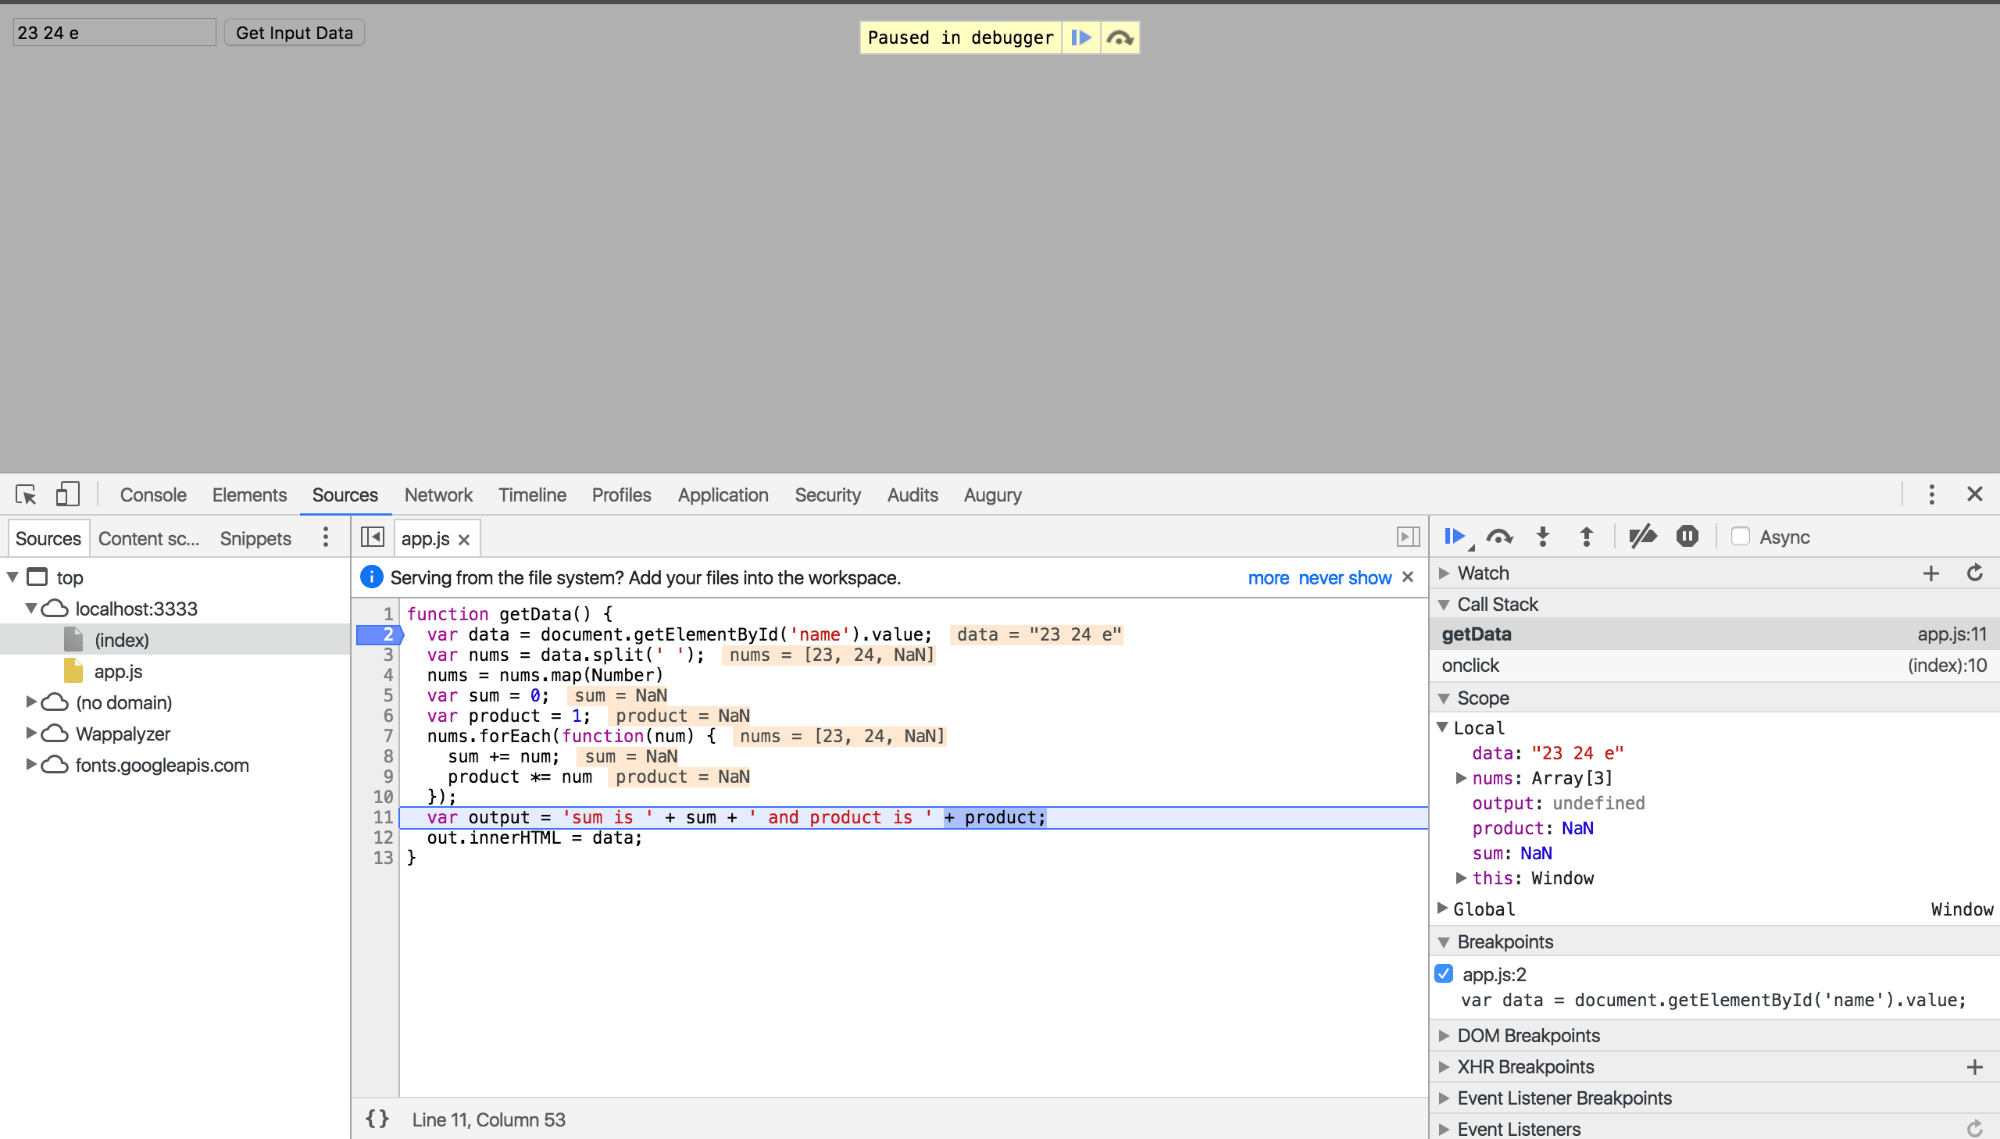 You can see that both the sum and product are now
NaN. This tells us immediately that we need to go fix our code.
NaN 。 这立即告诉我们我们需要修复代码。
添加断点的另一种方法 ( Another way to add Breakpoints )
Sometimes, or most times, you may have a lot of code, probably concatenated into one file. For instace, 1000 lines of code. Setting a breakpoint in the chrome dev tools by clicking on the Line of code may seem unrealistic.
有时,或者大多数时候,您可能有很多代码,可能被串联到一个文件中。 对于实例,需要1000行代码。 通过单击代码行在chrome开发工具中设置断点似乎不现实。
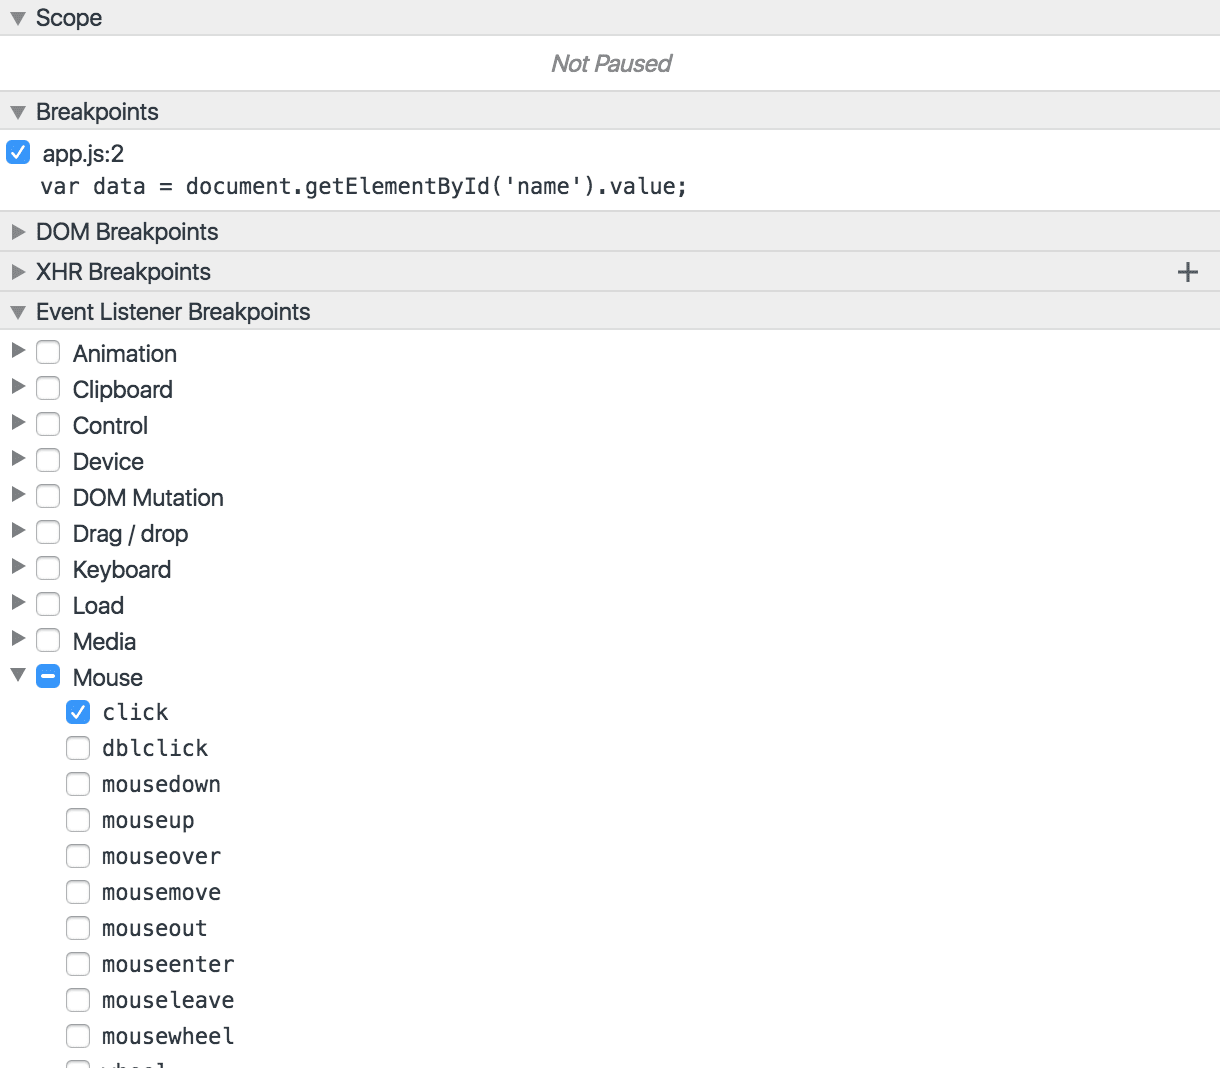
Chrome Dev Tools has a nifty feature for adding breakpoints based on common events that occur in the browser. On the far right of the dev tools, just after the breakpoints section, you will see categories of breakpoints.
 As you can see above, we've set breakpoints at every
mouse click event within our script. Clicking on the
Get Input Data without setting a manual breakpoint like we did earlier, should stop execution at where the
onclick function is, which in this case is in our html file.
Step Over next function call continuously will take you through the code involved in handling the
onclick method.
Chrome开发者工具具有一个漂亮的功能,可根据浏览器中发生的常见事件添加断点。 在开发工具的最右边,在断点部分之后,您将看到断点的类别。
如您在上面看到的,我们在脚本中的每个
mouse click事件处都设置了断点。 单击
获取输入数据而不像我们之前那样设置手动断点,应该在
onclick函数所在的位置停止执行,在这种情况下,该函数位于我们的html文件中。
跳过下一个函数”调用将带您完成处理
onclick方法所涉及的代码。
From the Event Listener Breakpoints section, you see that you can add breakpoints for a lot of events, including touch, keyboard and XHR.
从“ 事件监听器断点”部分,您可以为很多事件添加断点,包括touch , keyboard和XHR 。
调试器关键字 ( The debugger key word )
When you put the keyword debugger anywhere in your JavaScript code, the execution of that code will stop at that line and the chrome dev tools will be openned, highlighting the line where the execution has stopped, just as we set the breakpoint when we started. You could use this feature to debug JavaScript in chrome and other browsers. Our initial example would be:-
当您在JavaScript代码中的任意位置放置关键字debugger ,该代码的执行将在该行停止,并且chrome dev工具将被打开,突出显示执行已停止的行,就像我们在启动时设置断点一样。 您可以使用此功能在chrome和其他浏览器中调试JavaScript。 我们最初的例子是:
//app.js
function getData() {
  debugger;
  // Get value of input
  var data = document.getElementById('name').value;

  // Code commented out for brevity
}
The above code would stop execution just where the debugger keyword is and open chrome dev tools. It's equivalent to setting a breakpoint at that particular line of code. You can the Step Into and Over the lines as we did earlier.
上面的代码将在debugger关键字所在的位置停止执行,并打开chrome dev工具。 这等效于在该特定代码行设置断点。 您可以像我们之前那样逐步进入和结束。
结论 ( Conclusion )
Doing the little debugging we have done here using either console.log() or alert() would have taken us back and forth between the browser and our code. We would probably have had a couple of console.log and alert statements to get to where we are.
使用console.log()或alert()进行一些小的调试,我们会在浏览器和代码之间来回移动。 我们可能会有几个console.log和alert语句到达我们所在的位置。
When your codebase becomes bigger and bigger, Chrome Dev Tools breakpoints could really be helpful in figuring out where the bugs are, and just general debugging.
当您的代码库越来越大时,Chrome Dev Tools断点对于确定错误的位置以及常规调试确实很有帮助。
小费 (Tip)
If you like a dark theme for your Chrome Dev Tools, simply click on the menu icon just before the close button within the chrome dev tools, then go to Settings > General, under Appearance go to Theme and select Dark.
如果您喜欢Chrome开发工具的深色主题,只需在chrome开发工具中的关闭按钮前单击菜单图标,然后依次转到“设置”>“常规” ,在“ 外观 ”下转到“ 主题”,然后选择“ 深色” 。
翻译自: https://scotch.io/tutorials/debugging-javascript-with-chrome-devtools-breakpoints


 2093
2093

 被折叠的 条评论
为什么被折叠?
被折叠的 条评论
为什么被折叠?
 到【灌水乐园】发言


