


The Linux top command is one of the stalwarts of Unix-like operating systems. Its utilitarian display is packed with useful information about your system’s running processes and resource usage. But, did you know it also supports color, highlighting, and even elementary graphs?
Linux top命令是类Unix操作系统的坚强后盾之一。 它的实用程序显示中包含有关系统正在运行的进程和资源使用情况的有用信息。 但是,您知道它还支持颜色,突出显示甚至基本图形吗?
信息密集的仪表板 (An Information-Packed Dashboard)
The top command has been around since 1984, and there are many variants of it. For this article, we’re running Ubuntu 18.04 with all patches applied, and version 3.3.12 of top. We also cross-referenced everything on two other test computers, one running Fedora and the other Manjaro.
自1984年以来一直是 top司令部,它有许多变体。 对于本文,我们将运行已应用所有补丁的Ubuntu 18.04,以及top 3.3.12版本。 我们还交叉引用了其他两台测试计算机上的所有内容,其中一台运行Fedora,另一台运行Manjaro。
The default top display crams as much information as possible in the terminal window. Information is a prerequisite to administration, so this is a good thing. One of the traits of a good system administrator is the ability to identify emerging problems and deal with them before they affect service. top gives you a dashboard of many different system metrics that help you do just that.
默认的top显示会在终端窗口中填充尽可能多的信息。 信息是管理的先决条件,所以这是一件好事。 优秀的系统管理员的特征之一是能够识别新出现的问题,并在它们影响服务之前进行处理。 top为您提供了一个包含许多不同系统指标的仪表板,可以帮助您做到这一点。
The display is best described as functional, rather than intuitive, and abbreviations abound. When you first encounter top, it feels cramped, cryptic, and off-putting. With a few keypresses, though, you can tune the contents and format of the display according to what’s important to you.
最好将显示描述为实用的,而不是直观的,并且缩写很多。 第一次遇到top ,会感到局促,晦涩难懂且令人反感。 但是,只需按几下键,您就可以根据对您重要的内容调整显示的内容和格式。
检查您的top版本 (Check Your Version of top)
To check which version of top you have, type the following a terminal window:
要检查您拥有的top版本,请输入以下终端窗口:
top -v
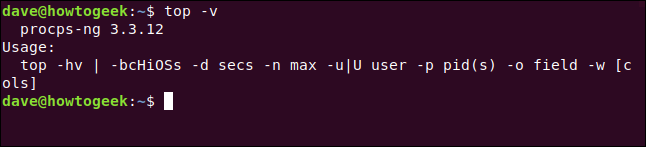
If your version is way behind 3.3.12, it might not support all the features we’re going to cover.
如果您的版本落后于3.3.12,则可能不支持我们将介绍的所有功能。
默认显示 (The Default Display)
You can start top by typing the following and hitting “Enter”:
您可以通过键入以下内容并单击“ Enter”来开始创建top :
top

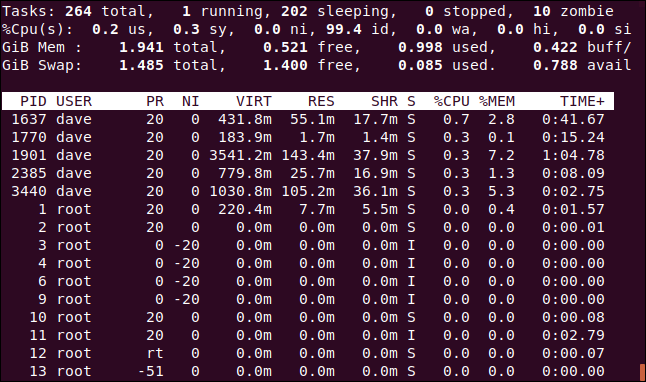
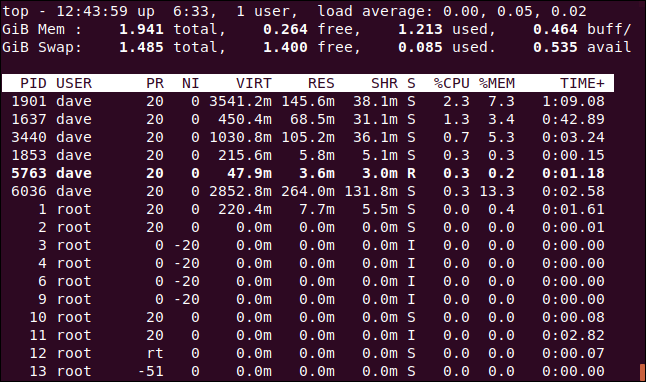
The default display contains two areas of information: the summary area (or dashboard), and the task area (or process list). By default, top updates its display every three seconds—you’ll notice a slight flicker when it does.
默认显示包含两个信息区域:摘要区域(或仪表板)和任务区域(或过程列表)。 默认情况下, top每三秒钟更新一次显示-当它出现时,您会注意到轻微的闪烁。
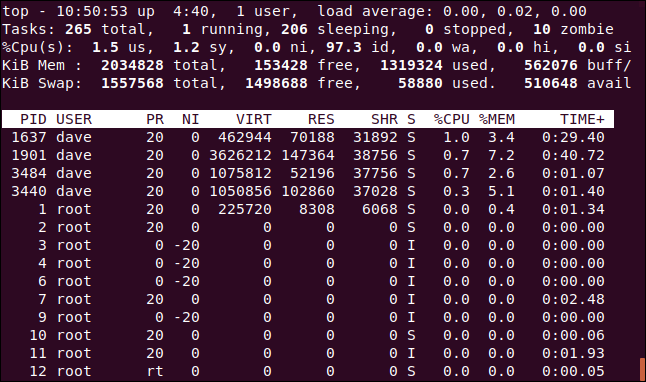
The first line of numbers on the dashboard includes the time, how long your computer has been running, the number of people logged in, and what the load average has been for the past one, five, and 15 minutes. The second line shows the number of tasks and their states: running, stopped, sleeping, or zombie.
仪表板上的第一行数字包括时间,计算机已运行多长时间,登录的人数以及过去一分钟,五分钟和15分钟的平均负载量 。 第二行显示任务的数量及其状态:正在运行,已停止,正在睡眠或处于僵尸状态 。
The third line displays the following central processing unit (CPU) values:
第三行显示以下中央处理器 (CPU)值:
us: Amount of time the CPU spends executing processes for people in “user space.”
我们: CPU在“用户空间”中为人们执行进程所花费的时间。
sy: Amount of time spent running system “kernel space” processes.
sy:运行系统“内核空间”进程所花费的时间。
ni: Amount of time spent executing processes with a manually set nice value.
ni:使用手动设置的nice值执行流程所花费的时间。
id: Amount of CPU idle time.
id: CPU空闲时间。
wa: Amount of time the CPU spends waiting for I/O to complete.
wa: CPU等待I / O完成所花费的时间。
hi: Amount of time spent servicing hardware interrupts.
嗨:服务硬件中断所花费的时间。
si: Amount of time spent servicing software interrupts.
si:服务软件中断所花费的时间。
st: Amount of time lost due to running virtual machines (“steal time”).
st:由于运行虚拟机而损失的时间量(“窃取时间”)。
The fourth line shows the total amount (in kibibytes) of physical memory, and how much is free, used, and buffered or cached.
第四行显示了物理内存的总量( 以千字节为单位 ),以及有多少空闲,已使用以及已缓冲或缓存。
The fifth line shows the total amount (also in kibibytes) of swap memory, and how much is free, used, and available. The latter includes memory that’s expected to be recoverable from caches.
第五行显示交换内存的总量(也以千字节为单位),以及空闲,已使用和可用的内存量。 后者包括可以从缓存中恢复的内存。
The column headings in the process list are as follows:
流程列表中的列标题如下:
PID: Process ID.
PID:进程ID。
USER: The owner of the process.
USER:流程的所有者。
PR: Process priority.
PR:流程优先级。
NI: The nice value of the process.
NI:这个过程很有价值。
VIRT: Amount of virtual memory used by the process.
VIRT:进程使用的虚拟内存量。
RES: Amount of resident memory used by the process.
RES:进程使用的驻留内存量。
SHR: Amount of shared memory used by the process.
SHR:进程使用的共享内存量。
S: Status of the process. (See the list below for the values this field can take).
S:进程状态。 (有关此字段可以采用的值,请参见下面的列表)。
%CPU: The share of CPU time used by the process since the last update.
%CPU:自上次更新以来进程使用的CPU时间的份额。
%MEM: The share of physical memory used.
%MEM:使用的物理内存份额。
TIME+: Total CPU time used by the task in hundredths of a second.
TIME +:任务使用的总CPU时间,以百分之一秒为单位。
COMMAND: The command name or command line (name + options).
COMMAND:命令名称或命令行(名称+选项)。
Memory values are shown in kibibytes. The COMMAND column is off-screen, to the right—it didn’t fit in the image above, but we’ll see it shortly.
内存值以千字节为单位显示。 COMMAND列在屏幕外,在右侧-不适合上图,但我们很快就会看到。
The status of the process can be one of the following:
进程的状态可以是以下之一:
D: Uninterruptible sleep
D:不间断的睡眠
R: Running
R:跑步
S: Sleeping
S:睡觉
T: Traced (stopped)
T:已追踪(已停止)
Z: Zombie
Z:僵尸
Press Q to exit top.
按Q退出top 。
滚动显示 (Scrolling the Display)
You can press the Up or Down Arrows, Home, End, and Page Up or Down keys to move up and down and access all the processes.
您可以按向上或向下箭头,Home,End和Page Up或Down键向上和向下移动并访问所有过程。
Press the Left or Right Arrow to move the process list sideways. This is useful to see any columns that don’t fit within the confines of the terminal window.
按向左或向右箭头可将过程列表向侧面移动。 这对于查看不在终端窗口范围内的任何列很有用。
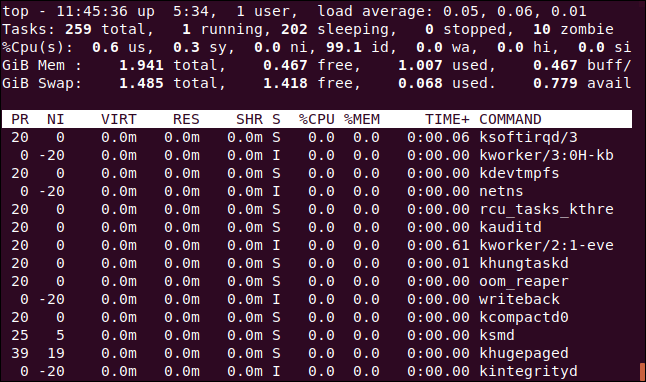
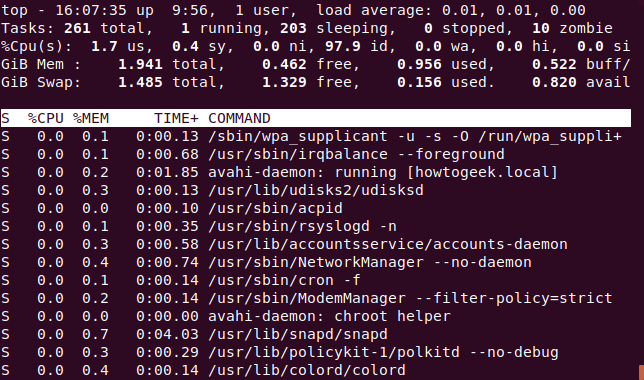
In the image below, we’ve pressed the Right Arrow a few times to see the COMMAND column.
在下图中,我们多次按向右箭头以查看COMMAND列。
更改数值单位 (Changing the Numeric Units)
Let’s change the display units to sensible values. Press capital E to cycle through the units used to display memory values in these options: kibibytes, mebibytes, gibibytes, tebibytes, pebibytes, and exbibytes. The unit in use is the first item on lines four and five.
让我们将显示单位更改为合理的值。 按大写字母E可以循环显示以下选项中用于显示内存值的单位:吉字节,兆字节,千兆字节,兆字节,百兆字节和exbibytes。 使用的单元是第四行和第五行的第一项。
Press lowercase “e” to do the same thing for the values in the process list: kibibytes, mebibytes, gibibytes, tebibytes, and pebibytes.
按小写的“ e”对进程列表中的值执行相同的操作:吉字节,兆字节,千兆字节,兆字节和PB。
We pressed E to set the dashboard memory units to gibibytes and “e” to set the process list memory units to mebibytes.
我们按E将仪表板存储单元设置为千兆字节,按“ e”将进程列表存储单元设置为兆字节。
更改摘要内容 (Changing the Summary Contents)
You can change the display settings for the lines in the dashboard or remove them completely.
您可以更改仪表板上各行的显示设置,也可以完全删除它们。
Press l to toggle the load summary line (the first line) on or off. We removed the load summary line in the image below.
按l键打开或关闭负载汇总行(第一行)。 我们在下图中删除了负载摘要行。
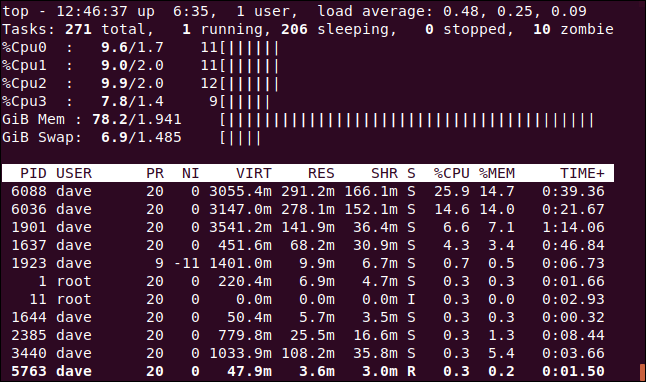
If you have a multi-core CPU, press 1 to change the display and see individual statistics for each CPU. There are four CPUs on our computer. We press 1 to see how hard each of them is working.
如果您有多核CPU ,请按1更改显示并查看每个CPU的单独统计信息。 我们的计算机上有四个CPU。 我们按1查看他们每个人的努力程度。
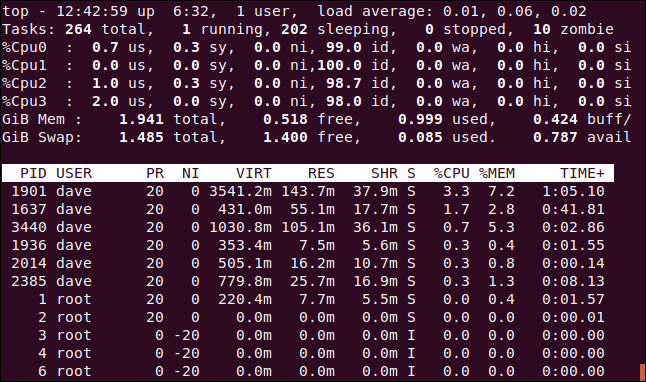
Of course, this takes up more screen real estate within the terminal window.
当然,这会占用终端窗口中更多的屏幕空间。
You can press “t” to swap the CPU displays to simple ASCII graphs that show the percentage of usage for each CPU.
您可以按“ t”将CPU显示切换为简单的ASCII图,显示每个CPU的使用百分比。
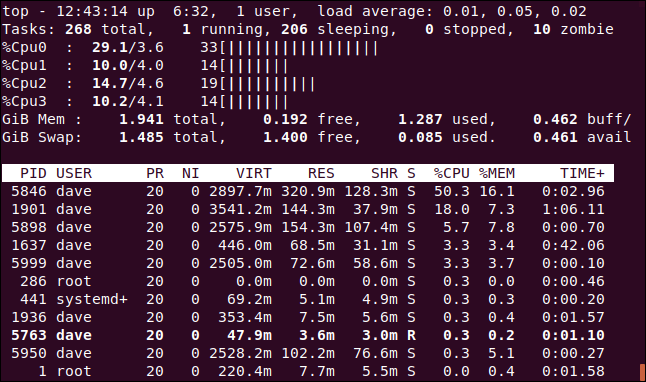
For each CPU, top displays three numbers and the graph. From left to right, the numbers are as follows:
对于每个CPU, top显示三个数字和图形。 从左到右,数字如下:
The combined
usandnipercentage (user space+tasks with nonstandard nice settings).us和ni百分比的总和(用户空间+具有非标准尼斯设置的任务)。The
sypercentage (kernel space).sy百分比(内核空间)。- The total (rounded to an integer value). 总数(四舍五入为整数值)。
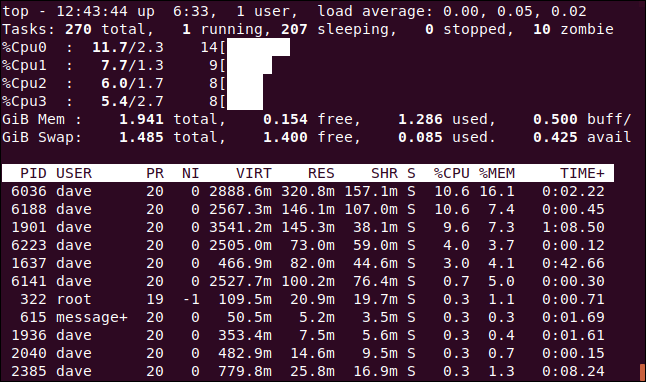
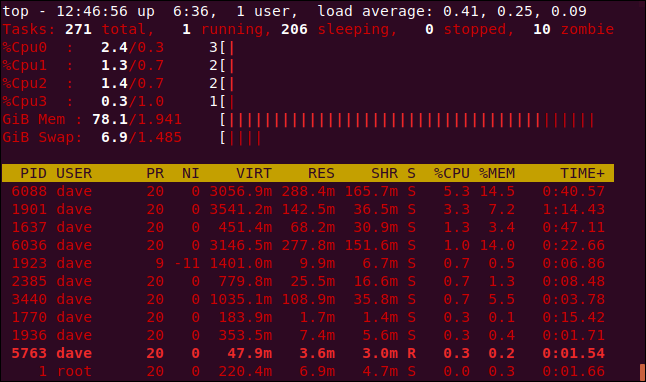
Press “t” again to change the graph display to solid block characters.
再次按“ t”将图形显示更改为实心块字符。
Press “t” once more to remove the CPU display and task summary line completely.
再按一次“ t”完全删除CPU显示和任务摘要行。
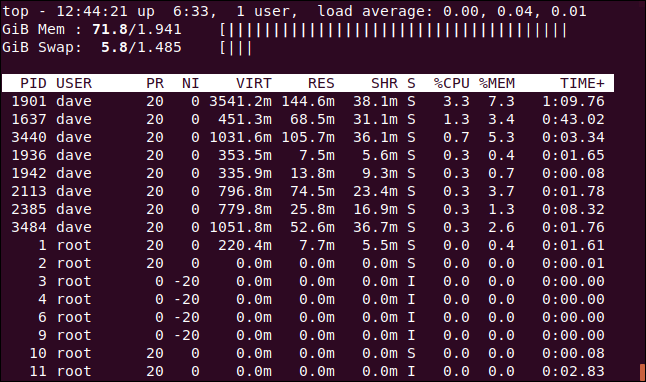
Press “m” to cycle the memory and swap memory lines through different display options. The first press replaces the statistics with an ASCII graph.
按“ m”可在不同的显示选项之间循环存储和交换存储线。 第一次按将统计信息替换为ASCII图。
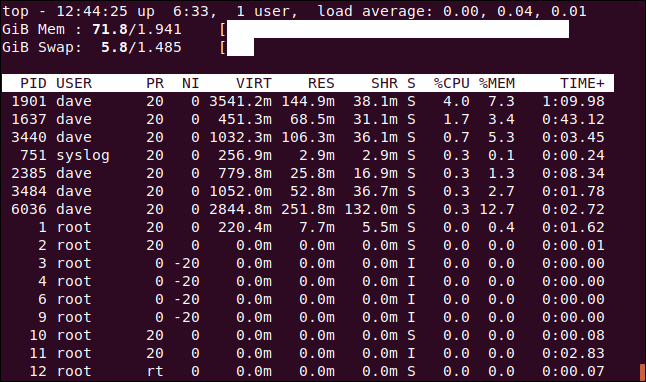
Another press changes the graph to block characters.
再按一次可更改图形以阻止字符。
Press “m” once more to remove the CPU lines altogether.
再按一次“ m”以完全删除CPU行。
If you want, you can see CPU and memory graphs at the same time. Just press “t” and “m” until you get the combination you want.
如果需要,您可以同时查看CPU和内存图。 只需按“ t”和“ m”,直到获得所需的组合。
颜色和突出显示 (Color and Highlighting)
You can press “z” to add color to the display.
您可以按“ z”为显示屏添加颜色。
When you think of top, you probably don’t think of colored displays and ASCII graphs, but they’re built right in.
当您想到top ,您可能不会想到彩色显示器和ASCII图,但是它们是内置的。
Press “y” to highlight running tasks in the process list. Pressing “x” highlights the column used to sort the process list. You can toggle between bold and reversed text highlighting by pressing “b.”
按“ y”突出显示进程列表中正在运行的任务。 按“ x”突出显示用于对过程列表进行排序的列。 您可以通过按“ b”在粗体和反向文本突出显示之间切换。
按列排序 (Sorting by Columns)
By default, the process list is sorted by the %CPU column. You can change the sort column by pressing the following:
默认情况下,进程列表按%CPU列排序。 您可以通过按以下内容更改排序列:
P: The
%CPUcolumn.P:
%CPU列。M: The
%MEMcolumn.M:
%MEM列。N: The
PIDcolumn.N:
PID列。T: The
TIME+column.T: “
TIME+列。
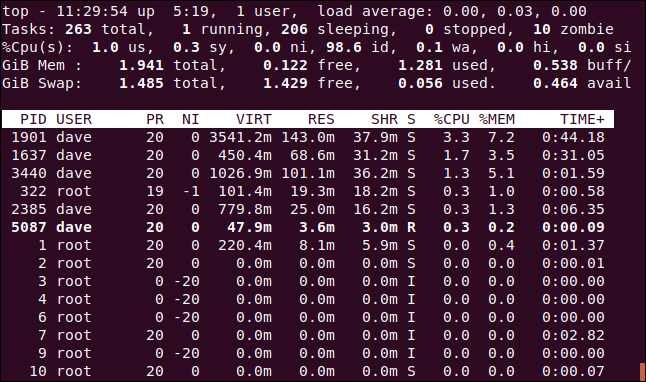
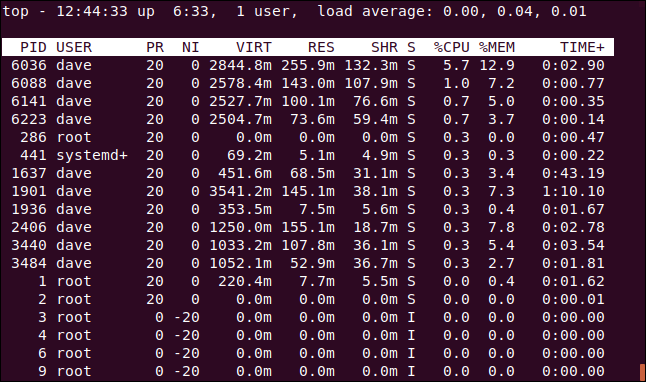
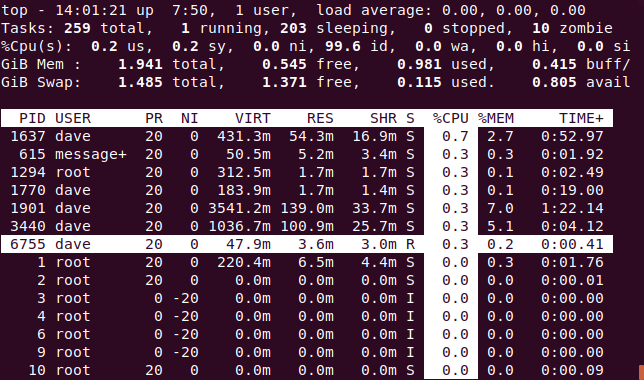
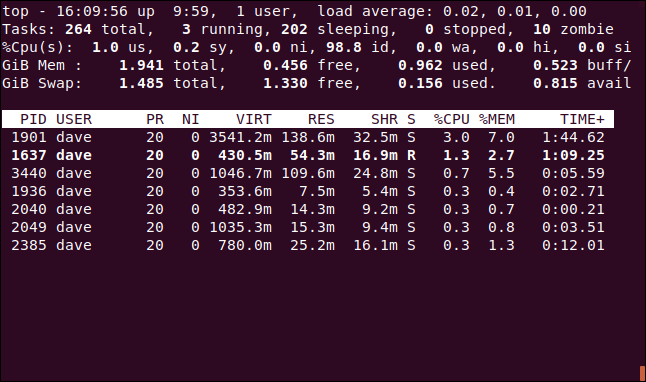
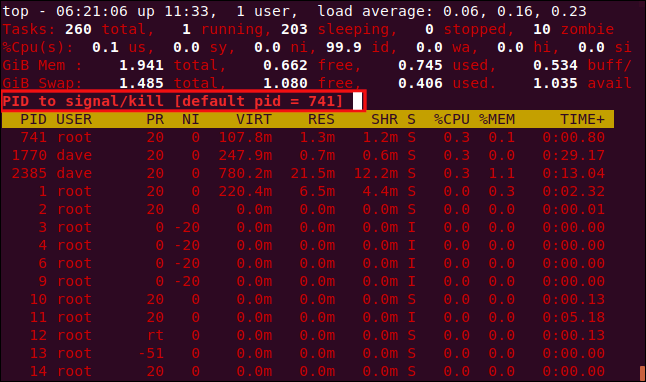
In the image below, the process list is sorted by the PID column.
在下图中,过程列表按PID列排序。
查看完整的命令行 (See the Full Command Line)
Pressing “c” toggles the COMMAND column between displaying the process name and the full command line.
按“ c”可在显示进程名称和完整命令行之间切换COMMAND列。
To see a “tree” of processes that were launched or spawned by other processes, press V.
要查看由其他进程启动或产生的进程的“树”,请按V。
请参阅单个用户的流程 (See Processes for a Single User)
Press “u” to see the processes for a single user. You’ll be prompted for the name or UID.
按“ u”查看单个用户的过程。 系统将提示您输入名称或UID 。
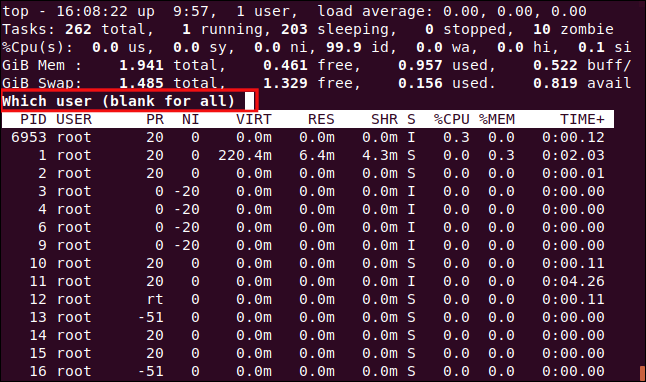
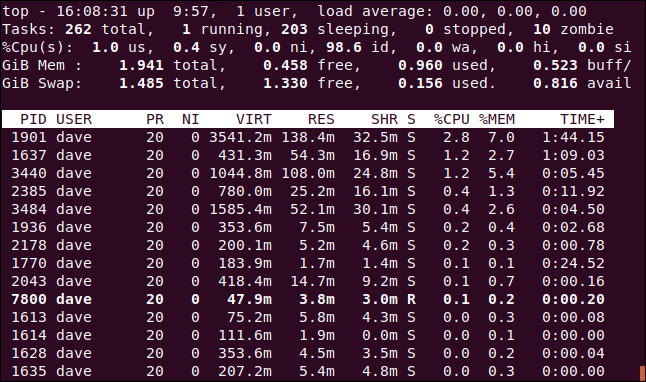
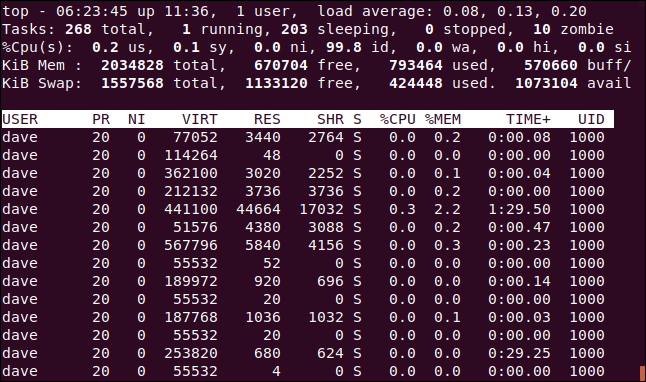
Type the name of the UID of the person you want to monitor. We’ll type “dave” and hit “Enter.” Now, the only processes in the task area belong to the user dave.
输入您要监视的人的UID的名称。 我们将输入“ dave”并点击“ Enter”。 现在,任务区域中仅有的进程属于用户dave 。
仅查看活动任务 (Only See Active Tasks)
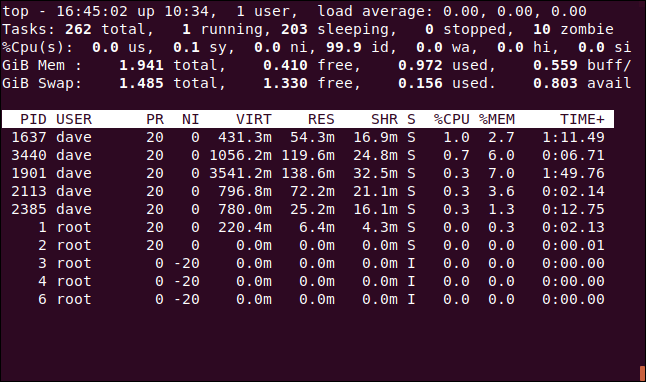
Press I to see only active tasks.
按I仅查看活动任务。
Tasks that haven’t consumed any CPU since the last update won’t be shown.
自上次更新以来未消耗任何CPU的任务将不会显示。
设置要显示的进程数 (Set How Many Processes to Display)
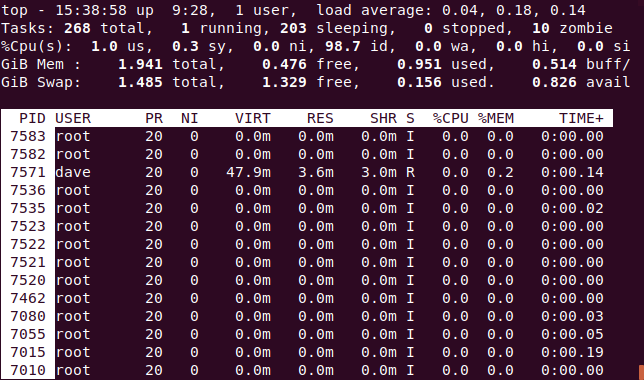
Press “n” to limit the display to a certain number of lines, regardless of whether the tasks are active. You’ll be prompted for the number of processes to display.
无论任务是否处于活动状态,按“ n”将显示限制为一定的行数。 系统将提示您输入要显示的进程数。
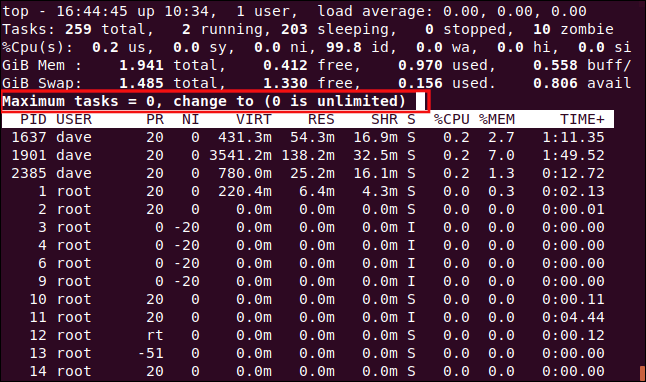
We typed 10 and pressed Enter, so 10 processes appear in the task area.
我们键入10并按Enter,所以10个进程出现在任务区域中。
Renice一个过程 (Renice a Process)
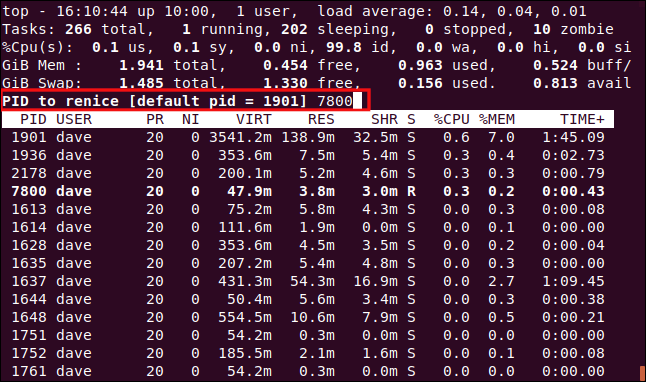
You can press “r” to change the nice value (priority) for a process. You’ll be prompted for the process ID. Just press Enter to use the process ID of the task at the top of the process window. We type 7800, which happens to be the process ID of an instance of Firefox.
您可以按“ r” 更改流程的合适值(优先级) 。 系统将提示您输入进程ID。 只需按Enter键即可使用流程窗口顶部的任务的流程ID。 我们输入7800,它恰好是Firefox实例的进程ID。
After you hit Enter, you’re prompted for the new nice value to apply to the process. We type 15, and then press Enter.
按下Enter键后,系统会提示您输入新的nice值以应用于该过程。 我们键入15,然后按Enter。
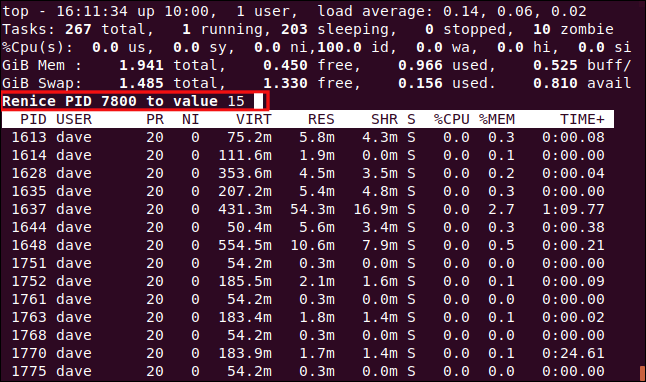
The new nice value is applied to the process immediately.
新的nice值将立即应用于流程。
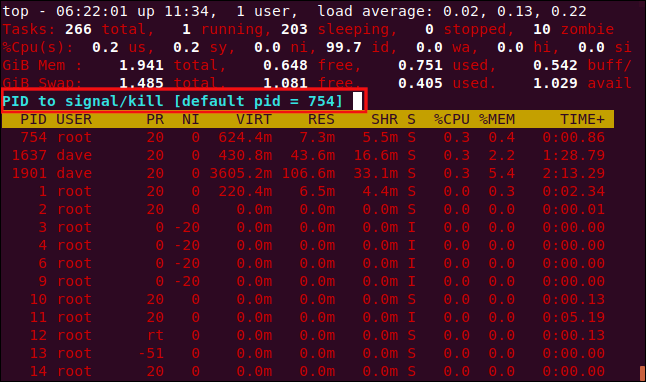
杀死进程 (Kill a Process)
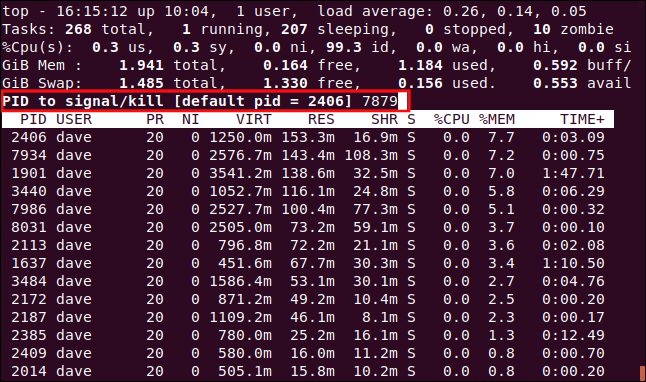
Press “k” to kill a process. You’ll then be prompted for the process ID you want to kill. In fact, you can send any signal to the process. We’re going to kill process 7879, which has stopped responding.
按“ k” 杀死一个进程 。 然后将提示您输入要杀死的进程ID。 实际上,您可以向该过程发送任何信号。 我们将终止进程7879,该进程已停止响应。
You’ll be offered the chance to type the signal you want to send. You can specify it by name or number. If you simply hit Enter, top sends the SIGTERM (kill) signal.
您将有机会键入要发送的信号。 您可以按名称或数字指定它。 如果您只是按Enter键,则top发送SIGTERM (杀死)信号。
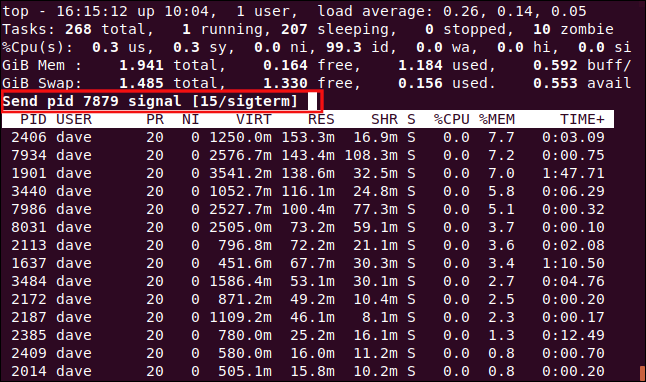
As soon as you hit Enter, the signal is sent to the process.
按下Enter键后,信号即被发送到该过程。
自定义显示 (Customizing the Display)
You can also customize the colors and columns that are displayed. We’re going to change the color used for prompts, the default for which is red.
您还可以自定义显示的颜色和列。 我们将更改用于提示的颜色,默认颜色为红色。
Press capital Z to go to the color settings page. The top part of the screen shows the colors in use by the different display elements. To indicate which display element you want to change, press one of the following, which are case sensitive:
按大写字母Z转到颜色设置页面。 屏幕的顶部显示了不同显示元素使用的颜色。 要指示您要更改的显示元素,请按下列之一(区分大小写):
S: Summary Data area.
S :摘要数据区域。
M: Messages and prompts.
M :消息和提示。
H: Column headings.
H :列标题。
T: Task information in the process list.
T :进程列表中的任务信息。
We press M to change the prompts.
我们按M更改提示。
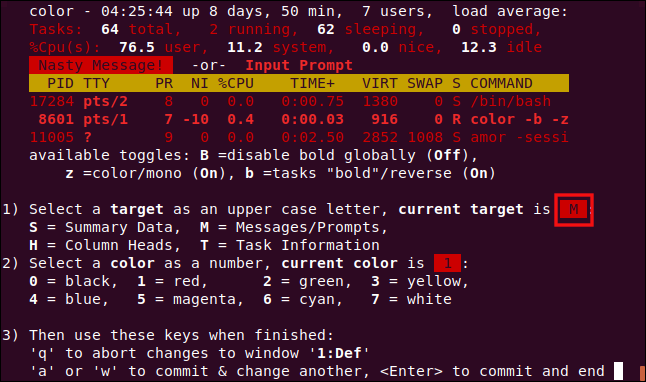
To pick a color, press one of the following numbers:
要选择颜色,请按以下数字之一:
0: Black.
0:黑色
1: Red.
1:红色
2: Green.
2:绿色。
3: Yellow.
3:黄色
4: Blue.
4:蓝色
5: Magenta.
5:洋红色
6: Cyan.
6:青色
7: White.
7:白色
We press 6 to use cyan.
我们按6使用青色。
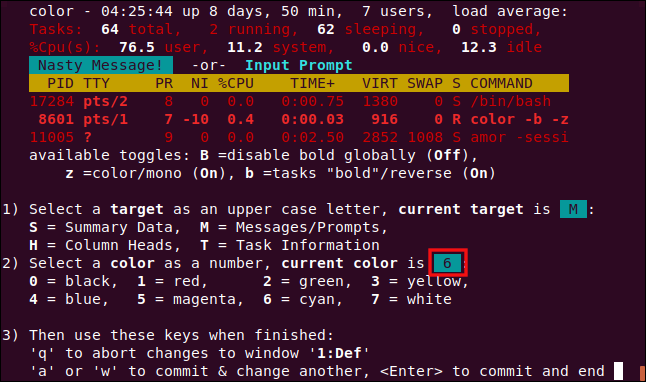
Press Enter to save your settings. Prompts for input will now be in the color you selected.
按Enter保存设置。 输入提示现在将以您选择的颜色显示。
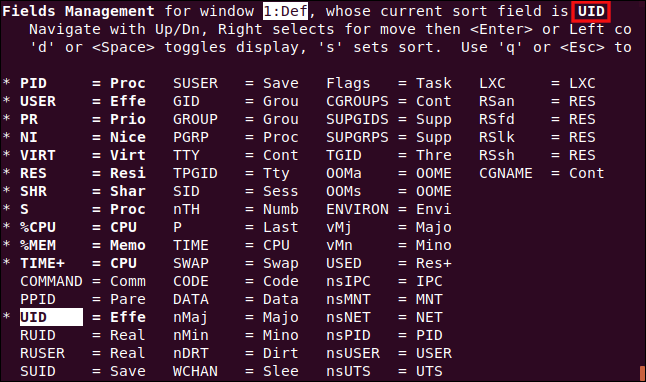
We can also change the columns displayed in the Fields Management screen. Press F to enter the Fields Management screen.
我们还可以更改“字段管理”屏幕中显示的列。 按F进入“字段管理”屏幕。
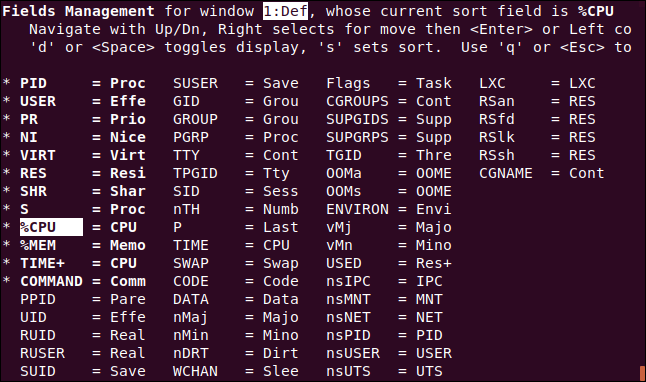
Fields that are displayed have an asterisk (* ) beside them and are highlighted in bold. Press the Up and Down arrows to move the highlight through the list of fields.
显示的字段旁边有一个星号( * ),并以粗体突出显示。 按下向上和向下箭头,将高亮显示在字段列表中。
If you move the highlight off the bottom of a column, it will appear at the top of the next (unless you’re at the bottom of the last column). If you move it off the top of a column, it will appear at the bottom of the previous (unless you’re at the top of the first column).
如果将突出显示从列的底部移开,它将显示在下一列的顶部(除非您位于最后一列的底部)。 如果将其移出列的顶部,它将显示在前一列的底部(除非您位于第一列的顶部)。
We moved the highlight to the COMMAND entry, and then pressed “d” to remove the asterisk (*). We then moved to the UID entry and pressed “d” to place an asterisk next to that entry. This means the COMMAND column won’t be displayed, but the UID column will.
我们将高亮显示移至COMMAND条目,然后按“ d”以删除星号( * )。 然后,我们移至UID条目并按“ d”以在该条目旁边放置一个星号。 这意味着将不会显示COMMAND列,但会显示UID列。
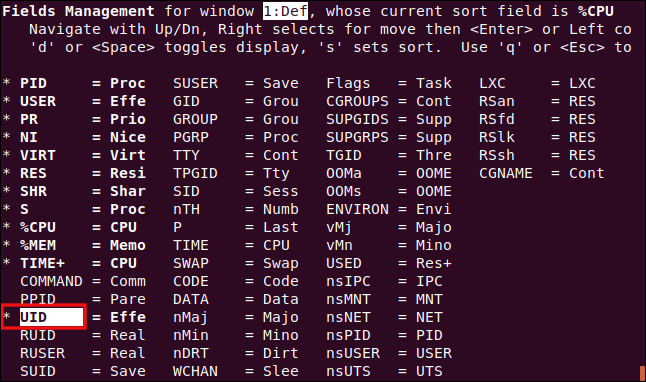
While the highlight is on the UID column, we press “s” to sort the process list on the UID column.
当突出显示在UID列上时,我们按“ s”对UID列上的进程列表进行排序。
Press Enter to save your settings, and then press “q” to leave the Fields Management screen.
按Enter保存您的设置,然后按“ q”退出“字段管理”屏幕。
The UID column has replaced the COMMAND column, and the process list is sorted by it.
UID列已替换COMMAND列,并且COMMAND列表对进程列表进行排序。
替代显示模式 (Alternative Display Mode)
This works best in full-screen mode. Press A to display four areas in the process list, and then press “a” to move from area to area.
这在全屏模式下效果最佳。 按A在进程列表中显示四个区域,然后按“ a”在一个区域之间移动。
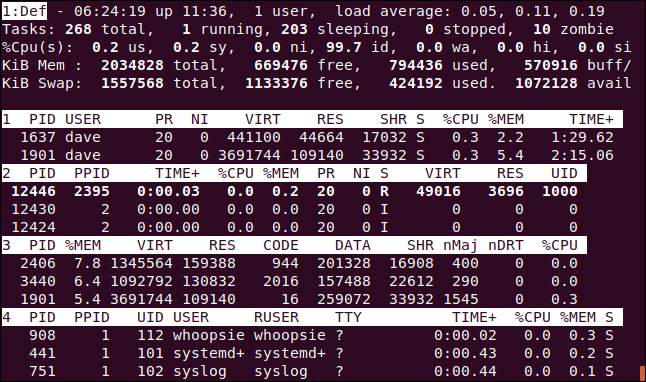
Each area has a different collection of columns, but each is also customizable through the Fields Management screen. This gives you scope to have a full-screen, customized display showing different information in each area, and the ability to sort each area by a different column.
每个区域都有不同的列集合,但是每个区域也可以通过“字段管理”屏幕进行自定义。 这使您可以拥有一个全屏的自定义显示,以在每个区域显示不同的信息,并可以按不同的列对每个区域进行排序。
其他按键 (Other Keystrokes)
The following are some other keys you might find useful in top:
以下是您可能会在top发现有用的其他一些键:
W: Save your settings and customizations so they’ll still be in effect when you next start
top.女 :保存你的设置和自定义所以他们仍然会生效,当你下次启动
top。d: Set a new display refresh rate.
d :设置新的显示刷新率。
Space: Force
topto refresh its display right now.空格 :强制
top立即刷新其显示。
顶级香蕉 (Top Banana)
As we’ve seen, top has quite a repertoire. Other programs, such as htop, have been inspired by it, but they each have their own take on things.
如我们所见, top有很多曲目。 其他程序( 例如htop )也受到了它的启发,但是它们各自都有自己的特色。
However, top is installed everywhere. When you go to businesses to look at networks or servers, you’ll often be told that absolutely nothing can be changed on the live servers. The client makes the rules, so you have to use what’s already installed.
但是, top随处可见。 当您去企业查看网络或服务器时,经常会被告知,实时服务器上绝对没有任何更改。 客户端制定规则,因此您必须使用已安装的内容。
Even if you prefer a different monitoring tool, you should get to know top. Sooner or later, you’ll likely find yourself in a situation where it’s all you’ll have access to.
即使您喜欢其他监视工具,也应该了解top 。 迟早,您可能会发现自己处在所有您可以访问的情况下。
翻译自: https://www.howtogeek.com/668986/how-to-use-the-linux-top-command-and-understand-its-output/


 5万+
5万+


 被折叠的 条评论
为什么被折叠?
被折叠的 条评论
为什么被折叠?
 到【灌水乐园】发言


