


As all other database engines that require a GUI too to interact with, Microsoft built SQL Server Management Studio as a tool that provides an environment to manage, configure, monitor and administrate the SQL Server infrastructure for different kind of instances, that are installed locally at your machine, on a remote server with Windows or Linux operating systems or hosted in the cloud such as SQL Azure or Azure Data warehouse.
与所有其他也需要GUI进行交互的数据库引擎一样,Microsoft构建了SQL Server Management Studio作为一种工具,该工具提供了一种环境来管理,配置,监视和管理SQL Server基础结构,以用于不同种类的实例,这些实例安装在本地您的计算机,具有Windows或Linux操作系统的远程服务器上或托管在云中(例如SQL Azure或Azure数据仓库)的计算机上。
Recall that the SQL Server Management Studio consists of the Object Explorer, which is used to view and manage all objects within the SQL Server instance, the Template Explorer, that is used to deal with the scripting text files and the Solution Explorer, that is responsible for building the projects that contain list of T-SQL scripts in SQL Server.
回想一下,SQL Server Management Studio由对象浏览器 (用于查看和管理SQL Server实例中的所有对象), 模板浏览器 (用于处理脚本文本文件)和解决方案浏览器 (负责)组成。用于在SQL Server中构建包含T-SQL脚本列表的项目。
In my previous related articles of this series, What’s new in SQL Server Management Studio 17.2; Authentication methods, scripting options and more and What’s new in SQL Server Management Studio 17.3; Import Flat File wizard and XEvent Profiler, we went through the newly added features and improvements performed on the already existing features of the SQL Server Management Studio, such as the new options on the connection dialog box, the new scripting option, the embedded Performance Dashboard and the Showplan node search that are introduced in SQL Server Management Studio 17.2. In SQL Server Management Studio 17.3, the Import Flat File Wizard and the XEvent Profiler features are introduced, in addition to a large number of bugs in the previous versions of the SQL Server Management Studio that are fixed.
在本系列以前的相关文章中,SQL Server Management Studio 17.2的新增功能; 身份验证方法,脚本选项等以及SQL Server Management Studio 17.3中的新增功能; 导入平面文件向导和XEvent Profiler ,我们经历了SQL Server Management Studio的新增功能以及对现有功能的改进,例如连接对话框上的新选项,新脚本选项,嵌入式Performance Dashboard。以及SQL Server Management Studio 17.2中引入的Showplan节点搜索。 在SQL Server Management Studio 17.3中,除了已修复的早期版本SQL Server Management Studio中的大量错误之外,还引入了导入平面文件向导和XEvent Profiler功能。
Starting from SQL Server 2017, SQL Server Management Studio takes its own track of versioning, by assigning that 17.X number for the new releases of the SSMS, separating it from the SQL Server Engine version number, that is 14.0 for SQL Server 2017 version.
从SQL Server 2017开始,SQL Server Management Studio通过为SSMS的新版本分配该17.X号并将其与SQL Server Engine版本号(对于SQL Server 2017版本为14.0)分开来采用自己的版本控制轨道。
Also, starting from SQL Server 2016 version, SQL Server Management Studio has its own installation media, that is separated from the SQL Server Engine installation, that can be downloaded from the Microsoft Download page and installed to the local machine or server easily, taking into consideration that, the new SSMS version will not replace the already existing SSMS versions. Instead, SSMS 17.X will be installed side by side with the existing SSMS 2016 and 2014 versions.
另外,从SQL Server 2016版本开始,SQL Server Management Studio具有自己的安装介质,该介质与SQL Server Engine安装分开,可以从Microsoft下载页面下载并轻松安装到本地计算机或服务器,请注意,新的SSMS版本不会替代现有的SSMS版本。 相反,SSMS 17.X将与现有SSMS 2016和2014版本并排安装。
SQL Server Management Studio 17.4 is released now, based on the Visual Studio 2015 isolated shell and assigned build number 14.0.17213.0. After installing it to your local machine, you can check that the latest SQL Server Management Studio version is installed by choosing About from the Help menu as in the snapshot below:
SQL Server Management Studio 17.4已发布,该版本基于Visual Studio 2015隔离的外壳并分配了内部版本号14.0.17213.0 。 将其安装到本地计算机后,可以通过从“ 帮助”菜单中选择“ 关于”来检查是否安装了最新版本SQL Server Management Studio,如以下快照所示:
SQL Server Management Studio 17.4 works with all supported versions of SQL Server 2008 and later, including working with Azure SQL Database and Azure SQL Data Warehouse. SSMS 17.4 can work with SQL Server 200 and 2005, but some features may not work properly. From the OS side, SSMS 17.4 supports Windows 7 (64-bit) and later client operating systems and Windows Server 2008 R2 (64-bit) and later versions, making sure that the latest service pack is installed.
SQL Server Management Studio 17.4可用于所有受支持SQL Server 2008及更高版本,包括与Azure SQL数据库和Azure SQL数据仓库一起使用。 SSMS 17.4可以与SQL Server 200和2005一起使用,但是某些功能可能无法正常使用。 从操作系统方面,SSMS 17.4支持Windows 7(64位)和更高版本的客户端操作系统以及Windows Server 2008 R2(64位)和更高版本,确保已安装最新的Service Pack。
In this article, we will discuss a number of important bugs that are fixed in SSMS 17.4, in addition to the most useful enhancements and new features added to the SSMS 17.4.
在本文中,我们将讨论SSMS 17.4中修复的许多重要错误,以及SSMS 17.4中添加的最有用的增强功能和新功能。
In SSMS 17.4, Microsoft updated the SQL Server Management Studio by fixing a large number of bugs that customers faced and reported in the previous SSMS versions. Some of these important bugs that are fixed in this new build include:
在SSMS 17.4中,Microsoft通过修复客户在先前的SSMS版本中遇到和报告的大量错误来更新了SQL Server Management Studio。 在此新版本中修复的一些重要错误包括:
- Table-valued function node cannot be browsed in the database snapshot
- 表值函数节点无法在数据库快照中浏览
- crashed when the connection to the remote machine is lost due to VPN connection issue 崩溃
- IntelliSense is not working well when the user does not have access to the master database 当用户无法访问主数据库时,IntelliSense无法正常运行
- SSMS crashed when the user does not have VIEW SERVER STATE permissions 用户没有“查看服务器状态”权限时,SSMS崩溃
- Closing the XE Profiler live data window will not stop the underlying XE session 关闭XE Profiler实时数据窗口不会停止基础XE会话
- filter on category 按类别过滤
- without Read\Write access on the domain controller could not connect to SQL Server using SQL Authentication 在域控制器上没有读/写访问权限的域用户无法使用SQL身份验证连接到SQL Server
Always On可用性组仪表板增强功能 (Always On availability group dashboard enhancements)
In SQL Server Management Studio 17.4, a new option is added to the Always On Dashboard that is responsible for collecting statistics about the synchronization latency between the primary and the secondary replicas. Right-click on the Always On availability group name and choose Show Dashboard. At the right side of the Always On availability group dashboard, you will find a new option, Collect Latency Data, that is used to start collecting data about the synchronization latency between the Always On availability group replicas, as shown below:
在SQL Server Management Studio 17.4中,向Always On仪表板添加了一个新选项,该选项负责收集有关主副本和辅助副本之间的同步延迟的统计信息。 右键单击Always On可用性组名称,然后选择Show Dashboard 。 在Always On可用性组仪表板的右侧,您会发现一个新选项Collect Latency Data ,该选项用于开始收集有关Always On可用性组副本之间的同步延迟的数据,如下所示:
Clicking on the Collect Latency Data option, the below message will be displayed, informing you that the latency data collection will start working after checking that the SQL Server Agent is working on all replicas, as shown below:
单击“收集延迟数据”选项,将显示以下消息,通知您在检查SQL Server代理是否对所有副本都起作用后,延迟数据收集将开始工作,如下所示:
The collected latency data can be displayed using the two newly added Always On availability group built-in reports; AlwaysOn_Latency_Primary and AlwaysOn_Latency_Secondary. The two reports are viewed by right-clicking on the Availability Group name, choose Reports, then Standard Reports from where you can choose the latency report, as shown in the snapshot below:
可以使用两个新添加的Always On可用性组内置报告来显示收集的延迟数据。 AlwaysOn_Latency_Primary和AlwaysOn_Latency_Secondary 。 通过右键单击可用性组名称,选择Reports ,然后单击Standard Reports ,可以从中选择延迟报告来查看这两个报告,如下面的快照所示:
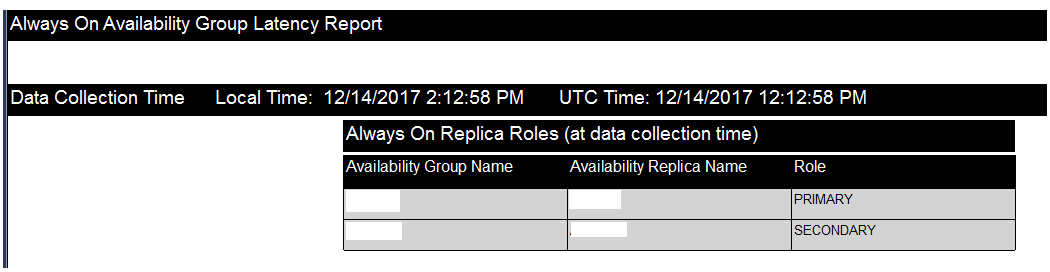
The opened Always On availability group latency report consists of many parts. The first part displays a list of all availability replicas with the role of each replica within the Availability Groups; PRIMARY or SECONDARY, that will be like the below:
打开的“始终在线”可用性组延迟报告包含许多部分。 第一部分显示所有可用性副本的列表,以及可用性组中每个副本的角色。 PRIMARY或SECONDARY,如下所示:
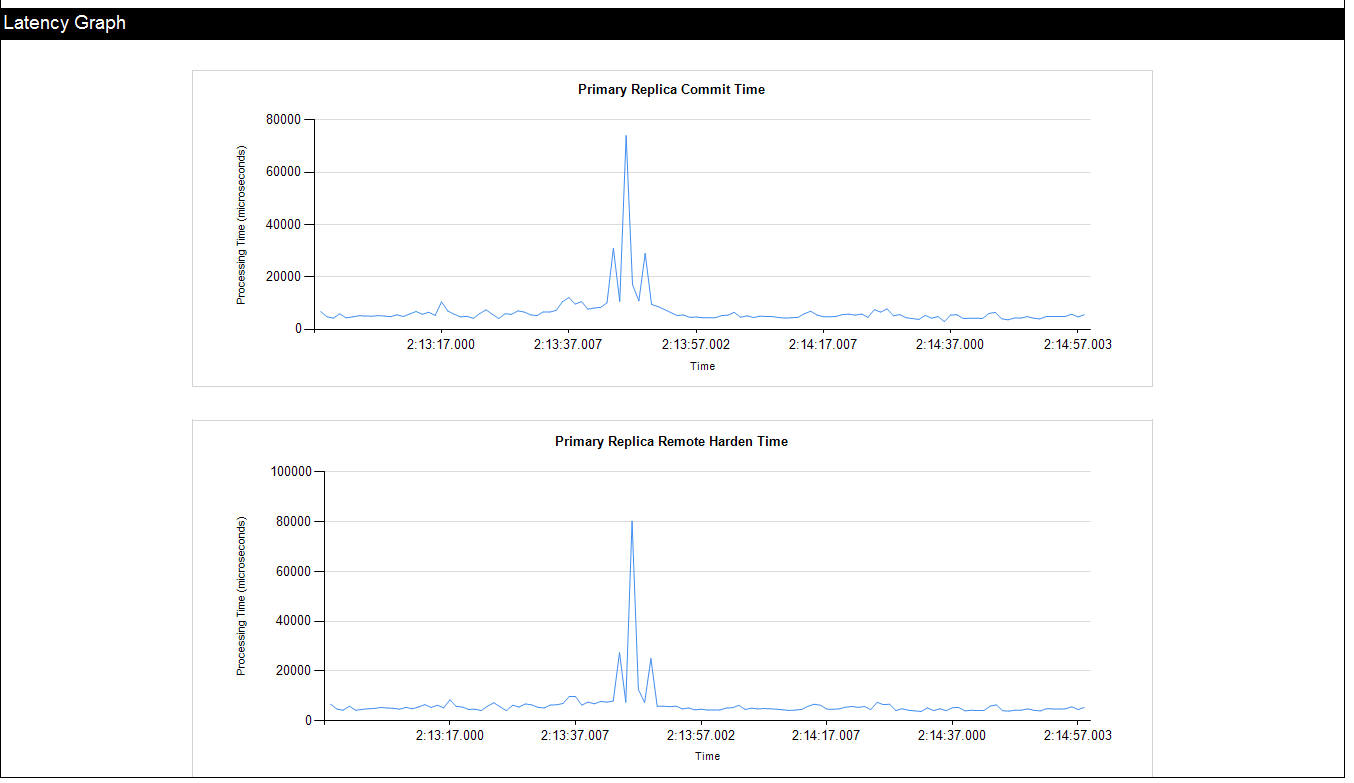
The second part of the Always On availability group latency report is the Latency Graph, that shows the time required to commit the transactions at the PRIMARY side (in microseconds) over a specific period of time, as in the snapshot shown below:
Always On可用性组延迟报告的第二部分是“延迟图”,该图显示了在特定时间段内在PRIMARY端提交事务所需的时间(以微秒为单位),如以下快照所示:
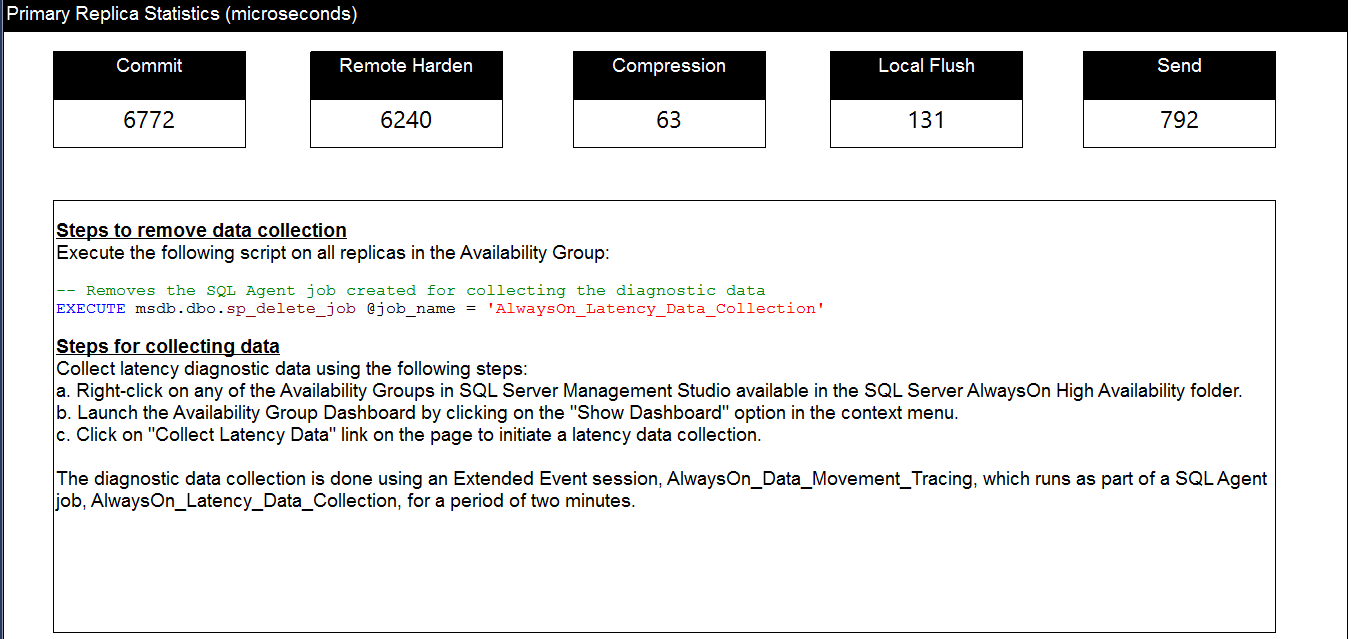
The last section of the Always On availability group latency report is the Primary Replica Statistics, that shows the total amount of time (in microseconds) consumed in the Commit, Remote Harden, Compression, Local Flush and Send processes, as shown below:
Always On可用性组延迟报告的最后一部分是“主副本统计信息”,它显示了“提交”,“远程强化”,“压缩”,“本地刷新”和“发送”过程中消耗的总时间(以微秒为单位),如下所示:
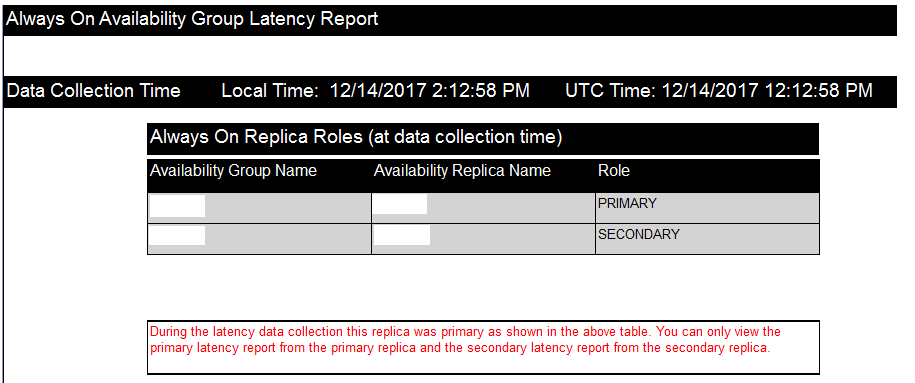
The AlwaysOn_Latency_Primary report can be viewed only from the PRIMARY replica, and the AlwaysOn_Latency_Secondary report can be viewed only from the SECONDARY replica. If you try to open the AlwaysOn_Latency_Secondary from the PRIMARY replica, no statistics, except for the replicas list, will be viewed about the SECONDARY replica, displaying the error message shown in the report result below:
只能从PRIMARY副本中查看AlwaysOn_Latency_Primary报告,并且只能从SECONDARY副本中查看AlwaysOn_Latency_Secondary报告。 如果您尝试从PRIMARY副本中打开AlwaysOn_Latency_Secondary,则将不会查看有关SECONDARY副本的统计信息(副本列表除外),并显示以下报告结果中显示的错误消息:
XE Profiler增强功能 (XE Profiler enhancements)
In SQL Server Management Studio 17.4, a number of enhancements are performed on the XE Profiler, that is added to the SQL Server in SSMS 17.3. These enhancements include:
在SQL Server Management Studio 17.4中,对XE Profiler进行了许多增强,这些增强已添加到SSMS 17.3中SQL Server中。 这些增强功能包括:
- Stop and Start menu commands will stop and start the session by default now 现在,默认情况下,“停止并启动”菜单命令将停止并启动会话
- Keyboard shortcuts, such as CTRL-F or CTRL-H, are enabled 启用了键盘快捷键,例如CTRL-F或CTRL-H
- Database_name and client_hostname actions are added to the appropriate events in XEvent Profiler sessions Database_name和client_hostname操作已添加到XEvent Profiler会话中的适当事件
- XE Profiler in SSMS 17.3 is renamed to XE Profiler在SSMS 17.4中被重命名为XEvent Profiler in SSMS 17.4 as shown below: XEvent Profiler ,如下所示:
导入平面文件向导的增强功能 (Import Flat File Wizard enhancements)
The SQL Server Import Flat File Wizard, that is introduced in SSMS 17.3, enhanced in SSMS 17.4 by providing us with a way to choose the schema name of the destination table that will be created and to which the flat file data will be inserted, as shown below:
SSMS 17.3中引入SQL Server导入平面文件向导在SSMS 17.4中得到了增强,方法是为我们提供一种选择将要创建的目标表的架构名称以及将平面文件数据插入到其中的方式。如下图所示:
漏洞评估 (Vulnerability Assessment)
SQL Server Vulnerability Assessment (VA) service, introduced the first time in SSMS 17.4, is mainly used as a preventative security measure to scan, track and remediate the databases for potential vulnerabilities and deviations from Microsoft’s recommended best practices, such as misconfigurations, excessive permissions, and unprotected sensitive data or any issue that presents risks to the database and its critical data, using a knowledge base of rules that flag security issues when it runs a scan on the database. In other words, the SQL Server Vulnerability Assessment provides us with a visual way to check the security state of our SQL Server instance with actionable steps that help in investigating, managing and resolving the detected issues and provide customized remediation scripts where applicable. The generated Vulnerability Assessment report can be customized for a specific environment, by setting an acceptable baseline for permission configurations, feature configurations, and database settings.
在SSMS 17.4中首次引入SQL Server漏洞评估(VA)服务主要用作预防性安全措施,以扫描,跟踪和修复数据库中的潜在漏洞以及与Microsoft建议的最佳做法的偏离,例如配置错误,权限过多。 ,以及不受保护的敏感数据或任何对数据库及其关键数据构成风险的问题,它们使用规则知识库来标记对数据库进行扫描时的安全性问题。 换句话说,SQL Server漏洞评估为我们提供了一种直观的方式,通过可操作的步骤来检查SQL Server实例的安全状态,这些步骤可帮助调查,管理和解决检测到的问题,并在适用时提供自定义的修复脚本。 通过为权限配置,功能配置和数据库设置设置可接受的基准,可以针对特定环境自定义生成的漏洞评估报告。
SQL Server Vulnerability Assessment helps to proactively improve your database security by meeting the privacy standards, monitoring the dynamic database environments that have frequent changes that are difficult to track. Vulnerability Assessment also provides us with scan reports that are useful for meeting the data protection regulations compliance requirements. The SQL Server Vulnerability Assessment is supported starting from SQL Server 2012 and later versions, with the ability to use it on Azure SQL Database instance.
SQL Server漏洞评估通过满足隐私标准,监视具有难以跟踪的频繁更改的动态数据库环境来帮助主动提高数据库安全性。 漏洞评估还向我们提供了扫描报告,可用于满足数据保护法规合规性要求。 从SQL Server 2012和更高版本开始支持SQL Server漏洞评估,并能够在Azure SQL数据库实例上使用它。
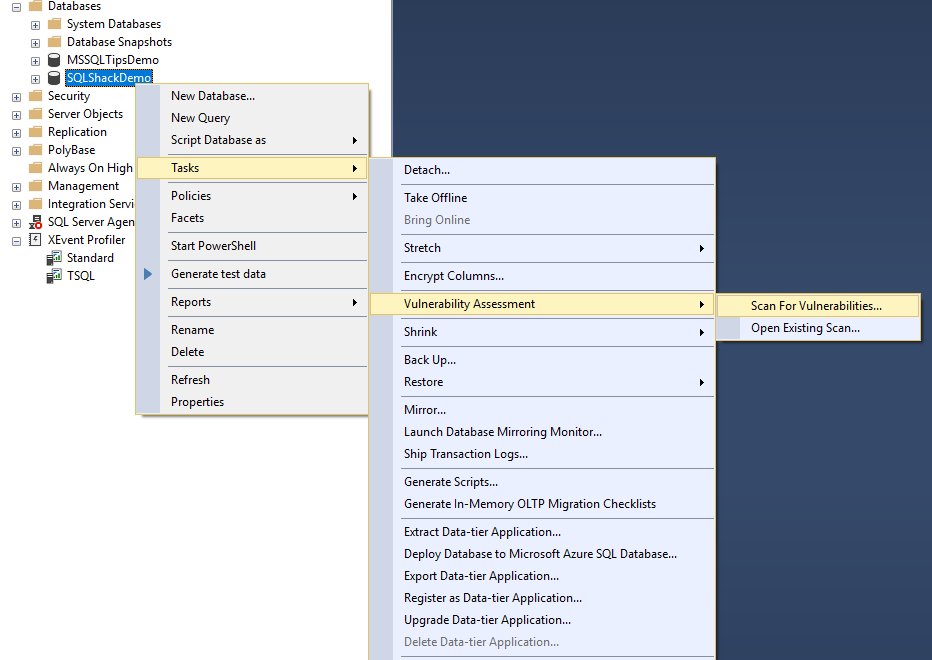
The SQL Server Vulnerability Assessment can be started on a specific database, by right-clicking on that database, choose Tasks and from the Vulnerability Assessment task select Scan For Vulnerabilities… as shown below:
可以在特定数据库上启动SQL Server漏洞评估,方法是右键单击该数据库,选择“ 任务”,然后从“ 漏洞评估”任务中选择“ 扫描漏洞” ...,如下所示:
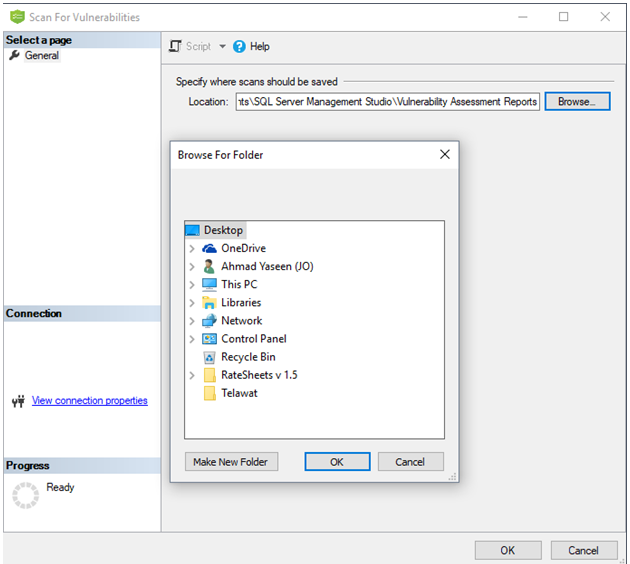
From the Scan For Vulnerabilities window, specify the location where the scans will be saved. You can change the default location by clicking on Browse to specify a customized location. Click OK to start the lightweight and safe vulnerabilities scan on your database, that will take few seconds to run, as shown below:
在“ 扫描漏洞”窗口中,指定将保存扫描内容的位置。 您可以通过单击浏览以指定自定义位置来更改默认位置。 单击“ 确定”以开始对数据库进行轻量级安全漏洞扫描,这将需要几秒钟来运行,如下所示:
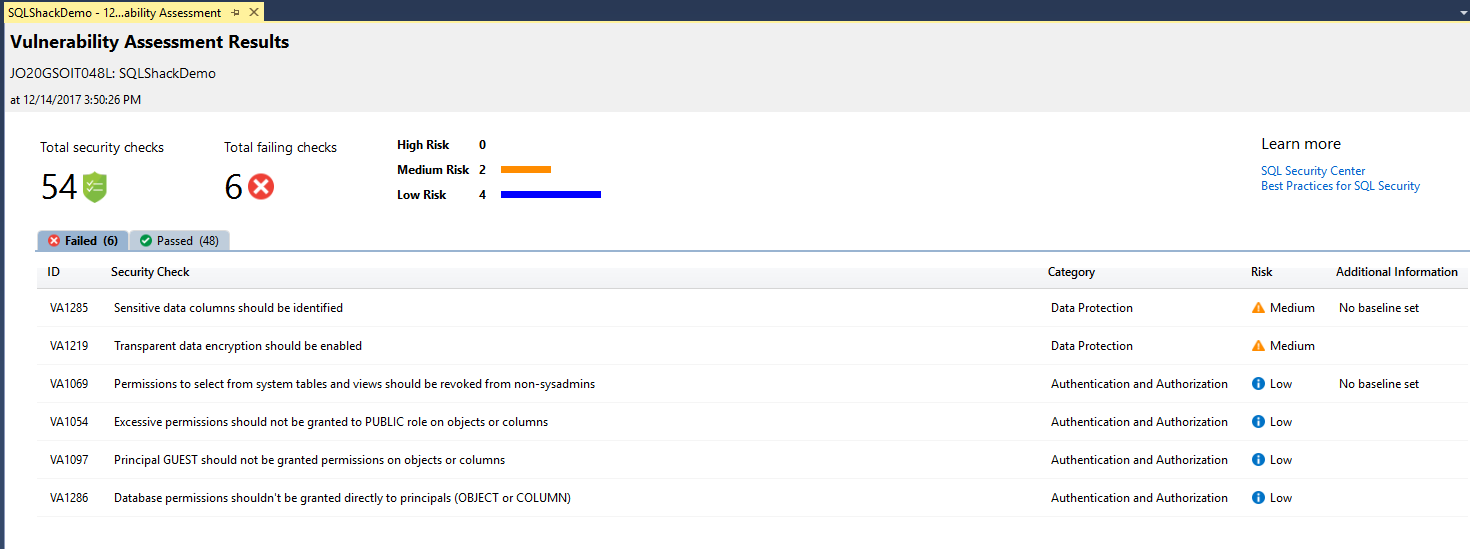
When the scan is completed, the scan report will be saved to the previously specified path and automatically displayed in the SSMS pane. The displayed report contains an overview of the current database security state, including a summary of the total number of security checks and the number of failed checks, with their respective severities. The report includes also a classification of passed and failed checks such as the category that this check belongs to, like sensitive data discovered or an issue with database principals permissions, the risk of that finding that describes its deviations from best practices and any extra information, if available, as shown in the scan report below:
扫描完成后,扫描报告将保存到先前指定的路径,并自动显示在SSMS窗格中。 显示的报告包含当前数据库安全状态的概述,包括安全检查总数和失败检查数目的摘要以及各自的严重性。 该报告还包括已通过和未通过检查的分类,例如该检查所属的类别,例如发现的敏感数据或数据库主体权限存在的问题,发现发现其偏离最佳做法的风险以及任何其他信息,如果可用,如下面的扫描报告中所示:
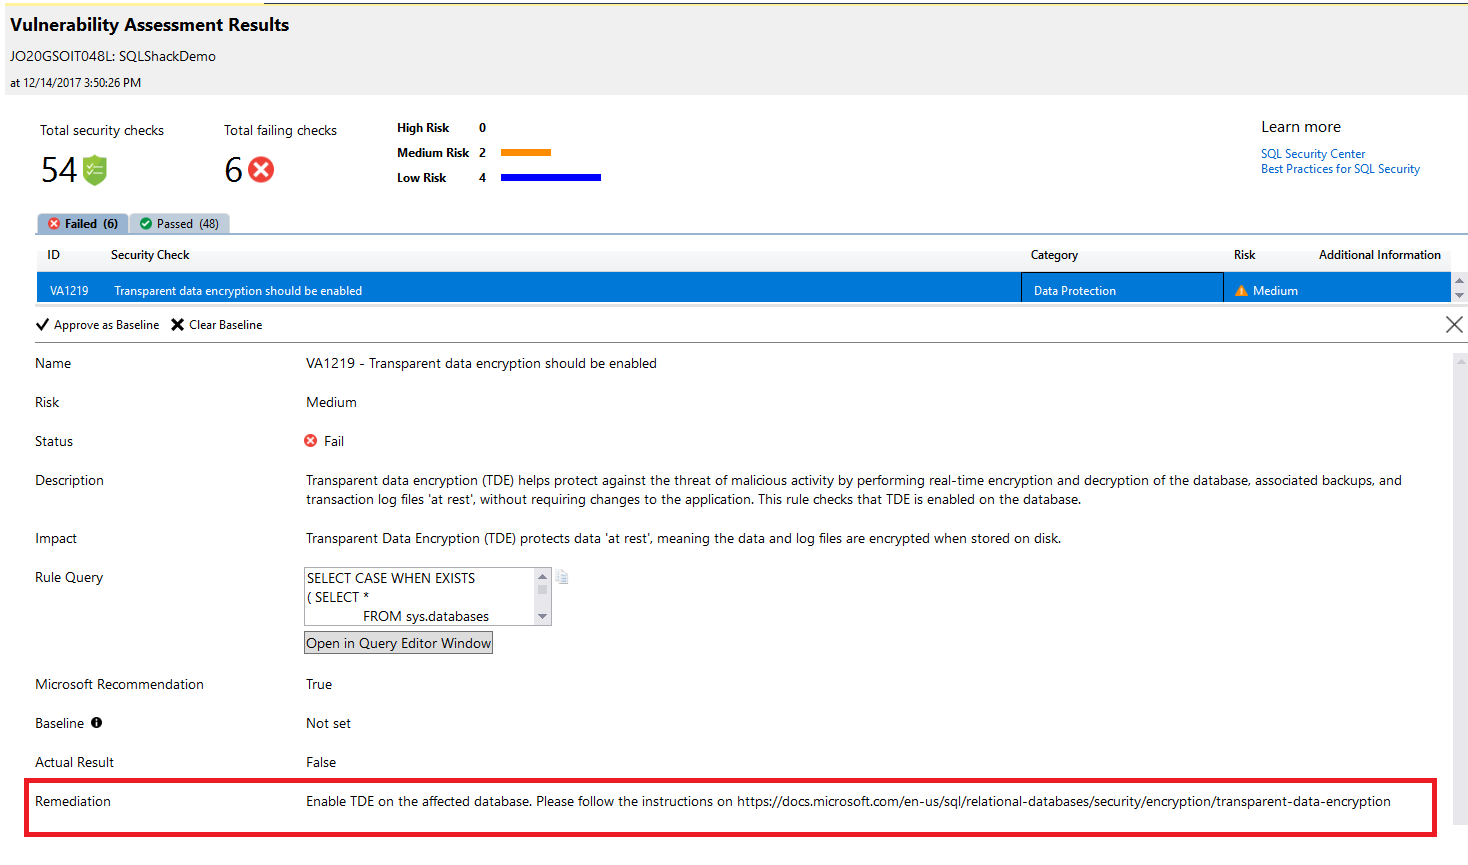
If you find that a specific failed check is very critical for your environment, click on it and drill down to check full detailed information about that finding including full description about it, the impact of that issue, why it failed and an actionable remediation information that can be used to overcome and resolve that issue, as shown below:
如果您发现特定的失败检查对您的环境至关重要,请单击它并向下钻取以查看有关该发现的完整详细信息,包括有关此发现的完整说明,该问题的影响,失败的原因以及可采取的补救措施可以用来克服和解决该问题,如下所示:
SQL Server Vulnerability Assessment scan report allows you to mark a specific result as being an acceptable customized baseline in your SQL Server instance. In this way, the generated scan report will measure the deviations from the baselines you specified and the results that will match the specified baseline will be considered as passed in the scanning process, as you can see in the report below:
SQL Server漏洞评估扫描报告使您可以将特定结果标记为SQL Server实例中可接受的自定义基准。 这样,生成的扫描报告将测量与您指定的基准的偏差,并且与指定基准匹配的结果将被视为在扫描过程中通过,如您在以下报告中所看到的:
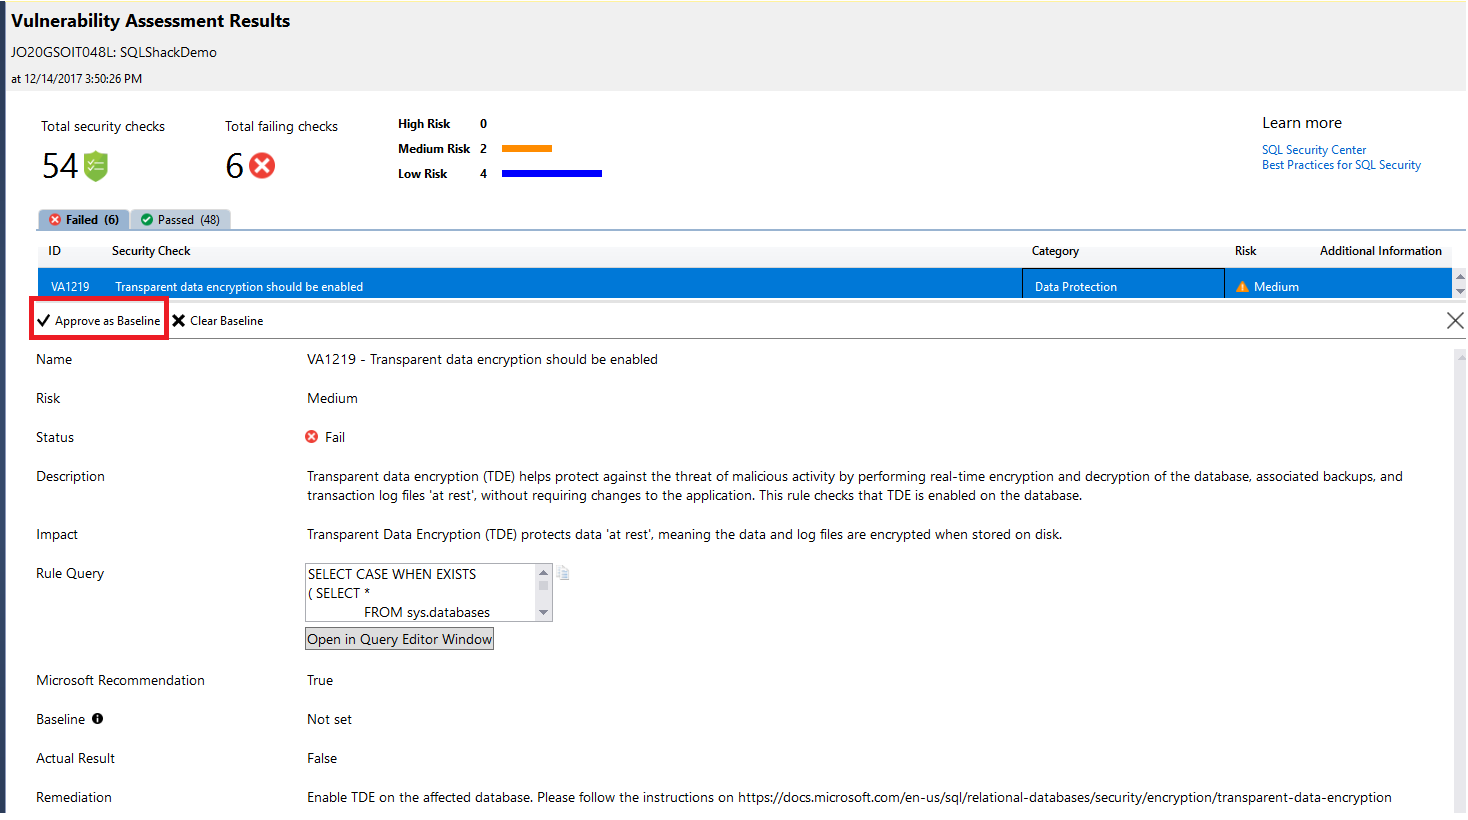
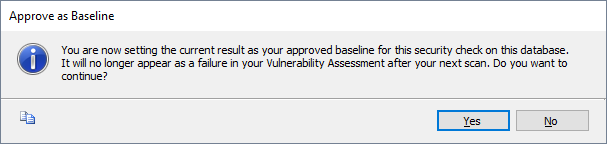
If you choose a specific check to be Approved as Baseline, the below message will be displayed to make sure that you choose that check as a baseline for your environment. Click Yes to confirm:
如果您选择要被批准为基准的特定检查,则会显示以下消息,以确保您选择该检查作为环境的基准。 单击是确认:
And the report will mention that you need to run a new scan to start taking the selected baseline in the consideration as shown in the message below:
该报告将提到您需要运行新的扫描以开始考虑以下消息中所示的所选基准:
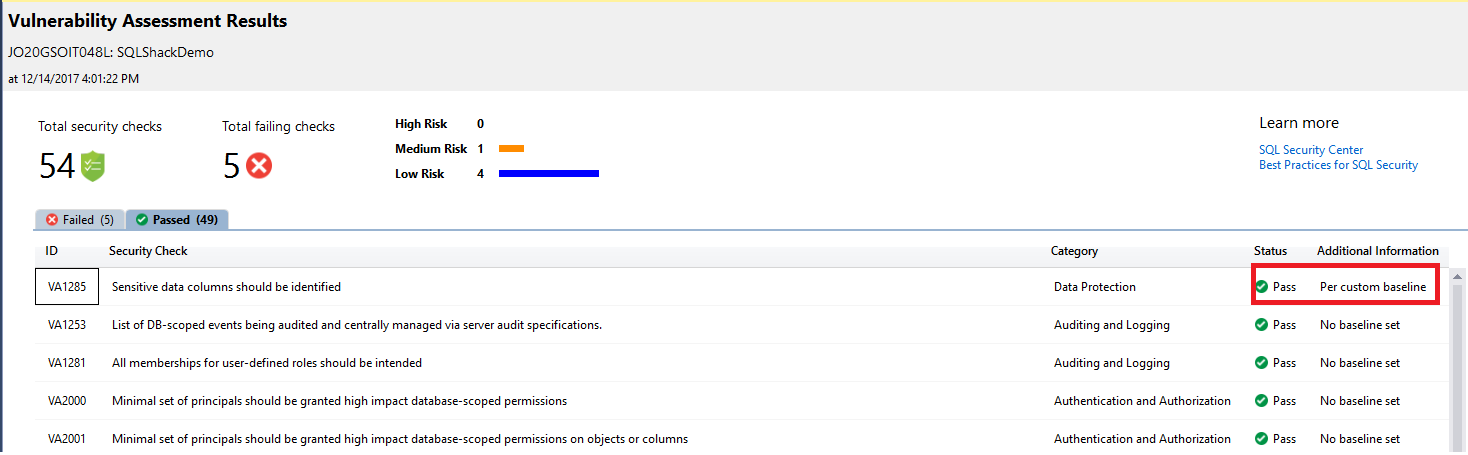
Running a new scan to track the customized baseline rule, the report will display the checks that are performed based on its deviation from the approved baseline, as shown in the new scan result below:
运行新的扫描以跟踪自定义的基线规则,该报告将显示基于其与批准的基线的偏差执行的检查,如下面的新扫描结果所示:
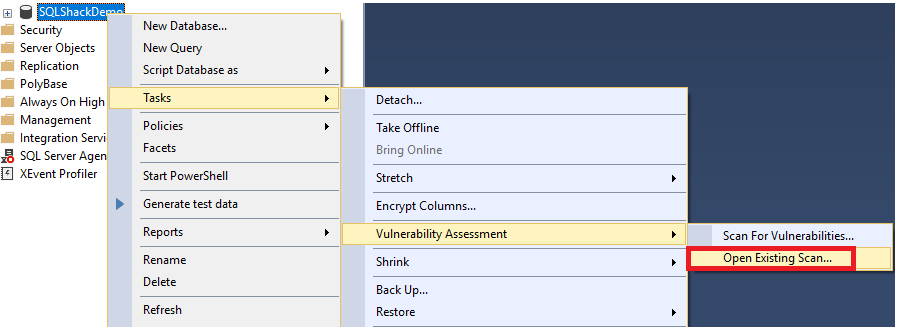
As mentioned previously, the scan result will be saved in a default or customized location. This helps you to view any previous Vulnerability Assessments scan results. Right-click on the database, choose Tasks and from the Vulnerability Assessment task select Open Existing Scan… as shown below:
如前所述,扫描结果将保存在默认位置或自定义位置。 这可以帮助您查看以前的任何漏洞评估扫描结果。 右键单击数据库,选择“ 任务”,然后从“ 漏洞评估”任务中选择“ 打开现有扫描” ,如下所示:
And from the opened scans directory, you can choose the Vulnerability Assessments scan result you want to view as below:
从打开的扫描目录中,您可以选择要查看的漏洞评估扫描结果,如下所示:
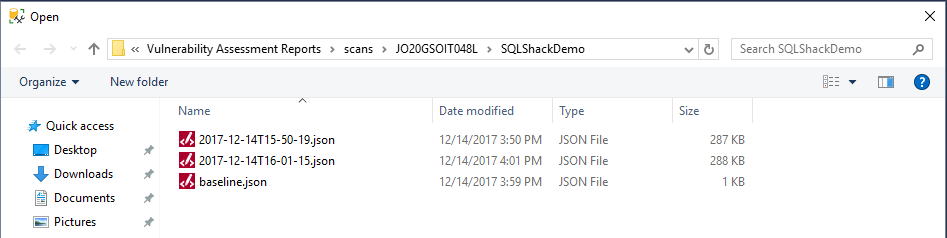
You can also view the old Vulnerability Assessments scan by choosing Open from the File menu. Then select Vulnerability Assessment… and from the opened scans directory you can choose the Vulnerability Assessments scan result you want to view as follows:
您还可以通过从“ 文件”菜单中选择“ 打开”来查看旧的“漏洞评估”扫描。 然后选择“ 漏洞评估...”,然后从打开的扫描目录中选择要查看的“漏洞评估”扫描结果,如下所示:
As you see from the previous results, the Vulnerability Assessments helps in monitoring database security state and maintaining it at a high level of security all the time, in addition to the ability to set your own baselines that fit your organization’s policies. It also provides you with useful security scan reports for the compliance process.
从以前的结果中可以看到,漏洞评估除了能够设置适合组织策略的自己的基准外,还有助于始终监视数据库安全状态并将其始终保持在较高的安全级别。 它还为您提供有用的安全扫描报告,以确保合规性 处理。
Previous articles in this series:
本系列以前的文章:
- What’s new in SQL Server Management Studio 17.2; Authentication methods, scripting options and more
- SQL Server Management Studio 17.2中的新增功能; 身份验证方法,脚本选项等
- What’s new in SQL Server Management Studio 17.3; Import Flat File wizard and XEvent Profiler
- SQL Server Management Studio 17.3的新增功能; 导入平面文件向导和XEvent Profiler
Next articles in this series:
本系列的下一篇文章:
- What’s new in SQL Server Management Studio 17.5; Data Discovery and Classification and more
- SQL Server Management Studio 17.5的新增功能; 数据发现和分类等
参考资料 (References)
- SQL Vulnerability Assessment SQL漏洞评估
- What’s new in SSMS 17.4: SQL Vulnerability Assessment SSMS 17.4中的新增功能:SQL漏洞评估
- Download SQL Server Management Studio (SSMS) 下载SQL Server Management Studio(SSMS)
- SQL Server Management Studio – Changelog (SSMS) SQL Server Management Studio –变更日志(SSMS)


 被折叠的 条评论
为什么被折叠?
被折叠的 条评论
为什么被折叠?
 到【灌水乐园】发言


